Cardiovascular and Metabolic Risk O R I G I N A L
A R T I C L E
Development and Validation of a Predicting Model of All-Cause Mortality in Patients With Type 2 Diabetes Mellitus SALVATORE DE COSMO, MD1 MASSIMILIANO COPETTI, MSC2 OLGA LAMACCHIA, MD3 ANDREA FONTANA, MSC2 MICHELA MASSA, MD1 ELEONORA MORINI, MD4 ANTONIO PACILLI, MD1 STEFANIA FARIELLO, MD3
ANTONIO PALENA, MD1 ANNA RAUSEO, MD1 RAFAELLA VITI, MD1 ROSA DI PAOLA, PHD4 CLAUDIA MENZAGHI, PHD4 MAURO CIGNARELLI, MD3 FABIO PELLEGRINI, MSC2,5 VINCENZO TRISCHITTA, MD4,6
OBJECTIVEdTo develop and validate a parsimonious model for predicting short-term allcause mortality in patients with type 2 diabetes mellitus (T2DM). RESEARCH DESIGN AND METHODSdTwo cohorts of patients with T2DM were investigated. The Gargano Mortality Study (GMS, n = 679 patients) was the training set and the Foggia Mortality Study (FMS, n = 936 patients) represented the validation sample. GMS and FMS cohorts were prospectively followed-up for 7.40 6 2.15 and 4.51 6 1.69 years, respectively, and all-cause mortality was registered. A new forward variable selection within a multivariate Cox regression was implemented. Starting from the empty model, each step selected the predictor that, once included into the multivariate Cox model, yielded the maximum continuous net reclassification improvement (cNRI). The selection procedure stopped when no further statistically significant cNRI increase was detected. RESULTSdNine variables (age, BMI, diastolic blood pressure, LDL cholesterol, triglycerides, HDL cholesterol, urine albumin-to-creatinine ratio, and antihypertensive and insulin therapy) were included in the final predictive model with a C statistic of 0.88 (95% CI 0.82–0.94) in the GMS and 0.82 (0.76–0.87) in the FMS. Finally, we used a recursive partition and amalgamation algorithm to identify patients at intermediate and high mortality risk (hazard ratio 7.0 and 24.4, respectively, as compared with those at low risk). A web-based risk calculator was also developed. CONCLUSIONSdWe developed and validated a parsimonious all-cause mortality equation in T2DM, providing also a user-friendly web-based risk calculator. Our model may help prioritize the use of available resources for targeting aggressive preventive and treatment strategies in a subset of very high-risk individuals.
T
he mortality rate of diabetic patients is about twice as much as that of nondiabetic individuals of a similar age (1); this makes diabetes a leading risk
factor for mortality, which accounts for 2.9 million global events yearly (2). This scenario is expected to further deteriorate, given that diabetes prevalence is
c c c c c c c c c c c c c c c c c c c c c c c c c c c c c c c c c c c c c c c c c c c c c c c c c
From the 1Unit of Endocrinology, IRCCS Casa Sollievo della Sofferenza, San Giovanni Rotondo, Italy; the 2 Unit of Biostatistics, IRCCS Casa Sollievo della Sofferenza, San Giovanni Rotondo, Italy; the 3Unit of Endocrinology, Department of Medical and Surgical Sciences, University of Foggia, Foggia, Italy; the 4 Research Unit of Diabetes and Endocrine Diseases, IRCCS Casa Sollievo della Sofferenza, San Giovanni Rotondo, Italy; the 5Unit of Biostatistics, Consorzio Mario Negri Sud, Santa Maria Imbaro, Italy; and the 6 Department of Experimental Medicine, Sapienza University of Rome, Rome, Italy. Corresponding author: Salvatore De Cosmo,
[email protected], or Vincenzo Trischitta, vincenzo
[email protected]. Received 18 September 2012 and accepted 21 February 2013. DOI: 10.2337/dc12-1906 This article contains Supplementary Data online at http://care.diabetesjournals.org/lookup/suppl/doi:10 .2337/dc12-1906/-/DC1. S.D.C. and M.C. contributed equally to this work. © 2013 by the American Diabetes Association. Readers may use this article as long as the work is properly cited, the use is educational and not for profit, and the work is not altered. See http://creativecommons.org/ licenses/by-nc-nd/3.0/ for details.
increasing worldwide (3). Thus, predicting mortality in diabetic patients is definitively needed in order to target aggressive prevention strategies to very high-risk patients. Only a few models for predicting allcause mortality in diabetic patients have been proposed thus far (4–6). Unfortunately, none of them have been validated in an external cohort. In addition, these models have used standard approaches that are not specifically suited for prediction model building. Instead, new attractive statistical methods based on the use of the reclassification measures (7–13) have become recently available when prediction model building is at issue; among these, the continuous net reclassification improvement (cNRI) has been mathematically proven to be a measure of effect size. The aim of our study was to develop a parsimonious model for predicting shortterm all-cause mortality in patients with type 2 diabetes mellitus (T2DM) based on the use of a forward variable selection driven by the cNRI approach and validate it in a second independent sample. For this purpose, two prospective studies on patients with T2DM, the Gargano Mortality Study (GMS) and the Foggia Mortality Study (FMS), were analyzed. RESEARCH DESIGN AND METHODSdTwo cohorts of patients with T2DM have been investigated: the GMS and the FMS. GMS Whites (n = 1,028) from Italy with T2DM (according to American Diabetes Association [ADA] 2003 criteria) were consecutively recruited at the Scientific Institute “Casa Sollievo della Sofferenza” in San Giovanni Rotondo (Apulia, centralsouthern Italy) from 1 November 2000 to 30 September 2005 for a study aimed at unraveling predictors of incident allcause mortality. The only exclusion criterion was the presence of poor life expectancy due to malignancies. To date, this cohort has been followed-up for 7.40 6 2.15 years (range 0.04–9.83), with the last information on vital status obtained on 30
care.diabetesjournals.org
DIABETES CARE
Diabetes Care Publish Ahead of Print, published online May 1, 2013
1
Risk engine for predicting all-cause mortality November 2010. After excluding patients 1) whose information on vital status at follow-up was not available (n = 190) and 2) who had some missing data for one or more baseline features (n = 159), 679 patients with T2DM (66.0% of the initial cohort) constituted the eligible sample for the present analysis. Observed missing data rates were as follows: BMI 1.1%, diabetes duration 0.2%, HbA 1c 2.4%, systolic blood pressure (SBP) 0.9%, diastolic blood pressure (DBP) 0.9%, LDL cholesterol 1.6%, HDL cholesterol 3.2%, triglycerides 1.0%, albuminto-creatinine ratio (ACR) 4.5%, estimated glomerular filtration rate (eGFR) 2.5%, lipid-lowering therapy 0.5%, insulin therapy 3.1%, and antihypertensive therapy 8.7%. FMS Whites (n = 1,153) from Italy with T2DM (according to ADA 2003 criteria) were consecutively recruited at the Endocrine Unit of the University of Foggia (Apulia, central-southern Italy) from 7 January 2002 to 30 September 2008 for a study aimed at unraveling predictors of incident all-cause mortality. Also in this case, the only exclusion criterion was the presence of poor life expectancy due to malignancies. To date, this cohort has been followed-up for 4.51 6 1.69 years (range 0.03–9.42), with the last information on vital status obtained on 31 March 2011. After excluding patients 1) whose information on vital status at follow-up was not available (n = 91) and 2) who had missing data at baseline (n = 126), 936 patients with T2DM (81.2% of the initial cohort) constituted the eligible sample for the present analysis. Observed missing data rates were as follows: age 5.9%, smoking habits 8.2%, BMI 6.8%, diabetes duration 4.0%, HbA1c 6.1%, SBP 6.0%, DBP 6.0%, LDL cholesterol 7.5%, HDL cholesterol 6.4%, triglycerides 6.2%, ACR 7.6%, eGFR 6.0%, lipid-lowering therapy 5.8%, insulin therapy 5.9%, and antihypertensive therapy 5.7%. Data collection At baseline, all patients were interviewed regarding age at diabetes diagnosis and ongoing antidiabetic, hypolipidemic, and antihypertensive treatments. Duration of diabetes was calculated from the calendar year of data collection minus the calendar year of diabetes diagnosis. All subjects enrolled in the study underwent physical examination, including measurements of 2
DIABETES CARE
height, weight, BMI, and blood pressure (i.e., two measurements rounded to the nearest 2 mmHg in the sitting position after at least 5 min rest, using an appropriate-sized cuff; DBP was recorded at the disappearance of Korotokoff sound, phase V). Fasting venous blood was sampled from an antecubital vein from all patients for the measurement of standardized serum creatinine by using the modified kinetic Jaffè reaction (Hitachi 737 Autoanalyzer), total serum cholesterol (enzymatic method; Cobas; Roche Diagnostics, Welwin Garden City, U.K.), HDL cholesterol, serum triglycerides (enzymatic method; Cobas), and HbA 1c (HPLC Diamat Analyzer; Bio-Rad, Richmond, CA). Urinary albumin and creatinine concentration were determined the same morning of the clinical examination from an early-morning first void sterile urine sample by the nephelometric method (Behring Nephelometer Analyzer; Behring, Marburg, Germany) and the Jaffè reaction-rate method, respectively. The urinary ACR was then calculated. eGFR was calculated with the abbreviated Modification of Diet in Renal Disease (MDRD) formula (13). Study end point. All-cause mortality was the only end point of this study. At follow-up, the vital status of study patients was ascertained by two authors for each study either by telephone interview with the patient or his/her relatives or by queries to the registry office of cities of residence. Vital status and date of death were checked and recorded from 1–30 November 2010 for GMS and from 1–31 March 2011 for FMS. Statistical methods Patient baseline characteristics were reported as frequency (percentage) and mean 6 SD or median along with lower and upper quartiles. Geometric mean and SD were reported for logarithmtransformed variables. Overall and ageadjusted death incidence rates for 100 person-years were also reported and compared using a Poisson model. Time-to-death analyses were performed using multivariate Cox proportional hazards regression models, and risks were reported as hazard ratios (HRs) along with their 95% CIs. The assumption of proportionality of the hazards was tested by using scaled Schoenfeld residuals. The overall survival was defined as the time between enrollment and death. For subjects who did not experience the end point, survival time
was censored at the time of the last available follow-up visit. Survival curves and survival probabilities were reported according to the Kaplan-Meier method. Discriminatory power was assessed by estimating survival C indices, along with 95% CI, and comparison between C indices was carried out according to the Pencina and D’Agostino approach (7). The survival-based Hosmer-Lemeshow measure of calibration (8) was also assessed. To control the accuracy of predictions and to increase the reliability of all statistical analyses, the prediction model was built on a “training set,” represented by the GMS, and eventually tested on a “validation set,” represented by the FMS. We chose GMS as a training set because of the longer follow-up as compared with FMS, which allowed a more stable estimation of the prediction model. Continuous variables, specifically BMI, SBP, DBP, LDL, triglycerides, HDL, eGFR, and ACR, suspected to violate the multiplicative model linearity assumption were log transformed. To build the final prediction model, we used a new forward variable selection within a multivariate Cox regression. Starting from the empty model, each step selected the predictor that, once included into the multivariate Cox model, yielded the maximum cNRI (9–13,14). The selection procedure, which analyzed all available variables, stopped when no further statistically significant cNRI was detected. cNRI has been preferred to the classical Wald P value because our purpose was to build a prediction model rather than to assess statistical associations. Furthermore, cNRI can be directly interpreted as a measure of effect size (12). Since we were interested in predicting short-term all-cause mortality, we decided to set the time horizon for risk prediction at 2 years. In addition, we reasoned that since .90% of the sample has a follow-up of .2 years, very reliable would have been obtained. Results for prediction at 4 years were also reported. A multivariate Cox proportional hazards regression model with robust standard errors was also used in the combined analysis on the pooled samples, accounting for potential clustering due to study effect (15). Regression coefficients from the fitted Cox model were also used to develop an interactive web-based tool that calculates 2-year mortality risk predictions. Indeed, a normalized overall mortality risk score (i.e., ranging from 0 to 1) was computed for each patient as care.diabetesjournals.org
De Cosmo and Associates the sum of the selected nine predictors weighted according to Cox regression coefficients. Furthermore, the recursive partitioning and amalgamation (RECPAM) algorithm (16,17) was used to identify subgroups of patients at different mortality risks according to the mortality risk score. The free web-based calculator is available at http://www.operapadrepio. it/rcalc/rcalc.php. The strategy of combining samples provides more stable and precise risk scores, as widely reported in the literature (18–22). All statistical analyses were performed using SAS Software Release 9.1.3 (SAS Institute, Cary, NC). RECPAM analysis was carried out with a macro written in SAS by one of the authors (F.P.). RESULTS The GMS as a training set Baseline clinical features of the 679 study patients are shown in Table 1. During follow-up (7.32 6 2.12 years), 133
(19.6%) patients died with an annual incidence rate of 2.7%. We used the cNRI-driven forward variable selection (see STATISTICAL METHODS for details) to build the 2-year mortality risk prediction model, including each predictor one by one. As recently demonstrated (12), cNRI is the appropriate statistic to build a predictive nested model instead of the C statistic or the Wald association P values. The model building stopped at step nine as no statistically significant values of cNRI were further observed (Supplementary Table 1). Therefore, the final model comprised patient age, BMI, DBP, LDL, triglyceride, HDL, and ACR levels, and antihypertensive and insulin therapy. This parsimonious 2-year mortality prediction model yielded a C statistic = 0.88 (95% CI 0.82–0.94) and was calibrated (P value = 0.95). The same model also performed well in the 4-year mortality prediction with a C statistic = 0.81 (0.75–0.86) and was also calibrated (P value = 0.73). In addition, the survival
C statistic was not different across sex strata, being 0.905 (0.846–0.965) and 0.891 (0.821–0.960) in men and women, respectively. The FMS as a validation sample The FMS was used as an external sample to validate our prediction model generated in the GMS. Baseline clinical features of the 936 study patients are reported in Table 1. During follow-up (4.52 6 1.71 years), 169 (18.0%) patients died with an annual incidence rate of 4.0%. The ageadjusted annual incidence rate in FMS was 2.4% and was not different from that observed in GMS (i.e., 2.1%, P = 0.30). Using the model built in the GMS, the prediction of 2-year mortality in FMS yielded a C statistic = 0.82 (95% CI 0.76–0.87) and was calibrated (P value = 0.66). Similar results were obtained for prediction of 4-year mortality (i.e., C statistic = 0.80 [0.76–0.84]; P value for calibration = 0.71).
Table 1dBaseline clinical features of study patients from GMS (n = 679) and FMS (n = 936) sample GMS
FMS
Variable
Mean 6 SD
Median (lower 2 upper quartile)
Mean 6 SD
Median (lower 2 upper quartile)
Age (years) Sex (n, %) Female Male Smoking habits (n, %) Yes No BMI (kg/m2)* Diabetes duration (years) HbA1c (%) HbA1c (mmol/mol) SBP (mmHg)* DBP (mmHg)* LDL cholesterol (mg/dL)* HDL cholesterol (mg/dL)* Triglycerides (mg/dL)* ACR (mg/mmol)* eGFR (mL/min 3 1.73 m2)* Lipid-lowering therapy (n, %) No Yes Insulin therapy (n, %) No Yes Antihypertensive therapy (n, %) No Yes
62.1 6 9.8
62.0 (55.0–69.0)
63.6 6 11.8
63.0 (56.0–73.0)
339 (49.9%) 340 (50.1%)
30.4 6 8.9 8.37 6 4.14 8.7 6 1.9 72 6 21 132.7 6 27.1 77.5 6 17.8 113.5 6 24.1 42.4 6 11.4 136.3 6 27.9 1.8 6 3.8 72.5 6 17.0
93 (13.7%) 586 (86.3%) 30.1 (26.8–33.7) 10.00 (3.00–18.00) 8.5 (7.2–10.0) 69 (55–86) 130.0 (125.0–140.0) 80.0 (70.0–82.5) 119.6 (92.2–143.2) 42.0 (36.0–52.0) 132.0 (95.0–187.0) 1.2 (0.6–3.8) 76.0 (65.0–88.0)
456 (48.7%) 480 (51.3%)
29.6 6 8.8 8.40 6 4.00 9.0 6 2.1 75 6 23 129.2 6 26.6 76.0 6 17.6 97.0 6 21.3 44.9 6 11.9 143.4 6 29.1 2.5 6 4.3 78.5 6 18.1
424 (45.3%) 512 (54.7%) 29.5 (25.7–33.3) 11.00 (5.00–20.00) 8.9 (7.4–10.3) 74 (57–89) 130.0 (120.0–140.0) 80.0 (70.0–80.0) 101.0 (77.2–127.5) 45.0 (37.0–54.0) 139.0 (99.0–198.5) 1.79 (0.66–7.22) 85.6 (64.2–103.2)
457 (67.3%) 222 (32.7%)
614 (65.6%) 322 (34.4%)
394 (58.0%) 285 (42.0%)
597 (63.8%) 339 (36.2%)
278 (40.9%) 401 (59.1%)
292 (31.2%) 644 (68.8%)
Continuous variables were reported as mean 6 SD and as median (lower 2 upper quartile). Categorical variables were reported as frequency (percentage). *Continuous logarithm-transformed variables were reported as geometric mean 6 SD and as median (lower 2 upper quartile).
care.diabetesjournals.org
DIABETES CARE
3
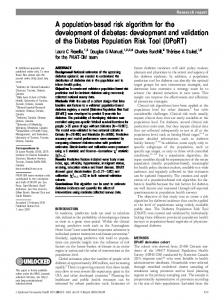
Risk engine for predicting all-cause mortality Pooled sample Multivariate HRs for 2-year mortality of the nine variables comprised in our predictive model were estimated on pooled samples and are reported in Supplementary Table 2. The prediction model had, in the pooled samples, a C statistic = 0.84 (95% CI 0.79–0.88) and was calibrated (P value = 0.99). The overall mortality risk score, built using the estimated Cox regression coefficients, normalized to a range from 0 to 1, had mean = 0.53 and SD = 0.16 (its distribution is reported in Supplementary Fig. 1). A Cox-based RECPAM analysis of 2-year mortality partitioned the pooled sample into three risk categories according to different levels of the overall mortality risk score. Survival curves, stratified into low (i.e., risk score #0.67), intermediate (risk score ranging from 0.68 to 0.79), and high (risk score $0.80) risk, are reported in Fig. 1. As compared with individuals with low risk score, those with intermediate and high risk had HR 7.0 (95% CI 4.2–11.6) and 24.4 (14.4–41.5), respectively. CONCLUSIONSdDespite T2DM being a leading cause of overall mortality, so
far, few models have been developed for predicting diabetes-related mortality (4– 6). To the best of our knowledge, this is the first study developing a well-performing model for this event that was validated in a second independent sample. In addition, our model is parsimonious, with few simple-to-measure variables needed to make it very informative. Although risk factors for cardiovascular mortality have been widely described among patients with T2DM, only three studies have attempted to develop a prediction model of all-cause mortality to be used in the clinical set. Wells et al. (5) created a tool for predicting 6-year all-cause mortality risk in a large retrospective analysis of patients with T2DM from the Cleveland Clinic electronic health record. The authors developed a nomogram risk score using up to 20 predictive variables, which attained an acceptable C statistic of 0.752. However, only patients that were initially treated with a single oral hypoglycemic agent were included, thus making questionable the generalizability of the proposed score. In addition, as the authors also recognize, there was a significant
Figure 1dKaplan-Meier survival curves for 2-year mortality in the pooled sample according to the three risk score categories (low, medium, and high risk) obtained using a RECPAM analysis. 4
DIABETES CARE
amount of missing data, from 42.3 to 52.5%, for some predictor variables (i.e., BMI and LDL, triglyceride, and HDL levels), which were then statistically imputed. Although several and efficient statistical methods have been developed for missing data imputation, predictors with a high rate of missing variables should be omitted in order to keep the variability low about the estimates of interest (23). Moreover, the imputation techniques all rely on the missing at random assumption, a condition that cannot be easily verified (23). Finally, and most importantly, a second independent sample to be used as a validation set was not available (5). Yang et al. (4) have instead used the Hong Kong diabetes registry, a prospective cohort of patients with T2DM, to develop a risk score based on nine predictors for all-cause mortality, which attained a C statistic = 0.845. Although they randomly divided the original sample into training (n = 3,775) and validation (n = 3,808) samples, a second external and independent sample for testing the validity of the proposed score was missing (4). Finally, very recently, the Translating Research Into Action for Diabetes (TRIAD) study (n = 8,334) developed prediction equations for all-cause, cardiovascular, and noncardiovascular mortality in patients with T2DM. Missing values (,15%) have been imputed in this study too. The most parsimonious model was a logistic model built on 5,982 patients by using up to 15 predictive variables, which attained a C statistic = 0.815, although a Cox model would have been more appropriate in a survival context. In addition, and most importantly in this case, a second validation cohort was missing (6). When comparing variables chosen in our models versus other models, we found that age, BMI, antihypertensive therapy, insulin therapy, and LDL cholesterol also significantly predicted allcause mortality in the TRIAD study (6). Age, BMI, increased urinary albumin excretion, and insulin therapy were related to all-cause mortality in the Hong Kong Diabetes Registry study (4). Finally, age, BMI, DBP, insulin therapy, triglyceride levels, and LDL and HDL cholesterol related to all-cause mortality in the Well et al. study (5). Thus, although our well-performing, parsimonious, and validated model has not been compared with previous models, care.diabetesjournals.org
De Cosmo and Associates it represents an alternative for predicting all-cause mortality in a subset of high-risk patients, as those with T2DM certainly have to be considered. Thanks to the risk engine we have created, our model can now be tested in additional samples comprising diabetic patients from different geographical regions and/or different ethnicities in order to obtain deeper insights about its generalizability. An additional important strength of our study is represented by an innovative variable selection strategy, based on the use of reclassification measures (i.e., cNRI in our case) instead of the classical association tests. The reason of such a methodological choice relies on the fact that we were interested in building a predictive model that, by definition, is expected of significantly capturing the contribution of predictors that correctly reclassify subjects according to their future outcome; it is of note that this is exactly what cNRI is able to guarantee. In addition, as recently demonstrated, the cNRI is a direct measure of the predictor’s effect size, allowing a direct interpretation of its estimate. Furthermore, simulation studies (13) have suggested that a cNRI approach reaches a higher level of statistical power, capturing those good predictors with a small effect size and a role that would not be detected by a Wald test or by an improvement in the C statistic. We recognize that a limitation of our study is the lack of information on deathspecific causes, especially those of cardiovascular origin. A second possible weakness is the lack of information on previous cardiovascular events, which represent a major risk factor for all-cause deaths (24). A third limitation of our study may be viewed in the short-term (i.e., 2 years) predictability we have addressed. However, the 4-year horizon tested as exploratory analysis performed well and was also calibrated in both the training and the validation samples, thus minimizing the risk that our model cannot be extended to larger time horizons of prediction. Further limitations are the relatively small sample size we investigated as compared with previous studies (4–6) and that the training and validation sets are both of Italian ancestry, thus not allowing us to address the generalizability of our model. Finally, missing data from both GMS and FMS also have to be recognized as limitations of our present study. We have observed in our set a low percentage of patients treated with lipidlowering drugs, which is particularly relevant care.diabetesjournals.org
in a population with a high percentage of subjects treated with insulin and poor glycemic control. We believe that a subcultured environment is the cause of such an unusual scenario even though it has been changing in the last few years. Although addressing the role of variables as considered one by one was not our aim, some of them, as derived from the pooled analysis, may deserve some comments. Not unexpectedly, although elevated age (6), ACR (25,26), and both antihypertensive (6,27) and insulin therapy (6,28) predicted higher risk, elevated HDL (29), BMI (30), and DBP (31) predicted lower mortality risk. In conclusion, we have developed an all-cause mortality equation in T2DM with good accuracy in calibration and discrimination in the training data set. We have also validated this model in a second external sample of similar patients. Finally, we have provided a user-friendly web-based risk engine (http://www .operapadrepio.it/rcalc/rcalc.php) that may serve the important function of testing our model in different sets of diabetic individuals in order to address its generalizability. Under this circumstance, the implementation of our model may help prioritize the use of available resources for targeting aggressive preventive and treatment strategies in a subset of very high-risk individuals.
AcknowledgmentsdThis work was supported by Italian Ministry of Health grants RF2009 (S.D.C.) and RC2010 (V.T. and F.P.) and the Fondazione Roma “Sostegno alla ricerca scientifica biomedica 2008” (V.T.). No potential conflicts of interest relevant to this article were reported. S.D.C. and V.T. supervised the GMS, designed this particular study, and wrote the manuscript. M.C. and F.P. designed this particular study, analyzed data, contributed to discussion, and reviewed and edited the manuscript. O.L. supervised the FMS, researched data, contributed to discussion, and reviewed and edited the manuscript. A.F. analyzed data, contributed to discussion, and reviewed and edited the manuscript. M.M., A.Pac., S.F., A.Pal., and R.V. researched data and reviewed and edited the manuscript. E.M. and A.R. researched data, organized the database, and reviewed and edited the manuscript. R.D.P. and C.M. researched data, contributed to discussion, and reviewed and edited the manuscript. M.C. supervised the FMS, contributed to discussion, and reviewed and edited the manuscript. S.D.C. is the guarantor of this work and, as such, had full access to all the data in the study and takes responsibility
for the integrity of the data and the accuracy of the data analysis. The authors thank Dr. Francesco Giuliani (IRCCS Casa Sollievo della Sofferenza) for his kind help in developing the risk engine software.
References 1. The Emerging Risk Factors Collaboration, Seshasai SR, Kaptoge S, Thompson A, et al. Diabetes mellitus, fasting glucose, and risk of cause-specific deaths. N Engl J Med 2011;364:829–841 2. Roglic G, Unwin N, Bennett PH, et al. The burden of mortality attributable to diabetes: realistic estimates for the year 2000. Diabetes Care 2005;28:2130–2135 3. International Diabetes Federation (IDF). Diabetes atlas (e-Atlas) [Internet]. Available from http://www.eatlas.idf.org/ index2983.html. Accessed 2 September 2012 4. Yang X, So WY, Tong PC, et al.; Hong Kong Diabetes Registry. Development and validation of an all-cause mortality risk score in type 2 diabetes. Arch Intern Med 2008;168:451–457 5. Wells BJ, Jain A, Arrigain S, Yu C, Rosenkrans WA, Jr, Kattan MW. Predicting 6-year mortality risk in patients with type 2 diabetes. Diabetes Care 2008;31: 2301–2306 6. McEwen LN, Karter AJ, Waitzfelder BE, et al. Predictors of mortality over 8 years in type 2 diabetic patients: Translating Research Into Action for Diabetes (TRIAD). Diabetes Care 2012;35:1301–1309 7. Pencina MJ, D’Agostino RB. Overall C as a measure of discrimination in survival analysis: model specific population value and confidence interval estimation. Stat Med 2004;23:2109–2123 8. D’Agostino RB, Nam BH. Evaluation of the Performance of Survival Analysis Models: Discrimination and Calibration Measures. Handbook of Statistics. Vol 23. Amsterdam, The Netherlands, Elsevier Science B.V., 2004 9. Steyerberg EW, Vickers AJ, Cook NR, et al. Assessing the performance of prediction models: a framework for traditional and novel measures. Epidemiology 2010;21:128–138 10. Steyerberg EW, Pencina MJ. Reclassification calculations for persons with incomplete follow-up. Ann Intern Med 2010;152:195– 196 11. Pencina MJ, D’Agostino RB, Sr, Steyerberg EW. Extensions of net reclassification improvement calculations to measure usefulness of new biomarkers. Stat Med 2011;30:11–21 12. Pencina MJ, D’Agostino RB, Sr, Demler OV. Novel metrics for evaluating improvement in discrimination: net reclassification and integrated discrimination improvement DIABETES CARE
5
Risk engine for predicting all-cause mortality
13.
14.
15. 16. 17.
18.
19.
20.
6
for normal variables and nested models. Stat Med 2012;31:101–113 Levey AS, Greene T, Kusek JW, et al. A simplified equation to predict glomerular filtration rate from serum creatinine (Abstract). J Am Soc Nephrol 2000;11:155A Pencina MJ, D’Agostino RB, Sr, D’Agostino RB, Jr, Vasan RS. Evaluating the added predictive ability of a new marker: from area under the ROC curve to reclassification and beyond. Stat Med 2008;27:157–172; discussion 207–212 Lin DY, Wei LJ. The robust inference for the Cox proportional hazards model. J Am Stat Ass 1989;84:1074–1078 Ciampi A. Generalized regression trees. Comput Stat Data Anal 1991;12:57–78 Addante F, Sancarlo D, Copetti M, et al. Effect of obesity, serum lipoproteins, and apolipoprotein E genotypes on mortality in hospitalized elderly patients. Rejuvenation Res 2011;14:111–118 Mehran R, Pocock SJ, Nikolsky E, et al. A risk score to predict bleeding in patients with acute coronary syndromes. J Am Coll Cardiol 2010;55:2556–2566 Collins GS, Altman DG. Predicting the 10 year risk of cardiovascular disease in the United Kingdom: independent and external validation of an updated version of QRISK2. BMJ 2012;344:e4181 Stevens RJ, Kothari V, Adler AI, Stratton IM; United Kingdom Prospective Diabetes
DIABETES CARE
21.
22.
23.
24.
25.
26.
Study (UKPDS) Group. The UKPDS risk engine: a model for the risk of coronary heart disease in Type II diabetes (UKPDS 56). Clin Sci (Lond) 2001;101:671–679 Skol AD, Scott LJ, Abecasis GR, Boehnke M. Joint analysis is more efficient than replication-based analysis for two-stage genome-wide association studies. Nat Genet 2006;38:209–213 Weedon MN, McCarthy MI, Hitman G, et al. Combining information from common type 2 diabetes risk polymorphisms improves disease prediction. PLoS Med 2006;3:e374 Barzi F, Woodward M. Imputations of missing values in practice: results from imputations of serum cholesterol in 28 cohort studies. Am J Epidemiol 2004;160: 34–45 Miettinen H, Lehto S, Salomaa VV, et al.; The FINMONICA Myocardial Infarction Register Study Group. Impact of diabetes on mortality after the first myocardial infarction. Diabetes Care 1998;21:69– 75 Valmadrid CT, Klein R, Moss SE, Klein BE. The risk of cardiovascular disease mortality associated with microalbuminuria and gross proteinuria in persons with olderonset diabetes mellitus. Arch Intern Med 2000;160:1093–1100 Solomon SD, Lin J, Solomon CG, et al.; Prevention of Events With ACE Inhibition
27.
28.
29.
30.
31.
(PEACE) Investigators. Influence of albuminuria on cardiovascular risk in patients with stable coronary artery disease. Circulation 2007;116:2687–2693 Khaw KT, Barrett-Connor E, Suarez L, Criqui MH. Predictors of stroke-associated mortality in the elderly. Stroke 1984;15: 244–248 Smooke S, Horwich TB, Fonarow GC. Insulin-treated diabetes is associated with a marked increase in mortality in patients with advanced heart failure. Am Heart J 2005;149:168–174 National Cholesterol Education Program (NCEP) Expert Panel on Detection, Evaluation, and Treatment of High Blood Cholesterol in Adults (Adult Treatment Panel III). Third Report of the National Cholesterol Education Program (NCEP) Expert Panel on Detection, Evaluation, and Treatment of High Blood Cholesterol in Adults (Adult Treatment Panel III) final report. Circulation 2002;106:3143–3421 Carnethon MR, De Chavez PJ, Biggs ML, et al. Association of weight status with mortality in adults with incident diabetes. JAMA 2012;308:581–590 Anderson RJ, Bahn GD, Moritz TE, Kaufman D, Abraira C, Duckworth W; VADT Study Group. Blood pressure and cardiovascular disease risk in the Veterans Affairs Diabetes Trial. Diabetes Care 2011; 34:34–38
care.diabetesjournals.org