influential variable for first year growth response was the natural log. (ln) of the ..... the fourth year explained 30% of the variability in the re- sponse, with a sD of ...
0021-972X/99/$03.00/0 The Journal of Clinical Endocrinology & Metabolism Copyright © 1999 by The Endocrine Society
Vol. 84, No. 4 Printed in U.S.A.
Derivation and Validation of a Mathematical Model for Predicting the Response to Exogenous Recombinant Human Growth Hormone (GH) in Prepubertal Children with Idiopathic GH Deficiency MICHAEL B. RANKE, ANDERS LINDBERG, PIERRE CHATELAIN, PATRICK WILTON, WAYNE CUTFIELD, KERSTIN ALBERTSSON-WIKLAND, DAVID A. PRICE ON BEHALF OF THE KIGS INTERNATIONAL BOARD
AND
Sektion Pa¨diatrische Endokrinologie, Universita¨tsklinikum Tu¨bingen, Eberhard Karls Universita¨t (M.B.R.), Tubingen, Germany D-7206; Pharmacia & Upjohn, Inc. (A.L., P.W.), Stockholm S-11287, Sweden; Service de Pe´diatrie, Endocrinologie et Diabe´tologie Infantiles, Universite´ Claude Bernard, Hoˆpital Debrousse (P.C.), Lyon F-69322, France; the Department of Pediatrics, University of Auckland (W.C.), Auckland, New Zealand; the Department of Pediatrics, East Hospital (K.A.-W.), Gothenburg S-41685, Sweden; and the Department of Pediatrics, St. Mary’s Hospital (D.A.P.), Manchester GB-M271HA, United Kingdom ABSTRACT Postmarketing surveillance studies of recombinant human GH therapy, such as the Kabi Pharmacia International Growth Study (KIGS; Pharmacia & Upjohn, Inc., International Growth Database), have accumulated extensive data concerning the characteristics and growth outcomes of children with various causes of short stature. These data provide an opportunity to analyze the factors that determine responsiveness to GH and allow the development of diseasespecific growth prediction models. We undertook a multiple regression analysis of height velocity (centimeter per yr) with various patient parameters of potential relevance using data from a cohort of 593 prepubertal children with idiopathic GH deficiency (GHD) from the KIGS database. Our aim was to produce models that would have practical utility for predicting prepubertal growth during each of the first 4 yr of GH replacement therapy. These models were validated by a prospective comparison of predicted and observed growth outcomes in an additional 3 cohorts of prepubertal children with idiopathic GHD: 237 additional KIGS patients, 29 patients from the Australian OZGROW study, and 33 patients from Tubingen, Germany. The most influential variable for first year growth response was the natural log (ln) of the maximum GH response during provocation testing, which was inversely correlated with height velocity. The first year growth response was also inversely correlated with chronological age and height SD score minus midparental height SD score. First year growth was positively correlated with body weight SD score, weekly GH dose (ln), and birth weight SD score. Two first year models were developed using these parameters, 1 including and 1 excluding the maximum GH response to provocative testing. The former model explained 61%
E
XOGENOUS, pituitary-derived human GH was first used for the treatment of short stature in a child with GH deficiency (GHD) 40 yr ago (1). Subsequently (from the 1980s), the availability of recombinant human GH has contributed to an increasing use of GH therapy in children with GHD or short Received September 10, 1998. Revision received January 4, 1999. Accepted January 19, 1999. Address all correspondence and requests for reprints to: Dr. Michael B. Ranke, Sektion Pa¨diatrische Endokrinologie, Universita¨tsklinikum Tu¨bingen, Eberhard Karls Universita¨t, Hoppe-Seyler Str. 1, 72076 Tubingen, Germany.
of the response variability, with a SD of 1.46 cm; the latter model explained 45% of the variability, with a SD of 1.72 cm. The two models gave similar predictions, although the model excluding the maximum GH response to testing tended to underpredict the growth response in patients with very low GH secretory capacity. For the second, third, and fourth year growth responses, 4 predictors were identified: height velocity during the previous year (positively correlated), body weight SD score (positively correlated), chronological age (negatively correlated), and weekly GH dose (ln; positively correlated). The models for the second, third, and fourth year responses explained 40%, 37%, and 30% of the variability, respectively, with SDs of 1.19, 1.05, and 0.95 cm, respectively. When the models were applied prospectively to the other cohorts, there were no significant differences between observed and predicted responses in any of the cohorts in any year of treatment. The fourth year response model gave accurate prospective growth predictions for the fifth to the eighth prepubertal years of GH treatment in a subset of 48 KIGS patients. Analyses of Studentized residuals provided further validation of the models. The parameters used in our models do not explain all of the variability in growth response, but they have a high degree of precision (low error SDs). Moreover, the parameters used are robust and easily accessible. These properties give the models’ practical utility as growth prediction tools. The availability of longitudinal, disease-specific models will be helpful in the future for enabling growth-promoting therapy to be planned at the outset, optimized for efficacy and economy, and individualized to meet treatment goals based on realistic expectations. (J Clin Endocrinol Metab 84: 1174 –1183, 1999)
stature of other etiologies. However, studies of the final height outcome of patients with GHD given GH replacement therapy despite generally involving small numbers of patients, have indicated that a large proportion of such patients fail to reach a normal adult height (2–5). This finding may suggest that the GH treatment had been suboptimal for these patients. A variety of factors could have contributed to this finding, including the limited availability of GH before the advent of biosynthetic GH production, changes in the accepted criteria for the diagnosis of GHD, and inappropriate treatment modalities, such as inadequate total doses or low frequencies of GH injections.
1174
MATHEMATICAL MODEL FOR PREDICTING THE RESPONSE TO EXOGENOUS GH IN GHD
By accessing the large databases accumulated in the postmarketing outcome surveys (pharmaco-epidemiological surveys) of recombinant human GH, it is now possible to analyze the factors that determine responsiveness to exogenous GH. This information can be used to develop disease-specific growth prediction models for GH interventions in different etiologies of short stature. These models can be used to assist the clinician in the individualization of a patient’s treatment from the start to the end of GH therapy. We sought to develop growth prediction models for use in prepubertal children with idiopathic GHD by analyzing data from the multicenter Kabi Pharmacia International Growth Study (KIGS) study (the Pharmacia & Upjohn, Inc. International Growth Database) (6). Importantly, we then sought to test the accuracy and practicality of the growth prediction models by prospective means, using cohorts of recently diagnosed prepubertal children with idiopathic GHD. Subjects and Methods Growth responses during the initial 4 yr of GH therapy were determined for patients with idiopathic GHD enrolled in KIGS. These values were correlated, by multiple regression analysis, with potentially relevant variables concerning the patients’ birth status, genetic background, treatment modality, and physical characteristics. Predictive growth models based on these variables were derived from the analysis for each of the 4 initial yr of GH therapy. Prospective comparisons were then made between the predicted and observed growth responses in several other cohorts of recently diagnosed prepubertal children with idiopathic GHD in an attempt to validate the models.
1175
mean 6 sd. sd scores were calculated as follows: sd score 5 (patient value 2 the mean value for age- and sex-matched normal subjects) 4 sd of the value for age- and sex-matched normal subjects. The variables tested were 1) status at birth: sex, weight sd score, length sd score, ponderal index, mode of delivery, and Apgar score; 2) genetic background: height sd score of the mother, height sd score of the father, midparental height (MPH) sd score, and ethnic origin (the ethnic background of the patients was analyzed by adding dummy variables, e.g. 0/1 Asian/not Asian, to allow mathematical analysis within the multiple regression computer program); 3) treatment modality: GH dose [international units per kg BW and international units per kg ideal body weight (weight for height)], frequency of GH injections, and accumulated years of GH treatment; 4) patient variables at the beginning of the treatment period: age, bone age, height sd score, weight sd score, height sd score minus MPH sd score, peak GH level during provocative testing, and pituitary hormone deficiency status (i.e. isolated GHD or multiple pituitary hormone deficiencies). The height standards used for normal children were those of Tanner et al. (8), and the weight standards were those of Freeman et al. (9). Birth weight for gestational age was transformed to sd score values based on the standards of Niklasson et al. (10). The MPH sd score was calculated as the (father’s height sd score 1 mother’s height sd score): 1.61 (11), based on the standards of Tanner et al. (8). Bone ages, calculated according to the method of Greulich and Pyle (12), were taken as reported by the treating physician. The prediction models were developed by means of multiple linear regression analysis fitted by least squares and the REG procedure in the SAS computer program (Mainframe version 6.12). A hierarchy of predictive factors was derived by the all possible regression approach, using Mallow’s C(p) criterion for ordering predictive factors, as described by Weisberg (13, 14). Differences between observed and predicted height velocities were expressed in terms of Studentized residuals. The residual is calculated as the observed height velocity minus the predicted height velocity for each observation, and the Studentized residual is the residual divided by its se.
Patients Data obtained from prepubertal patients with idiopathic GHD enrolled in KIGS by August 31, 1997, were analyzed for construction of the prediction models. These patients were treated exclusively with recombinant human GH (Genotropin, Pharmacia & Upjohn, Stockholm, Sweden), receiving 6 or 7 injections of GH/week. At this time the KIGS database included 593 children suitable for analysis. The diagnosis was made by the treating physician according to the KIGS etiology classification system Code 1 (7). Only patients with peak GH levels of 10 mg/L or less after 2 standard GH provocation tests (excluding testing with GHRH), as reported by the treating physician, were included in the analysis. The patients were prepubertal; the boys had a mean testes volume 3 mL or less, whereas the girls had a Tanner breast stage of B1. The age at onset of GH treatment was between 2–10 yr for the girls and between 2–12 yr for the boys. Height measurements, for the calculation of a full year’s height velocity, were made at intervals of 11–13 months during the first year of treatment and 9 –15 months in subsequent years. Patients were excluded from the analysis if they missed their GH injections for a total of more than 14 days during 1 yr. All patients analyzed were an appropriate size for gestational age at birth. Patients born small for gestational age were excluded. KIGS is an on-going study, and new patients are continually being recruited. Because many of the selected patients were recruited into KIGS in the years immediately preceding the analysis, progressively fewer data were available for analyses of subsequent yearly growth responses after the first year growth response. Data from all 593 patients (148 girls and 455 boys) were used for the analysis of the first year growth response. Of these patients, data were available from 573 (144 girls and 429 boys) for the analysis of the second year growth response, 335 (83 girls and 252 boys) for the third year growth response, and 180 (40 girls and 140 boys) for the fourth year response.
Statistical analysis Growth responses (height velocities, centimeters per yr) were correlated with several patient variables by multiple regression analysis. These variables are reported as the median and range as well as the
Model validation For the validation of the prediction models, data from three cohorts of patients were used. 1) A cohort of 237 prepubertal patients with idiopathic GHD from the KIGS database, who were treated with Genotropin, but who had not been included in the development of the prediction models, were studied. These patients were either registered in KIGS too recently for inclusion in analysis (n 5 97) or else they had been excluded from the analysis because their first year growth response was assessed between 10 –14 months of treatment, but not within the inclusion criterion of 11–13 months (n 5 140). Data from all of these patients were available for analysis of first year growth responses, whereas the patient numbers available for analysis of prepubertal second, third, and fourth year growth responses were 188, 127, and 67, respectively. In 48 patients, information on growth and treatment for the fifth to eighth prepubertal years were also available. In these cases, observed vs. predicted growth was compared using the prediction models developed for the fourth treatment year. 2) A cohort of 29 prepubertal patients (9 girls and 20 boys) with idiopathic GHD from the Australian database, OZGROW (15), were studied. All data required for growth prediction within the models from this cohort were provided by Dr. Christopher Cowell (Sydney, Australia). Growth data from all of these patients were available for the first prepubertal treatment year. The number of patients available for analysis of growth during the second, third, and fourth prepubertal years of GH therapy were 24, 22, and 7, respectively. These patients were treated with various commercially available recombinant human GH products. 3) A cohort of 33 prepubertal children (16 girls and 17 boys) with idiopathic GHD diagnosed at the University Children’s Hospital (Tubingen, Germany) were studied. The diagnosis was made on the basis of 2 standard provocation tests for GH secretory capacity. All parameters required for the prediction models were available for these patients. The patients were treated with a variety of commercially available recombinant human GH products. Prepubertal growth data were available for 33, 27, 26, and 16 patients for the first, second, third and fourth years of GH replacement therapy, respectively.
1176
JCE & M • 1999 Vol 84 • No 4
RANKE ET AL.
Results Demographic characteristics of the cohort used for construction of the growth prediction models
The characteristics, at the onset of GH treatment, of the patients who were treated longitudinally for 2 yr are listed in Table 1a. Equivalent characteristics of the patients who were treated longitudinally for 3 and 4 yr are listed in Tables 1b and 1c, respectively. In the group treated longitudinally for 4 yr, the mean age of the patients was slightly younger, and the severity of GHD was slightly greater compared with those in the group treated for 2 yr. The weekly dose of GH per kg BW did not differ significantly over the years of observation (P . 0.1). The demo-
graphic characteristics of the groups reflect the typically wide spectrum of prepubertal patients with idiopathic GHD starting GH therapy. Growth predictors and growth prediction models
The variables found to be predictive of height velocity in the first 4 yr of prepubertal treatment, their rank order as predictors, the overall correlation coefficients of the prediction models, and the error sd of their predictions are listed in Table 2. All single predictors were found to be significant at a level of P , 0.001. Two growth prediction models were established for growth during the first year of treatment: one including and
TABLE 1a. Demographic characteristics, at start of GH therapy, in prepubertal children with idiopathic GHD from the KIGS cohort used for analysis of predictors for first and second year growth response Parameter
Median
Age (yr) Bone age (yr)a Ht (SD score) Wt (SD score) MPH (SD score) Ht 2 MPH (SD score) Birth wt (SD score) Maximum GH peak (mg/L) GH dose (IU/kgzweek) Ht, velocity, first yr (cm/yr) Ht, velocity, second yr (cm/yr)
7.2 5.0 22.4 22.2 20.6 21.7 20.6 6.0 0.6 8.9 8.9
Range
2.1 0.8 25.4 23.8 23.4 26.2 22.0 0.3 0.2 3.5 3.5
to to to to to to to to to to to
11.9 12.6 20.4 20.7 2.3 1.7 3.6 10.0 1.3 16.8 16.8
Mean
SD
7.3 5.2 22.6 22.2 20.6 21.9 20.5 5.6 0.6 9.2 9.2
2.4 2.3 0.8 1.3 1.0 1.4 0.9 2.8 0.2 2.3 2.3
n 5 593. a n 5 330. TABLE 1b. Demographic characteristics, at start of GH therapy, in prepubertal children with idiopathic GHD from the KIGS cohort used for analysis of predictors for third year growth response Parameter
Median
Age (yr) Bone age (yr)a Ht (SD score) Wt (SD score) MPH (SD score) Ht 2 MPH (SD score) Birth wt (SD score) Maximum GH peak (mg/L) GH dose (IU/kgzweek) Ht, velocity, second yr (cm/yr) Ht, velocity, third yr (cm/yr)
6.2 3.8 22.6 22.4 20.5 22.2 20.6 5.3 0.6 7.2 6.4
Range
2.1 0.8 25.3 27.1 24.1 25.8 22.0 0.3 0.1 3.5 2.4
to to to to to to to to to to to
11.6 10.5 20.6 1.3 2.7 0.5 3.0 10.0 1.4 12.2 10.6
Mean
SD
6.2 4.1 22.7 22.4 20.4 22.3 20.4 5.2 0.6 7.3 6.5
2.0 1.8 0.8 1.2 1.2 1.1 1.0 2.8 0.2 1.5 1.3
n 5 335. a n 5 181. TABLE 1c. Demographic characteristics, at start of GH therapy, in prepubertal children with idiopathic GHD from the KIGS cohort used for analysis of predictors for fourth year growth response Parameter
Median
Age (yr) Bone age (yr)a Ht (SD score) Wt (SD score) MPH (SD score) Ht 2 MPH (SD score) Birth wt (SD score) Maximum GH peak (mg/L) GH dose (IU/kgzweek) Ht, velocity, third yr (cm/yr) Ht, velocity, fourth yr (cm/yr)
5.8 3.5 22.7 22.6 20.4 22.5 20.5 4.2 0.6 6.7 6.1
n 5 180. a n 5 94.
Range
2.1 0.8 25.3 27.1 24.1 25.8 22.0 0.5 0.1 2.4 2.9
to to to to to to to to to to to
9.7 8.9 21.2 0.8 2.7 0.3 3.0 10.0 1.4 10.6 9.8
Mean
SD
5.7 3.6 22.8 22.5 20.3 22.5 20.3 4.7 0.6 6.7 6.2
1.8 1.6 0.7 1.3 1.2 1.1 1.0 2.8 0.2 1.3 1.1
MATHEMATICAL MODEL FOR PREDICTING THE RESPONSE TO EXOGENOUS GH IN GHD
1177
TABLE 2. Regression equations for prediction of height velocity, including [and excluding (a)] parameter of peak GH response to provocation testing
Intercept (constant) Maximum GH response (ln mg/L) Age at onset (yr) Birth wt (SD score) GH dose (ln IU/kgzwk) Ht 2 MPH (SD score) Body wt (SD score) Ht velocity, previous year (cm/year) r2 Error SD (cm)
First year (n 5 593)
First yr (n 5 593)a
Second yr (n 5 573)
Third yr (n 5 335)
Fourth yr (n 5 180)
Parameter estimate
Parameter estimate
Parameter estimate
Parameter estimate
Parameter estimate
14.55 21.37 20.32 0.32 1.62 20.40 0.29 0.61 1.46
Rank
Rank
12.41 1 2 6 5 3 4
20.36 0.47 1.54 20.60 0.28 0.45 1.72
Rank
5.69 2 3 4 1 5
Rank
5.61
Rank
6.03
20.09
3
20.10
3
20.05
4
0.63
4
0.66
4
0.87
3
0.24 0.31
2 1
0.30 0.32
2 1
0.40 0.21
1 2
0.40 1.19
0.37 1.05
0.30 0.95
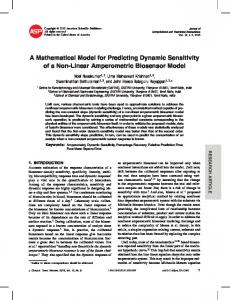
FIG. 1. Differences in predicted height gain after the first year of GH replacement therapy in 593 prepubertal children with idiopathic GHD, according to 2 growth prediction models: (model excluding maximum GH response to testing) minus (model including maximum GH response to testing).
one excluding the maximum peak GH response recorded during two standard provocation tests. The reasons for developing a model that excluded this parameter pertain to the inconsistencies that can exist between investigational centers in the methods used for provocation testing and assaying GH (16). It was anticipated that a model excluding this parameter might give better growth predictions for individual patients when there was any uncertainty about their maximum GH secretory capacity. The equation describing the predicted height velocity (PHV) for the first year of GH therapy, when the parameter of maximum GH response to provocation testing is included, is as follows: PHV (cm/yr) 5 14.55 1 [21.37 3 maximum GH response [ln; mL)] 1 (20.32 3 age at onset (yr)]) 1 (0.32 3 birth weight sd score) 1 [1.62 3 GH dose (ln; IU/kgzweek)] 1 (20.4 3 height sd score 2 MPH sd score) 1 (0.29 3 body weight sd score) [6 1.46] (Refer to Table 2). This model explained 61% of the variability of the response, with an error sd of 1.46 cm. The parameter of the natural log (ln) of the maximum GH response to provocation
testing was the most important predictor of the six identified. Thus, the greater the severity of the child’s GHD, the greater their first year growth response to GH therapy. In addition, the growth response was negatively correlated with chronological age and the distance between the child’s present height sd score and his MPH sd score. Therefore, the younger and smaller the child, the greater his first year growth response to GH therapy. First year growth response was positively correlated with body weight sd score, weekly GH dose (ln), and birth weight sd score. These findings imply that the heavier the child is at present, the heavier the child was at birth, and the more GH the child receives during the first year, the greater his growth response will be. The model excluding the maximum GH response to provocative testing explained 45% of the variability of the response, with a sd of 1.72 cm (Table 2). In this model the difference between present height sd score and MPH sd score was the most important single predictor. Otherwise, the predictors in the two models for first year growth response were identical. Figure 1 shows for each patient the difference in
1178
RANKE ET AL.
predicted first year growth response between these two models. Overall, the two models gave similar results, but the model excluding peak GH response during provocation testing tended to underpredict the growth response in those patients who had a very low GH secretory capacity. Four variables were found to be important for predicting second, third, and fourth year growth responses: height velocity during the previous year, body weight sd score, chronological age, and weekly GH dose (ln). The models for the second and third years explained 40% and 37% of the variability in response, respectively, with sds of 1.19 and 1.05 cm, respectively (Table 2). For the second and third years, height velocity during the previous year was the most important predictor of response, followed by body weight sd score, chronological age, and weekly GH dose (ln). The model for the fourth year explained 30% of the variability in the response, with a sd of 0.95 cm (Table 2). Body weight sd score rather than height velocity in the previous year was the most important predictor for fourth year growth. Validation of prediction models The plots of the Studentized residuals (see Materials and Methods) vs. predicted response in the original KIGS cohort using the two models for the first year growth response are illustrated in Fig. 2, a and b. Studentized residual plots are used to diagnose outliers, nonlinearity, and nonconstant error variance in prediction models and are a part of their mathematical validation. The fact that the observations are randomly clustered implies that there is no heterogeneity in the group with respect to the relative importance of the different predictors. Figure 3 shows the Studentized residuals (mean, sd) for the predicted response during each year calculated for each of the cohorts studied prospectively for validation. The growth response in the validation groups was not significantly different from that predicted in any of the treatment years, although there was a tendency for greater than predicted growth in most years in the validation cohorts (Fig. 3). The characteristics of the KIGS cohort used to validate the models were similar to those of the cohorts from which the models were derived (P . 0.1, all variables; Table 3a). There were no statistically significant differences between the predicted and the observed growth responses in any of the 4 treatment yr (Table 3a and Fig. 3). Some characteristics of the OZGROW cohort differed from those of the KIGS cohort from which the models were derived (Table 3b). Although there were no overall differences in MPH, birth weight, and dose of GH between the OZGROW and KIGS cohorts, the Australian patients were younger, smaller, lighter, and had a lower maximum GH response to provocation testing (P , 0.05) compared to the original KIGS cohort. Despite these differences, there were no statistically significant differences between the predicted and the observed growth responses for each of the 4 yr (P . 0.1; Table 3b and Fig. 3). Characteristics of the Tubingen cohort also differed from the original KIGS cohort (Table 3c). The Tubingen patients were the youngest of all the groups used for validation, although their age was not significantly different from that of the OZGROW cohort. Once again, there were no significant differences in the Tubingen cohort between the predicted and observed growth responses in all 4 treatment yr (P . 0.1; Table 3c and Fig. 3). The weekly dose of GH did not differ significantly over the years of observation in any of the cohorts used for validation (P . 0.1).
Discussion
The general aims of the use of exogenous GH to treat growth failure in children have been well defined (17). Firstly, the child should grow as normally as possible. This means that they should undergo an initial period of catch-up growth to reduce their height deficit. They should then continue to grow within the normal range during childhood,
JCE & M • 1999 Vol 84 • No 4
their tempo of development should be normal, and, ultimately, they should reach an adult height within the normal range. Secondly, any possible risk posed by GH therapy should be minimized, and thirdly, to limit costs, normalization of height in childhood and attainment of a normal adult height should be achieved using the lowest possible cumulative dose of GH. In contrast, it is difficult to define, in numerical terms, what the appropriate level of growth should be to reach the goals set. This problem applies when considering groups of patients as well as individual patients. The response to GH treatment is a function of treatment modalities, such as the dose of GH, the frequency of injections, and the substitution of other hormonal deficiencies as well as the responsiveness of the individual. The latter may be determined by parameters such as the severity of the hormonal deficit(s), the patient’s age, pubertal status, and other biological and genetic characteristics. Other studies examining the growth response during the first year of GH replacement therapy in patients with GHD have shown positive correlations between height velocity and GH dose (18 –23), frequency of GH injections (23, 24), and skinfold thickness (18, 22, 25) and negative correlations between height velocity and age (20, 25), bone age (19, 25), height (22, 25), weight for height index (22, 25), and height velocity before treatment (22). The adult height of patients with GHD who were treated with GH has been shown to correlate positively with height sd score at the start of treatment (3), height at onset of puberty (2, 3), MPH sd score, and height velocity during the first year of treatment (26). Final height has been shown to negatively correlate with the age at the start of GH therapy (27). The predictive utility of these findings is limited because most of these results were obtained from relatively small heterogeneous groups of patients using simple analytical techniques. In recent years, however, the factors determining the growth response to exogenous GH in patients with GHD have been analyzed in better defined, larger cohorts followed within multicenter studies using multiple regression analysis (17, 26, 28 –30). For example, Blethen and colleagues (28) studied a cohort of 523 patients with idiopathic GHD from the National Cooperative Growth Study, and showed that the first year height velocity sd score in prepubertal children given GH replacement therapy was a function of age, body weight sd score, maximum GH response to provocative testing (ln), MPH, injection frequency, and GH dose (ln). Overall, 40% of the variability of the response was explained by a descriptive model based on these variables, but the error sd was not given. A previous study from KIGS analyzed a cohort of 472 patients with idiopathic GHD (17). In this study, the first year height velocity in prepubertal children was a function of age, height sd score minus MPH sd score, GH injection frequency, birth weight sd score, dose of GH, and weight for height index. These parameters explained 56% of the variability of the response, with an error sd of 1.79 cm. The present analysis of KIGS data differed from this earlier analysis in that stricter inclusion criteria were employed. The present analysis was restricted to patients receiving six or seven injections per week, and data were only admitted if a year’s height velocity
MATHEMATICAL MODEL FOR PREDICTING THE RESPONSE TO EXOGENOUS GH IN GHD
1179
FIG. 2. Studentized residuals vs. predicted height velocity for the first GH treatment year in 593 prepubertal children with idiopathic GHD, according to 2 growth prediction models: a model including maximum GH response to provocative testing (a) and a model excluding maximum GH response to provocative testing (b).
had been assessed between 11–13 months (the previous KIGS analysis allowed assessments to be made between 9 –15 months). These differences account for the rather modest increase in the number of patients assessed and differences in the explained variability and precision between the previous and present models.
Nevertheless, the present first year model that excludes the maximum GH response to provocation testing confirmed the parameters of importance identified in the previous KIGS study. The present model explained 45% of the variability of the response with an error sd of 1.72 cm. Height sd score minus MPH sd score (i.e. the difference between present
1180
JCE & M • 1999 Vol 84 • No 4
RANKE ET AL.
height and target height) was the most important of the predictors in the present model, and body weight sd score was a better predictor than weight for height index. The present model also found the GH dose (ln) to be a better predictor than the numerical GH dose. The frequency of GH injections was no longer a variable in the present model
FIG. 3. Studentized residuals (mean 6 SD) for predicted height velocity in four cohorts of prepubertal children with idiopathic GHD by year of GH treatment.
because only patients receiving 6 or 7 injections per week were included in the analysis; this regimen has now become common practice. Indeed, it is possible that the observation in this study of nonsignificant, slightly greater growth responses in the validation groups compared with those in the original KIGS cohort may reflect a greater percentage of patients in the validation groups receiving 7 injections of GH per week. About 50% of the original cohort of 593 KIGS patients were receiving GH in 6 injections/week. When the maximum GH level (ln) during provocation testing was included in the present analysis, this parameter proved to be the most important of all the predictors. The differences in the predicted first year height velocity between the two present models only became relevant in cases where the maximum GH level during provocative testing was below 5 mg/L, that is in patients with severe GHD. In these individuals, the model excluding the parameter of maximum GH response to provocative testing tended to underpredict the growth response to GH replacement therapy. This finding indicates that the severity of a patient’s GHD is of major significance in determining his responsiveness to GH therapy regardless of his height deviation. It is noteworthy that there was considerable heterogeneity between the centers participating in KIGS with regard to the methods used for provocation testing and assaying GH. It is therefore remarkable that the model that included the max-
TABLE 3a. Demographic characteristics, at start of GH therapy, in prepubertal children with idiopathic GHD from the KIGS cohort used for validation of the prediction models Parameter
Age (yr) Ht (SD score) Wt (SD score) MPH (SD score) Ht 2 MPH (SD score) Birth wt (SD score) Maximum GH peak (mg/L) GH dose (IU/kgzweek) GH yr First Observed ht velocity (cm/yr) Predicted ht velocity (cm/yr) Studentized residual (SD) Firsta Predicted ht velocity (cm/yr) Studentized residual (SD)a Second Observed ht velocity (cm/yr) Predicted ht velocity (cm/yr) Studentized residual (SD) Third Observed ht velocity (cm/yr) Predicted ht velocity (cm/yr) Studentized residual (SD) Fourth Observed ht velocity (cm/yr) Predicted ht velocity (cm/yr) Studentized residual (SD) Fifth– eighth Observed ht (cm/yr) Predicted ht velocity (cm/yr) Studentized residual (SD)
Median
Mean
SD
12.0 20.7 21.1 2.2 1.3 2.9 10.0 1.4
7.3 22.5 22.3 20.6 21.9 20.7 5.7 0.6
2.6 0.8 1.2 0.9 1.3 0.9 2.6 0.2
8.9 8.9 0.0
4.1 to 16.9 5.2 to 16.9 23.1 to 3.7
9.2 9.1 0.1
2.4 1.8 1.3
9.3 20.1
5.5 to 12.6 22.9 to 3.2
9.2 0.0
1.5 1.2
7.1 7.1 0.0
2.9 to 14.2 4.9 to 10.1 22.9 to 3.5
7.4 7.3 0.1
1.8 1.0 1.1
6.5 6.5 0.3
1.1 to 10.4 4.0 to 9.8 23.9 to 3.9
6.7 6.5 0.1
1.5 0.9 1.3
5.9 6.2 0.0
3.4 to 9.2 4.5 to 8.3 22.7 to 3.3
6.1 6.2 20.1
1.3 0.8 1.2
6.0 6.0 20.1
2.8 to 9.3 4.3 to 7.4 24.1 to 3.0
5.8 6.0 20.1
1.3 0.7 1.2
7.0 22.4 22.1 20.6 21.8 20.7 5.9 0.6
Range
2.1 25.6 26.8 22.9 25.2 22.0 0.1 0.3
to to to to to to to to
Observed and predicted height velocities are given for the first (n 5 237), second (n 5 188), third (n 5 127), fourth (n 5 67), and fifth to eighth (n 5 48) prepubertal yrs on GH. a First year growth prediction excluding parameter of maximum GH peak during provocative testing.
MATHEMATICAL MODEL FOR PREDICTING THE RESPONSE TO EXOGENOUS GH IN GHD
1181
TABLE 3b. Demographic characteristics, at start of GH therapy, in prepubertal children with idiopathic GHD from the OZGROW cohort used for validation of the prediction models Parameter
Age (yr) Ht (SD score) Wt (SD score) MPH (SD score) Ht 2 MPH (SD score) Birth wt (SD score) Maximum GH peak (mg/L) GH dose (IU/kgzweek) GH yr First Observed ht velocity (cm/yr) Predicted ht velocity (cm/yr) Studentized residual (SD) Firsta Predicted ht velocity (cm/yr) Studentized residual (SD)a Second Observed ht velocity (cm/yr) Predicted ht velocity (cm/yr) Studentized residual (SD) Third Observed ht velocity (cm/yr) Predicted ht velocity (cm/yr) Studentized residual (SD) Fourth Observed ht velocity (cm/yr) Predicted ht velocity (cm/yr) Studentized residual (SD)
Median
Mean
SD
5.7 23.3 22.6 20.6 22.8 20.8 3.9 0.6
2.3 26.1 26.3 22.9 24.6 21.9 0.8 0.5
Range
11.8 21.7 20.4 1.6 20.1 3.7 9.0 0.8
6.4 23.3 22.9 20.8 22.5 20.2 4.2 0.6
2.5 1.0 1.5 0.8 1.2 1.3 2.6 0.1
10.5 9.9 0.5
6.0 to 16.1 5.7 to 13.7 21.7 to 4.8
11.1 10.1 0.7
2.7 1.8 1.5
10.2 0.6
5.8 to 12.7 21.4 to 4.4
9.9 0.7
1.6 1.5
7.8 7.5 0.0
4.6 to 11.7 6.0 to 10.0 21.6 to 2.7
8.0 7.7 0.3
1.9 1.0 1.1
7.0 6.9 0.3
4.0 to 9.2 5.1 to 8.7 22.7 to 2.2
7.0 6.9 0.1
1.3 0.7 1.3
6.8 5.9 0.6
5.2 to 7.3 5.3 to 7.0 20.2 to 1.5
6.6 6.1 0.5
0.7 0.6 0.7
to to to to to to to to
Observed and predicted height velocities are given for the first (n 5 29), second (n 5 24), third (n 5 22), and fourth (n 5 7) prepubertal years on GH. a First year growth prediction excluding parameter of maximum GH peak during provocative testing.
imum GH response to testing predicted a growth response with a higher precision than the model excluding this parameter. It is important to note, however, that although GH response to testing is the most important predictor of the first year growth response, it is also the most difficult parameter to measure accurately and consistently. The effects of intercenter or interindividual differences in this value are likely to be attenuated when considering the mean growth responses in large cohorts. However, when individual patients are considered, inconsistencies in this variable could introduce a source of error into the prediction. It is therefore important that standardization is achieved in the measurement of this variable if it is to be used in the prediction of an individual’s growth. For this reason, we recommend that the highest peak GH level recorded from two separate provocation tests is used. That height deficit, age, severity of GHD, and GH dose were found to be important predictors of the first year growth response to GH therapy is compatible with our current understanding. However, there is no simple explanation for why the parameters of weight at birth and current weight are independent predictors in these models. It is possible that birth weight reflects the overall responsiveness of the organism to growth-promoting factors, whereas body weight sd score may reflect the eating habits and metabolic handling of nutrition by the organism. Height velocities during the second, third, and fourth prepubertal years of GH therapy were predicted by the same four variables. These were age, body weight sd score, GH
dose (ln), and height velocity during the previous year. Height velocity during the previous year was the most important predictor for second and third year growth responses, suggesting that the eventual height outcome for a patient may be indicated by his initial response to GH. The overall variabilities of response in the second to fourth year models were lower than those for the first year model, and the error sds were smaller. These findings indicate that the second to fourth year models give more precise predictions, perhaps reflecting a more steady growth pattern after an initial phase of catch-up growth. Not only were our prediction models selected for their ability to give a high degree of predictive power (high R), they were also required to have the ability to predict growth with high accuracy (low error sd). A low error sd is an important prerequisite if the model is to have practical utility as a predictive tool for individual patients. Our models do provide high accuracy, although their predictive power is relatively low, with the exception of those concerning first year growth response. This means that further parameters, explaining more of the variability of the response, may be missing from the models. Such parameters need to be identified in the future, but if they are to have practical utility, it is mandatory that their measurements should be standardized. An advantage of our present models is that they are based on robust and easily accessible parameters (31, 32). A recent study by Kristro¨m et al. (33), in short prepubertal children with various capacities for GH secretion illustrated how greater predictive power can be achieved when further
1182
JCE & M • 1999 Vol 84 • No 4
RANKE ET AL.
TABLE 3c. Demographic characteristics, at start of GH therapy, in prepubertal children with idiopathic GHD from the Tu¨bingen cohort used for validation of the prediction models Parameter
Age (yr) Ht (SD score) Wt (SD score) MPH (SD score) Ht 2 MPH (SD score) Birth wt (SD score) Maximum GH peak (mg/L) GH dose (IU/kgzweek) GH yr First Observed ht velocity (cm/yr) Predicted ht velocity (cm/yr) Studentized residual (SD) Firsta Predicted ht velocity (cm/yr) Studentized residual (SD)a Second Observed ht velocity (cm/yr) Predicted ht velocity (cm/yr) Studentized residual (SD) Third Observed ht velocity (cm/yr) Predicted ht velocity (cm/yr) Studentized residual (SD) Fourth Observed ht velocity (cm/yr) Predicted ht velocity (cm/yr) Studentized residual (SD)
Median
Mean
SD
4.7 22.4 22.1 20.2 22.6 20.4 3.9 0.6
2.3 26.1 26.8 21.9 28.6 22.0 0.6 0.4
Range
9.1 21.0 21.1 2.5 20.4 1.6 9.8 1.3
4.9 22.8 22.3 20.1 22.7 20.6 4.9 0.6
1.9 1.1 1.2 1.1 1.5 0.8 2.9 0.2
9.5 10.0 20.3
6.1 to 14.4 7.1 to 13.7 22.4 to 1.6
9.7 10.2 20.4
1.9 1.4 0.9
10.2 20.5
7.5 to 13.6 21.8 to 1.5
10.3 20.3
1.2 0.9
8.4 7.5 1.0
5.1 to 12.2 5.7 to 8.4 21.2 to 3.7
8.2 7.4 0.7
1.6 0.7 1.1
6.8 6.7 0.2
3.4 to 9.8 5.2 to 8.2 22.6 to 2.2
6.8 6.7 0.1
1.5 0.8 1.2
6.4 6.2 0.2
4.2 to 8.8 5.1 to 7.1 21.5 to 3.6
6.6 6.2 0.4
1.0 0.5 1.1
to to to to to to to to
Observed and predicted height velocities are given for the first (n 5 33), second (n 5 27), third (n 5 26), and fourth (n 5 16) prepubertal years on GH. a First year growth prediction excluding parameter of maximum GH peak during provocative testing.
variables concerning the responsiveness of the GH axis are included in the regression analysis. It was possible to explain 58% of the variability of first year growth response to GH therapy by including parameters such as baseline serum levels of insulin-like growth factor I (IGF-I) and IGF-binding protein-3, as well as changes in IGF-I levels in response to GH. However, omitting measures of GH-IGF axis responsiveness, and hence restricting the model to more easily accessible parameters, resulted in the regression algorithms predicting only 40 – 43% of the variance. Previously, prediction models have not been validated on the basis of independent data sources. The attempt to validate the prediction models developed in this study was made with two relatively small cohorts of patients (from OZGROW and one center in Tubingen) and a larger cohort from KIGS. These populations reflect the wide variety of patients with idiopathic GHD at the onset of GH therapy, and, in the case of the OZGROW and Tubingen cohorts, the different brands of recombinant human GH that can be used as treatment. Nevertheless, there was no statistically significant difference between the observed and predicted height velocities in the different groups and years. This observation confirms the predictive usefulness of the algorithms, and suggests equivalent efficacy for the different recombinant human GH products used in the validation cohorts. The range of Studentized residuals, however, did tend to be slightly greater in the groups used for validation. Remarkably, the prediction model for the fourth prepubertal year was also found to be useful for predicting growth in the fifth to eighth prepubertal
years in the KIGS cohort. This finding appears to support the clinical observation of steady growth after an initial phase of catch-up growth. It is intended that these prediction models will become widely available to endocrinologists through the development of user-friendly computer programs. Other models dealing with pubertal growth and the growth responses in patients with other causes of short stature are also in development. The introduction of these may aid clinicians in several ways. For example, prediction models could be used to calculate expected height velocities (mean, range) at the onset of GH treatment on the basis of the characteristics of the patients and putative treatment modalities. Differences (particularly negative) between the observed and predicted height velocities will be apparent if precise predictions have been made. Potential explanations for height velocities below predicted values include poor compliance, the presence of other hormonal deficiencies, misdiagnosis, primarily impaired responsiveness such as GH insensitivity, poor nutrition, and other concurrent diseases. These possibilities can be investigated and managed appropriately. Prediction models for prepubertal and pubertal growth (34) could also aid in the design of individual treatment regimens from the time of diagnosis, helping to plan a child’s treatment in advance from the start of their therapy until the end of growth. The amount of GH given per yr can be varied hypothetically within the models to estimate the effects at different phases of growth. This information can be used together with defined treatment goals (e.g. achievement of early catch-up
MATHEMATICAL MODEL FOR PREDICTING THE RESPONSE TO EXOGENOUS GH IN GHD
growth and final height within the normal range or within the familial target range) for planning treatment. By including the empirical information stepwise during the process of growth, prediction models can be used to aid the optimization of treatment in pursuit of these goals. Prediction models may also help to provide patients, their families, treating physicians, and health providers with realistic expectations of the short term (yearly) and long term growth outcomes of treatment. Realistic expectations, rather than unspecific hopes, are a better basis on which to establish patient compliance. Furthermore, if the treating physician has a realistic expectation of the patient’s likely response, then unnecessary dose changes or inappropriate cessation of GH treatment may also be avoided. References 1. Raben MS. 1958 Treatment of a pituitary dwarf with human growth hormone. J Clin Endocrinol Metab. 18:901–903. 2. Bourguinon JP, Vandeweghe M, Vanderscheren-Lodewycx M, Malvaux P, Wolter R, Du Caju M, Ernould C. 1986 Pubertal growth and final height in hypopituitaty boys: a minor role of bone age at onset of puberty. J Clin Endocrinol Metab. 63:376 –382. 3. Hibi I, Tanaka T, Committee for Treatment of Growth Hormone Deficient Children, Growth Science Foundation. 1989 Final height of patients with idiopathic growth hormone deficiency after long-term hormone treatment. Acta Endocrinol (Copenh). 120:409 – 415. 4. Wit JM, Kamp GA, Rikken B. 1996 Spontaneous growth and response to growth hormone treatment in children with growth hormone deficiency and idiopathic short stature. Pediatr Res. 39:295–301. 5. Coste J, Letrait M, Carel JC, et al. 1997 Long term results of growth hormone treatment in France in children of short stature: population, register based study. Br Med J. 315:708 –713. 6. Wallstro¨m A, Trulsson L. 1994 The Kabi International Growth Study: rationale, organisation and development. In: Ranke MB, Gunnarsson R, eds. Progress in growth hormone therapy–5 years of KIGS. Mannheim: J&J Verlag; 1–9. 7. Ranke MB. 1991 The Kabi Pharmacia International Growth Study: aetiology classification list with comments. Acta Paediatr Scand. 379:87–92. 8. Tanner JM, Whitehouse RH, Takaishi M. 1966 Standards from birth to maturity for height, height velocity and weight velocity: British children, 1965. Part II. Arch Dis Child. 41:613– 635. 9. Freeman JV, Cole TJ, Chinn S, Jones PR, White EM, Preece MA. 1995 Cross sectional stature and weight reference curves for UK (1990). Arch Dis Child. 73:17–24. 10. Niklasson A, Ericson A, Freyer JG, Karlberg J, Lawrence C, Karlberg P. 1991 An update of the Swedish reference standards for weight, length and head circumference at birth given gestational age (1977–1981). Acta Paediatr Scand. 80:756 –762. 11. Ranke MB. 1996 Towards a consensus on the definition of idiopathic short stature. Horm Res. 45:64 – 66. 12. Greulich WW, Pyle SI. 1959 Radiographic atlas of skeletal development of the hand and wrist, 2nd ed. Stanford: Stanford University Press. 13. Weisberg S. 1985 Applied linear regression, 2nd ed. Chichester: Wiley and Sons. 14. Cook RD, Weisberg S. 1982 Residuals and influence in regression. New York: Chapman and Hall. 15. Cowell CT, Dietsch S, Greenacre P. 1996 Growth hormone therapy for 3 years: the OZGROW experience. J Paediatr Child Health. 32:86 –93.
1183
¨ rskov H, Ranke MB, Shalet S, Skakkebaek NE. 1995 16. Andersson AM, O Interpretation of GH provocactive tests: comparison of cut-off values in four European laboratories. Eur J Endocrinol. 132:340 –343. 17. Ranke MB, Lindberg A, Guilbaud O. 1994 Prediction of growth in response to treatment with growth hormone. In: Ranke MB, Gunnarsson R, eds. Progress in growth hormone therapy–5 years of KIGS. Mannheim: J&J Verlag; 97–111. 18. Tanner JM, Whitehouse RH, Hughes PCR, Vince FP. 1971 Effect of human growth hormone treatment for 1–7 years on growth of 100 children with growth hormone deficiency, low birth weight, inherited smallness, Turner syndrome, and other complaints. Arch Dis Child. 46:745–782. 19. Preece MA, Tanner JM, Whitehouse RM, Cameron N. 1976 Dose dependence of growth response to human growth hormone in growth hormone deficiency. J Clin Endocrinol Metab. 42:477– 483. 20. Rolland A, Mugnier E, Rappaport R, Job JC. 1980 Le traitement du nanisme hypophysaire par l’hormone de croissance humaine. Arch Fr Pediatr. 37:659 – 665. 21. Frasier SD, Costin G, Lippe BM, Aceto Jr T, Bunger PF. 1981 A dose-response curve for human growth hormone. J Clin Endocrinol Metab. 53:1213–1217. 22. Wit JM, Faber JAJ, van den Brande JL. 1986 Growth response to human growth hormone treatment in children with partial and total growth hormone deficiency. Acta Paediatr Scand. 75:767–773. 23. Bundak R, Hindmarsh PC, Smith PJ, Brook CGD. 1988 Long-term auxological effects of human growth hormone. J Pediatr. 112:875– 890. 24. Albertsson-Wikland K. 1987 The effect of human growth hormone injection frequency on linear growth rate. Acta Paediatr Scand. 337:110 –116. 25. Wit JM, Van’t Hof MA, Van Den Brande JL. 1988 The effect of human growth hormone therapy on skinfold thickness in growth hormone deficient children. Eur J Pediatr. 147:588 –592. 26. Blethen SL, Baptista J, Kuntze J, Foley T, LaFranchi S, Johanson A. 1997 Adult height in growth hormone (GH)-deficient children treated with biosynthetic GH. The Genentech Growth Study Group. J Clin Endocrinol Metab. 82:418 – 420. 27. Aceto Jr T, Frasier SD, Hayles AB, Meyer-Bahlburg HF, Parker ML, Munschauer R, Di Chiro G. 1972 Collaborative study of the effects of human growth hormone in growth hormone deficiency. I. First year of therapy. J Clin Endocrinol Metab. 35:483– 496. 28. Blethen SL, Compton P, Lippe BM, Rosenfeld RG, August GP, Johanson A. 1993 Factors predicting the response to growth hormone (GH) therapy in prepubertal children with GH deficiency. J Clin Endocrinol Metab. 76:574 –579. 29. Ranke MB, Guilbaud O, Lindberg A, T Cole. 1993 Prediction of the growth response in children with various growth disorders treated with growth hormone: analysis of data from the Kabi Pharmacia International Growth Study. Acta Paediatr. 391(Suppl):82– 88. 30. Sherman B, Frane J, Johanson AJ, Kaplan SL. 1988 Predictors of response in treatment with methionyl human growth hormone. In: Underwood LE, ed. Human growth hormone. Progress and challenges. New York, Basel: Marcel Dekker; 131–142. 31. Ranke MB, Guilbaud O. 1991 Growth response in prepubertal children with idiopathic growth hormone deficiency during the first two years of treatment with growth hormone. Analysis of the Kabi Pharmacia International Growth Study. Acto Paediatr Scand. 379(Suppl):109 –115. 32. Ranke MB, Guilbaud O. 1992 Growth hormone levels in response to stimulation tests and responsiveness to growth hormone in children with growth hormone deficiency and idiopathic short stature. Kabi Pharmacia International Growth Study, Report 8, vol 1:34 – 41. 33. Kristro¨m B, Jansson C, Rosberg S, Albertsson-Wikland K. 1997 Growth response to growth hormone (GH) treatment relates to serum insulin-like growth factor I (IGF-I) and IGF-binding protein-3 in short children with various GH secretion capacities. Swedish Study Group for Growth Hormone Treatment. J Clin Endocrinol Metab. 82:2889 –2898. 34. Ranke MB, Price DA, Albertsson-Wikland K, Maes M, Lindberg A. 1997 Factors determining pubertal growth and final height in growth hormone treatment of idiopathic growth hormone deficiency. Analysis of 195 patients of the Kabi International Growth Study. Horm Res. 48:62–71.