A first order derivative spectrophotometric method was developed for the simultaneous estimation of montelukast sodium (MTK) and levocetirizine ...
Available online at www.scholarsresearchlibrary.com
Scholars Research Library Der Pharmacia Lettre, 2014, 6 (3):313-321 (http://scholarsresearchlibrary.com/archive.html) ISSN 0975-5071 USA CODEN: DPLEB4
Development and validation of a UV spectrophotometric method for simultaneous estimation of combination of Montelukast sodium in presence of Levocetirizine Dihydrochloride Nitin Kumar Patel, Pradeep Chouhan*, Suresh Kumar Paswan and Prakash Kumar Soni Industrial Pharmacy Research Lab, Department of Pharmacy, Shri G. S. Institute of Technology and Science, 23-Park Road, Indore, (MP) _____________________________________________________________________________________________ ABSTRACT A first order derivative spectrophotometric method was developed for the simultaneous estimation of montelukast sodium (MTK) and levocetirizine dihydrochloride (LCT) in bulk and tablet dosage form, using 0.5 % w/v sodium lauryl sulfate in distilled water. The zero-crossing point in the first order derivative spectra was employed for their estimation as MTK shows measurable derivative absorbance at the zero crossing point of LCT (350.2nm), whereas LCT shows measurable derivative absorbance at the zero crossing point of MTK (211.8nm). A Good linearity was observed for both drugs over the concentration range of 3-30 µg/ml with correlation coefficient (r2) 0.999. The % recovery study found to be 98.4% to 100.5% and 99.3% to 101.25% for MTK and LCT respectively. The % RSD for precision was found to be less than 2 %; LOD was 0.993 µg/ml and 0.361 µg/ml and LOQ 3.0 µg/ml and 1.09 µg/ml respectively, for MTK and LCT. The drug content of a marketed product Telekast-L® (Lupin Lab. Ltd., India) containing 10 mg MTK and 5 mg LCT was analyzed by developed analytical method, which was found to be 98.6 % and 99.2 % for MTK and LCT respectively. Statistical analysis of the data of developed method showed that it is precise, accurate, reproducible and selective for the analysis of MTK and LCT and therefore, it can be used for simultaneous estimation of the MTK and LCT in formulations. Keywords: Simultaneous estimation, Derivative spectrophotometry, Montelukast sodium, Levocetirizine dihydrochloride. _____________________________________________________________________________________________ INTRODUCTION Montelukast sodium (MTK), chemically 1-[[[(1R)-1-[3-(1E)-2-(7-chloro-2-quinolinyl) ethenyI]phenyI]-3-[2-(1hydroxy-1-methylethyl)phenyl]propyl]thio]methl]cyclopropaneacetic acid monosodium salt (Fig. 1a), is a white to off white powder. Its molecular weight and molecular formula is 608.2 g/mol and C35H35ClNO3S.Na respectively [1]. It is freely soluble in ethanol, methanol, and water and practically insoluble in acetonitrile [2]. It is a leukotriene receptor antagonist and, used for the maintenance treatment of asthma and to relieve symptoms of seasonal allergies [3-5]. Several analytical methods have been reported for estimation of MTK based on, UV spectrophotometry [6-8], ratio derivative spectroscopy [9, 10], colorimetry [11], thin layer chromatography (TLC) [12], high performance thin layer chromatography (HPTLC) [13], voltametry [14], high performance liquid chromatography (HPLC) with column-switching [15], liquid chromatography with fluorescence detection [16], capillary electrophoresis [17],
313 Scholar Research Library
Pradeep Chouhan et al Der Pharmacia Lettre, 2014, 6 (3): (3):313-321 ______________________________________________________________________________ mass spectroscopy coupling ing with liquid chromatography electrospray ionization (LC LC-ESI-MS/MS) [18], and simultaneous determination in combination drug formulation [13, 19, 20].
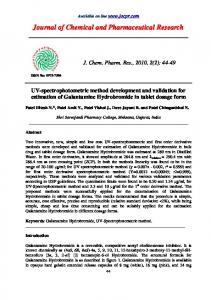
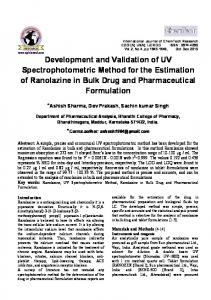
(a) (b) Fig. 1: Chemical hemical Structure of (a) montelukast sodium (MTK) and (b) levocetirizine dihydrochloride (LCT)
Levocetirizine dihydrochloride (LCT), (LCT chemically R-(+)-2-[2-[4-[(4-chlorophenyl)phenylmethyl] chlorophenyl)phenylmethyl] piperazin-1piperazin yl]ethoxy]acetic acetic acid dihydrochloride (Fig. 1b), is white crystalline powder [1]. It is the R enantiomer of cetirizine hydrochloride, a racemic compound with antihistaminic properties and freely soluble in water, practically insoluble in acetone and methylene chloride [21]. [2 Its molecular weight and molecular formula is 461.8 g/mol and C21H25ClN2O3·2HCl respectively. It is H1-receptor antagonist and, used for treatment of seasonal and perennial allergic rhinitis [5, 21-23]. Several ral analytical methods have been reported for determination of LCT based on, UV spectrophotometry [24], colorimetry [25], area under the curve (AUC) spectrophotometry [26], TLC [12], reverse phase high performance liquid chromatography ((RP-HPLC) [13], and simultaneous determination in combination drug formulation [10, 12, 13]. Direct UV/Visible spectrophotometric analytical methods are not applicable where the spectral bands of the coformulated drugs overlapping and make the simultaneous determination of those se drugs impossible. The derivative UV/Visible spectrophotometry has been utilized successfully for the several drugs to overcome the problem of interference due to spectral overlapping [27, 28]. This technique offers advantage like enhancement of sensitivity, sensitivity rapid estimation without requirement of drug extraction or separation, provides accurate, precise, precise and reproducible results. It hass been conveniently applied for determination of active ingredients in content uniformity tests, dissolution tests, and other similar in in-process quality control tests of pharmaceutical formulations. formulations The literature survey revealed that most of the reported analytical methods for simultaneous estimation of MTK and LCT in combination in pharmaceutical formulations are mostly based on chromatography, which are complex, time consuming, requires expensive instrumental set up up, and skilled operator. In the present investigation a simple, accurate, precise and economical analytical method based on the first order derivative spectrophotometry (D1 spectrophotometric method) was as developed, which can be used for quantitative analysis of combination of MTK and LCT in formulation. MATERIALS AND METHODS Instrument A double beam UV/Visible spectrophotometer (Shimadzu® 1700 Pharmaspec)) with wavelength accuracy (±0.5 nm), 1cm matched quartz cells, and UV probe 2.10 software was used. Calibrated analytical balance (Shimadzu AY220) was used for weighing purpose. Bath sonicator (Enertech® Electronics Pvt. Ltd., Mumbai) was used for sonication of solutions. All statistical calculations were carried out using Microsoft Excel® 2007 analytical tool.
314 Scholar Research Library
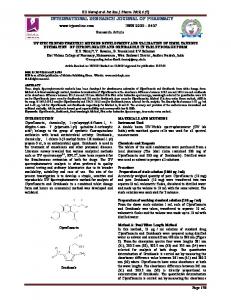
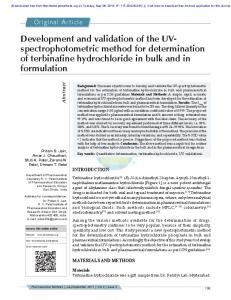
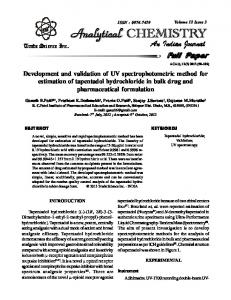
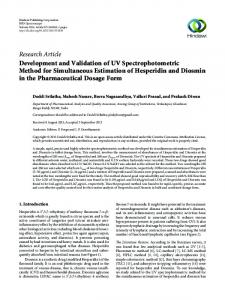
Pradeep Chouhan et al Der Pharmacia Lettre, 2014, 6 (3):313-321 ______________________________________________________________________________ Materials Montelukast sodium was obtained as gift sample from Morepen Lab. Ltd. Solan, India. Levocetirizine dihydrochloride was obtained as gift sample from Symed Lab. Ltd. Hyderabad, India. Sodium lauryl sulfate was purchased from Loba Chemie Pvt. Mumbai, India. All solutions were prepared in distilled water. Montelukast sodium and Levocetirizine dihydrochloride combination tablet (Telekast-L®, Lupin Lab. Ltd. India) was purchased from local market. A 0.5% w/v sodium lauryl sulfate (SLS) in distilled water was used as a medium for analytical method development. Method development Preparation of standard stock solution: Accurately weighed 25 mg of each MTK and LCT API were transferred to separate amber colored volumetric flask of 100 ml capacity, and dissolved in 50 ml of 0.5 % w/v SLS solution and then diluted up to the mark with the same to get 250 µg/ml MTK and LCT. Preparation of standard working solution: Standard working solution of 100 µg/ml concentrations of both drugs in separate amber colored volumetric flask from standard stock solution was freshly prepared before the use. Preparation of sample stock solution: The average weight of 20 Telekast-L® tablets was determined, and crushed to fine powder. The powder equivalent to 10 mg MTK and 5 mg LCT was transferred to 100 ml capacity amber colored volumetric flask and dissolved in 50 ml of 0.5 % w/v SLS solution and sonicated for 20 min. in a bath sonicator and filtered through Whatman grade #41 filter paper and then made up to volume with the same to get 100 µg/ml MTK, and 50 µg/ml LCT sample stock solution. Selection of analytical wavelength: A zero order UV spectrum (D0) (Fig. 2) of MTK and LCT was obtained by scanning 10 µg/ml of both the drugs at 200-400 nm on a double beam UV/Visible spectrophotometer (Shimadzu® 1700 Pharmaspec). MTK and LCT showed maximum absorbance (ʎmax) at 285 nm and 231 nm, respectively. D0 spectra of both drugs were converted into first order UV spectra (D1) using UV probe 2.10 software (dalta lamda 2.0) (Fig. 3). Selection of wavelengths for estimation of MTK and LCT was done in such a manner that MTK showed measurable derivative absorbance at the zero cross point of LCT (350.2 nm), whereas LCT showed measurable derivative absorbance at the zero cross point of MTK (211.8 nm). The quantification estimation of both drugs then became possible by D1 spectrophotometric method at 350.2 nm and 211.8 nm for MTK and LCT, respectively.
Fig. 2: Overlain zero order spectra (D0) of montelukast sodium (MTK) and levocetirizine dihydrochloride (LCT).
315 Scholar Research Library
Pradeep Chouhan et al Der Pharmacia Lettre, 2014, 6 (3):313-321 ______________________________________________________________________________
Fig. 3: Overlain first order spectra (D1) of montelukast sodium (MTK) and levocetirizine dihydrochloride (LCT).
Method validation Calibration curve and linearity of method: Eight solutions of different concentrations (5, 10, 15, 20, 25, 30, 35 and 40 mg/ml) of both drugs were prepared separately using eight different aliquots of standard working solutions. Each dilution was prepared sextaplicate, and scanned in the range of 200-400 nm against the blank, and average of six first derivative (D1) absorbance value was taken for calibration curve and linearity study. The calibration curve was plotted between average D1 absorbance and concentration. Accuracy: Accuracy of the developed method was tested by determining of % recovery of standard drug at 3 different concentration levels 80, 100, and 120% to the prequantified sample solution of the marketed formulation. Each concentration was analyzed six times, and average recoveries of added standard drug were measured. Precision: For performing intraday precision (repeatability), and inter-day precision (intermediate precision) three concentrations including lower, middle, and upper limits (5, 15, and 25 g/ml) of calibration curve of both drugs were taken and analyzed six times on the same day for intraday precision, and on 3 different days (first, second and third) for inter-day precision. Limit of detection (LOD) and limit of quantification: ICH guidelines describe several approaches to determine limit of detection and limit of quantification. These include visual inspection, signal to-noise ratio, and the use of standard deviation of the response and the slope of the calibration curve [29]. In the present study, the LOD and LOQ of the developed method were employing the response and slope of calibration curve. The value of LOD and LOQ were calculated according to 3.3 /S and 10 /S criteria respectively, where is the standard deviation of the -intercepts of the regression lines and S is the slope of the calibration curve [29].
316 Scholar Research Library
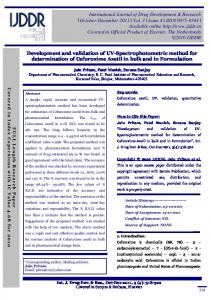
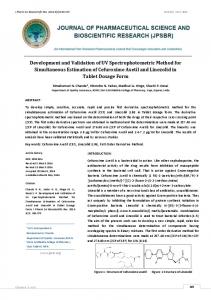
Pradeep Chouhan et al Der Pharmacia Lettre, 2014, 6 (3):313-321 ______________________________________________________________________________ Solution state stability: Drug samples prepared for inter-day precision (intermediate precision) were preserved for 72 h at room temperature and analyzed for solution state stability by observing changes in the absorbance at their respective analytical wavelengths and obtained data were compared with absorbance of freshly prepared samples. Sample solutions were protected from exposure of light by using amber colored vials wrapped with aluminum foil and black paper. Assay of bulk drug: Fifty mg MTK and 25 mg LCT were accurately weighed, and transferred to a 100 ml capacity amber colored volumetric flask, dissolved in approximately 50 ml 0.5 % w/v SLS solution and, made up to volume with the same. Appropriate dilutions were made in 0.5 % w/v SLS solution to obtain 20 g/ml of MTK and 10 g/ml of LCT. The resulting drugs samples were analyzed for drug content by D1 spectrophotometric method at 350.2 nm and 211.8 nm for MTK and LCT, respectively. Assay was repeated 6 times and standard deviation was calculated. Assay of marketed tablet formulation (Telekast-L®): Twenty marketed tablets (Telekast-L®, Lupin Lab. Ltd., India) having label claim of 10 mg MTK and 5 mg LCT, were weighed accurately and crushed to fine powder. The powder equivalent to 10 mg MTK and 5 mg LCT was weighed accurately and transferred to 100 ml capacity amber colored volumetric flask containing 50 ml of 0.5 % w/v SLS solution and then sonicated for 20 min. The resulting dispersion was filtered through whatman grade #41 filter paper and the volume was made up to the mark with 0.5 % w/v SLS solution. From above solution appropriate dilution was done to obtain 20 µg/ml MTK and 10 µg/ml LCT. Resulting solution was analyzed for drug content by D1 spectrophotometric method at 350.2 nm and 211.8 nm for MTK and LCT respectively. Assay was repeated 6 times and standard deviation was calculated. RESULTS AND DISCUSSION The estimation of MTK in the presence of LCT by conventional UV spectrophotometry is not possible because the zero-order absorption spectra of MTK and LCT in 0.5 % w/v SLS solution exhibit overlapping in the region of 200300 nm (Fig. 2). A first-order derivative UV spectrophotometric method for simultaneous estimation of MTK and LCT was developed by using the zero-crossing point of both drugs in their respective first order derivative spectra and validated as per ICH guidelines [29]. The developed method resolves the problem of interference of LCT due to peak overlapping in estimation of MTK and vice versa. The method could also remove broadband contributions from excipients. Derivative spectra of different orders were studied for both MTK and LCT individually and simultaneously. The experiments showed that the first-order derivative spectra of MTK and LCT were simple, and gave results with accuracy and precision. The overlain first-order derivative spectra of MTK and LCT at different concentrations revealed that MTK showed measurable derivative absorbance at the zero cross point of LCT (at 350.2 nm) whereas LCT showed measurable derivative absorbance at the zero cross point of MTK (at 211.8 nm). On the basis of this observation it was decided to do quantification of both drugs by first-order derivative spectrophotometric method at 350.2 nm and 211.8 nm for MTK and LCT, respectively (Fig. 3). Calibration curves and linearity of method: Calibration curves (D1 absorbance versus concentration) were constructed in 0.5% w/v SLS solution in the concentration ranges of 5-25 µg/ml for MTK and LCT. The correlation coefficients of MTK and LCT are found to be 0.9994 and 0.9999 respectively, and y-intercepts and slopes of the regression line were given in Table 1. Following equations for straight line for MTK and LCT were obtained (Fig. 4 and 5). Regression equation for MTK: y = -0.0008116x + 0.0000764 Regression equation for LCT: y = -0.003764x - 0.0004233 A good linearity (propositional change in absorbance with respect to change in concentration) was obtained in the concentration range of 3-30 µg/ml for both drugs.
317 Scholar Research Library
Pradeep Chouhan et al Der Pharmacia Lettre, 2014, 6 (3):313-321 ______________________________________________________________________________ Table 1: Regression analysis of calibration curve equation MTK LCT Parameters Analytical wavelength (nm) 350.2 211.8 Linearity range (µg/ml) 3-30 3-30 Regression equation (y = mx + c) -0.0008116x + 0.0000764 -0.003764x - 0.0004233 0.9994 0.9999 Correlation coefficient (r2) Slope -0.0008116 -0.003764 Intercept 0.0000764 -0.0004233 Mean standard deviation (σ) 0.000244 0.000411 LOD (µg/ml) 0.993 0.361 LOQ (µg/ml) 3.0 1.09 MTK: Montelukast sodium, LCT: Levocetirizine dihydrochloride, LOD: Limit of detection, LOQ: Limit of quantification
Concentration (µg/ml) 0 0
5
10
15
20
25
30
D1 Absorbance
-0.005 y = -0.0008116x + 0.0000764 R² = 0.99949
-0.01
-0.015
-0.02
-0.025
. Fig. 4: Calibration curve of montelukast sodium in 0.5% w/v SLS at 350.2 nm
Concentration (µg/ml) -1E-17 0
5
10
15
20
25
30
D1 Absorbance
-0.02
-0.04
y = -0.0037644x - 0.0004233 R² = 0.9998563
-0.06
-0.08
-0.1 . Fig. 5: Calibration curve of levocetirizine dihydrochloride in 0.5% w/v SLS at 211.8 nm
318 Scholar Research Library
Pradeep Chouhan et al Der Pharmacia Lettre, 2014, 6 (3):313-321 ______________________________________________________________________________ Accuracy: Accuracy was determined by determining the % recovery of MTK and LCT in prequnatified marketed formulation solution and recovered amount was expressed as percentage. The % recovery was found to be in the range 98.4 % – 100.5 % for MTK and 99.3 % - 101.25 % for LCT (Table 2). Table 2: Results of accuracy study
Drug
MTK
LCT
Level Initial concentration of drug Drug concentration added Drug concentration recovereda ±SDb of recovery % Recovery (µg/ml) (µg/ml) (µg/ml) (%) 80 10 8 7.95 ± 0.057 99.37 100 10 10 9.84 ± 0.114 98.40 120 10 12 12.06 ± 0.185 100.50 80 10 8 7.99 ± 0.159 99.87 100 10 10 9.93 ± 0.079 99.30 120 10 12 12.15 ± 0.049 101.25 MTK: Montelukast sodium, LCT: Levocetirizine dihydrochloride, aAverage of six determinations, bStandard deviation
Precision: Intraday precision (repeatability) and inter-day precision (intermediate precision) of the developed method were expressed in terms of coefficients of variation (CV) or % relative standard deviation (% RSD) of recovered amount. The results showed that intraday and inter-day variation at three different concentrations, i.e., 5, 15 and 25 µg/ml for both the analyzed drugs were within the acceptable range. The % RSD for both the intraday and inter-day precision of the method were found to be less than 2% (Table 3). Table 3: Results of precision study Recovered Concentrationa ± SDb % Recovery % RSDc (µg/ml) 5 4.95 ± 0.052 99.0 1.05 MTK 15 15.2 ± 0104 101.3 0.684 Intraday 25 24.8 ± 0.117 99.2 0.471 101.6 1.61 (Repeatability) 5 5.08 ± 0.082 15 14.85 ± 0.152 99.0 1.02 LCT 25 25.23 ± 0.182 100.9 0.721 5 5.07 ± 0.088 101.4 1.73 MTK 15 15.32 ± 0.205 102.1 1.33 Inter-day 25 25.35 ± 0.272 101.4 1.07 (Intermediate precision) 5 4.91 ± 0.089 98.2 1.81 LCT 15 14.72 ± 0.161 98.1 1.09 25 24.82 ± 0.192 99.2 0.773 MTK: Montelukast sodium, LCT: Levocetirizine dihydrochloride, aAverage of six determinations, bStandard deviation, cRelative standard deviation Precision
Drug
Concentration (µg/ml)
Limit of detection (LOD) and limit of quantification (LOQ): The limit of detection (LOD) and limit of quantification (LOQ) for MTK and LCT was found to be 0.993 µg/ml and 0.361 µg/ml and, 3.0 µg/ml and 1.09 µg/ml, respectively. The limits are sufficient for their accurate determination in comparison with reported spectrophotometric methods for estimation of individual drugs and for simultaneous estimation. The sensitivity of the proposed method is comparable with some of the reported analytical methods [1011, 19]. Assay of bulk drug and marketed formulation: The performance of developed first order derivative spectrophotometric method was confirmed by performing assay of bulk drug (50 mg MTK and 25 mg LCT) and a marketed formulation Telekast-L® (Lupin Lab. Ltd., India) containing MTK 10 mg and LCT 5 mg. The drug content in bulk drug mixture was found to be 101.84 and 100.88 % for MTK and LCT respectively and the drug content in Telekast-L® was found to be 98.6 % and 99.2 % of labeled claim for MTK and LCT respectively (Table 4). A first order spectrum (D1) of marketed formulation is shown in Fig. 6.
319 Scholar Research Library
Pradeep Chouhan et al Der Pharmacia Lettre, 2014, 6 (3):313-321 ______________________________________________________________________________ Table 4: Result of bulk drug and marketed formulation assay Assay
Observed amounta ± SDb (mg) MTK 50 50.92 ± 0.189 LCT 25 25.22 ± 0.070 MTK 10 9.86 ± 0.261 LCT 5 4.96 ± 0.228 a Average of six determination, b Standard deviation
Name of drug
Bulk drug Marketed formulation (Telekast-L®)
Amount taken (mg)
% Drug content 101.84 100.88 98.60 99.20
Fig. 6: First order spectra (D1) of marketed formulation (Telekast- L®) MTK: montelukast sodium, LCT: levocetirizine dihydrochloride
Solution state stability: Drug sample solutions (inter-day precision) were found to be stable in solution state and % RSD value of assay is well below 2 % as compare to the freshly prepared sample. Summary of validated parameters were given in table 5. Table 5: Summary of validation parameters Parameter Linearity (r2) Linearity range ( g/ml) Accuracy (% Recovery) Precision (% RSD) Intraday Inter-day Limit of detection (LOD) ( g/ml) Limit of quantification (LOQ) ( g/ml) Bulk drug assay (%) Marketed formulation assay (%)
MTK 0.9994 3–30 98.4-100.5
LCT 0.9999 3–30 99.3-101.25
0.931-1.38 0.685-1.4 0.993 3.0 101.84 98.6
0.488-1.88 0.178-1.04 0.361 1.09 100.88 99.2
CONCLUSION The developed derivative UV spectrophotometric method is a new, simple, precise, accurate and economical for simultaneous quantitative estimation of MTK and LCT. The method was validated (as per ICH guidelines) for various parameters, viz., linearity, accuracy, precision, limits of detection (LOD) and limit of quantification (LOQ).
320 Scholar Research Library
Pradeep Chouhan et al Der Pharmacia Lettre, 2014, 6 (3):313-321 ______________________________________________________________________________ It could serve as an alternative method for determination of MTK and LCT simultaneously in marketed products and therefore, may be used for routine quality control analysis of MTK and LCT in multidrug products. Acknowledgement The authors are thankful to m/s. Morepen Lab. Ltd. Solan, India and m/s. Symed Lab. Ltd. Hyderabad, India for providing gift sample of montelukast sodium and levocetirizine dihydrochloride, respectively. REFERENCE [1] Indian Pharmacopoeia, 6th ed., The Indian Pharmacopoeia Commission, Ghaziabad, Govt. of India, Ministry of Health and Family Welfare, New Delhi, 2010; pp. 1037, 1705. [2] MJ O'Neil (Ed.) In; The Merck Index: An Encyclopedia of Chemicals, Drugs, and Biologicals 14th Ed., Merck & Co. Inc., Whitehouse Station, NJ, 2006; pp. Pages. [3] BJ Undem. Pharmacotherapy of asthma, In: LL Brunton; SJ Lazo, LK Parker (Eds.) Goodman's and Gliman's The Pharmacological Basis of Therapeutics, 11th ed., The McGraw-Hill Companies, Inc., New York, 2006; pp. 722725. [4] HP Rang; MM Dale; JM Ritter, PK Moore. Phamacology, 5th ed., Churchill Livingstone, New Delhi, 2003; pp. 347-348. [5] KD Tripathi. Essential of Medicinal Pharmacology, 5th ed., Jaypee Brothers Medical Publishers (P) Ltd., New Delhi, 2003; pp. 205. [6] MS Arayne; N Sultana, F Hussain. J. Anal. Chem., 2009, 64, 7,690-695. [7] K Pallavi, PS Babu. International Journal of Advances in Pharmacy, Biology and Chemistry, 2012, 1,434-437. [8] LK Garg; BR Kumar; SS Sait, T Krishnamurthy. Int J Pharm Sci Rev Res, 2011, 7, 2,69-72. [9] ST Hassib; AA El-Zaher, MA Fouad. Drug Test Anal, 2011, 3, 5,306-318. [10] V Choudhari; A Kale; S Abnawe; B Kuchekar; V Gawil, N Patil. Int J Pharm Tech Res, 2010, 2, 1,4-9. [11] JVK Shanmukha; VP Geeta; SVM Vardhna, D Ramachandran. Der Pharma Chemica, 2012, 4, 2,720-724. [12] S Sharma; MC Sharma; DV Kohli, AD Sharma. Der Pharmacia Lettre, 2012, 2, 1,489-494. [13] AS Rathore; L Sathiyanarayanan, KR Mahadik. Pharm Anal Acta, 2010, 1,1-6. [14] I Alsarra; M Al-Omar; EA Gadkariem, F Belal. Farmaco, 2005, 60, 6-7,563-567. [15] L Liu; H Cheng; JJ Zhao, JD Rogers. J Pharm Biomed Anal, 1997, 15, 5,631-638. [16] S Al-Rawithi; S Al-Gazlan; W Al-Ahmadi; IA Alshowaier; A Yusuf, DA Raines. J Chromatogr B Biomed Sci Appl, 2001, 754, 2,527-531. [17] Y Shakalisava, F Regan. J. Sep. Sci., 2008, 31,1137-1143. [18] BR Challa; BZ Awen; BR Chandu; M Khagga, CB Kotthapalli. Sci Pharm, 2010, 78, 3,411-422. [19] T Radhakrishna; A Narasaraju; M Ramakrishna, A Satyanarayana. J Pharm Biomed Anal, 2003, 31, 2,359-368. [20] NS Rana; KS Rajesh; NN Patel; PR Patel; U Limbachiya, TY Pasha. Indian J Pharm Sci, 2013, 75, 5,599-602. [21] Levocetirizine, "Official FDA Information, Side Effects and Uses" http://www.drugs.com/pro/levocetirizine.html (22 Jan. 2014). [22] J Deruiter. Histamine and antihistaminic agents, In: JH Beale, JH Block (Eds.) Wilson and Gisvold’s Textbook of Organic Medicinal and Pharmaceutical Chemistry, 11th ed., Lippincott Williams and Wilkins, Baltimore, 2004; pp. 755. [23] WL Nelson. Antihistamines and related antiallergic and antiulcer drugs, In: TL Lemke; DA Williams; VF Roche, SW Zito (Eds.) Foye's Principles of Medicinal Chemistry, 6th ed., Lippincott Williams & Wilkins, Baltimore, 2008; pp. 1257-1258. [24] S Chauhan; D Dasadiya; S Patel; D Kumar, N Jivani. International Research Journal of Pharmacy, 2012, 3, 5,338-341. [25] K Basavaiah; MS Raghu, KB Vinay. B Chem Soc Ethiopia, 2012, 26, 3,319-328. [26] NK Patel, SS Pancholi. Der Pharma Chemica, 2011, 3, 5,135-140. [27] HH Willard; LL Merritt; JA Dean, FA Settle. Intrumental Methods of Analysis, 7th ed., CBS Publishers and Distributers, New Delhi, 2012; pp. 177-178. [28] AG Davidson. Ultraviolet - visible absorption spectrophotomerty, In: AH Beckett, JB Stenlake (Eds.) Practical Pharmaceutical Chemistry, ed., CBS Publishers and Distributors, New Delhi, 2005; pp. 275-337. [29] International Conference on Harmonization (ICH), Validation of analytical procedures: Text and methodology , Q2 (R1), Geneva, Switzerland, 2005; pp. 1-13.
321 Scholar Research Library