Hindawi Publishing Corporation ISRN Spectroscopy Volume 2013, Article ID 534830, 4 pages http://dx.doi.org/10.1155/2013/534830
Research Article Development and Validation of UV Spectrophotometric Method for Simultaneous Estimation of Hesperidin and Diosmin in the Pharmaceutical Dosage Form Doddi Srilatha, Mahesh Nasare, Borra Nagasandhya, Valluri Prasad, and Prakash Diwan Department of Pharmaceutical Analysis and Quality Assurance, Anurag Group of Institutions, Venkatapur, Ghatkesar, Ranga Reddy 501301, India Correspondence should be addressed to Doddi Srilatha;
[email protected] Received 8 August 2013; Accepted 5 September 2013 Academic Editors: P. Forgo and I. P. Gerothanassis Copyright © 2013 Doddi Srilatha et al. This is an open access article distributed under the Creative Commons Attribution License, which permits unrestricted use, distribution, and reproduction in any medium, provided the original work is properly cited. A simple, rapid, precise and highly selective spectrophotometric method was developed for simultaneous estimation of Hesperidin and Diosmin in tablet dosage form. This method, involves the measurement of absorbances of Hesperidin and Diosmin at the wavelengths of 285 nm (𝜆 max of Hesperidin) and 268 nm (𝜆 max , of Diosmin). The UV spectra’s of Hesperidin and Diosmin prepared in different solvents water, methanol, and acetonitrile and 0.2 N sodium hydroxide were recorded. These two drugs showed good absorbances when dissolved in 0.2 N NaOH. Hence 0.2 N NaOH was selected as the solvent for the method. Two wavelengths 285 and 268 nm were selected which are 𝜆 max of two drugs Hesperidin and Diosmin, respectively. Different concentrations of Hesperidin (5–50 𝜇g/mL) and Diosmin (2–24 𝜇g/mL) and a mixture of Hesperidin and Diosmin were prepared, scanned and absorbances were noted at the two wavelengths were fixed for the study. The method showed good reproducibility and recovery with % RSD less than 2. The LOD of Hesperidin and Diosmin was found to be 0.139 𝜇g/mL and 0.048 𝜇g/ml and LOQ of Hesperidin and Diosmin was found to be 0.42 𝜇g/mL and 0.147 𝜇g/mL, respectively. Thus the proposed method was found to be rapid, specific, precise, accurate and cost effective quality control tool for the routine analysis of Hesperidin and Diosmin in bulk and combined dosage form.
1. Introduction
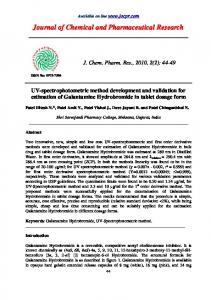
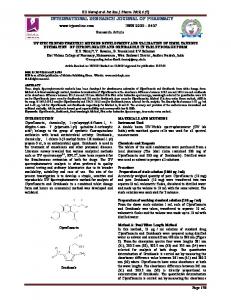
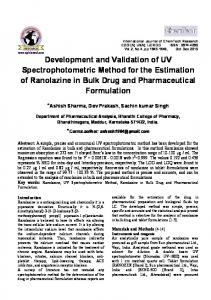
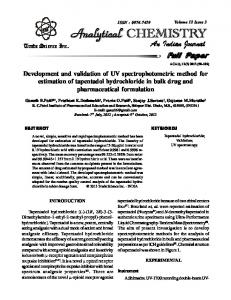
Hesperidin is 3 ,5,7-trihydroxy-4 methoxy flavanone 7-o-𝛽rutinoside which is greatly found in citrus species and is the active constituent of tangerine peel (citrus reticulate antiinflammatory effect by the inhibition of eicosanoids synthesis other biological activities including blood cholesterol lowering effect, hypotensive effect, protective agent against sepsis, antioxidant activity, and diuretics). It prevents poisoning caused by lead strontium and heavy metals. It is also used for diabetics and gastroesophageal reflux diseases. Hesperidin converted to hesperitn by intestinal microflora and subsequently absorbed from intestinal mucosa (see Figure 1). Diosmin is a synthetic drug (modified Hesperidin) of the flavonoid family. It is an oral phlebotropic drug used in the treatment of venous disease, that is, chronic venous insufficiently (CVI) and hemorrhoidal diseases. Diosmin aglycone is diosmetin; IUPAC name is 3 ,5,7-trihydroxy-4 methoxy
flavone 7-rutinosode. It might have potential in the treatment of neurodegenerative disease such as alzheimer’s diseases, and its anti-inflammatory and antiapoptotic activities have been demonstrated in neuronal cells. It reduces venous hyperpressure present in patients suffering from CVI. It also improves lymphatic drainage by increasing the frequency and intensity of lymphatic contraction and by increasing the total number of functional lymphatic capillaries (see Figure 2). The Literature Review. According to the literature survey, it was found that few analytical methods such as UV [1–5], Fluorometric method [6], LC-method [7], LC-MS method [8], HPLC method [9, 10], capillary electrophoresis [11], simple colorimetric method [12], thin layer chromatography (TLC) [13], and adsorptive stripping voltammetry [14] were reported for hesperidin and Diosmin. To our knowledge, no study related to the UV spectrophotometric method for the simultaneous estimation of hesperidin and diosmin has
2
ISRN Spectroscopy OH
0.6
HO 2 O Absorbance
HO O OH HO
1
5 2
0.2
O
O
Diosmin
0.4
1
O
HO
O
4
OH
0 220 HO
4 Hesperidin
250
300
350
400
450
(nm)
O
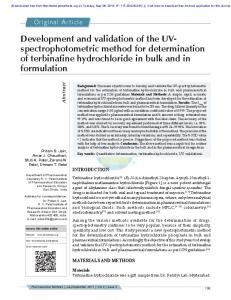
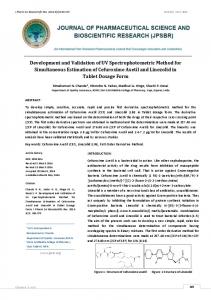
Figure 3: Overlain normal spectra of Hesperidin and Diosmin in 0.2 N NaOH.
Figure 1: Chemical structure of Hesperidin. OH
automatic correction with a pair of 1 cm matched quartz cells).
HO O HO O
OH
O
HO O O
HO
O
HO
O HO
Figure 2: Chemical structure of Diosmin.
been reported in literature. Therefore, there is a challenge to develop UV spectrophotometric method for the simultaneous estimation of hesperidin and diosmin. The present study was involved in a research effort aimed at developing and validating a simple, specific, accurate, economical, and precise UV spectrophotometric method for the simultaneous estimation of two drugs in pharmaceutical dosage form.
2. Materials and Methods 2.1. Materials and Reagents. Hesperidin and Diosmin working standards were procured from Mylan Laboratories, Hyderabad, India. Commercially available Daflon 500 mg was purchased from local pharmacy. Methanol, Acetonitrile, and Sodium hydroxide were obtained from Merck Chemicals. Water was prepared by using Millipore Milli Q Plus water purification system. 2.2. Instrument. UV-Visible double beam spectrophotometer (Shimadzu Model 1800) was employed with a spectral band width of 1 nm and a wavelength accuracy of 0.3 nm (with
2.3. Method. The UV spectra of Hesperidin and Diosmin in different solvents like water, methanol, ethanol, acetonitrile, sodium hydroxide (0.2 N) were recorded. The two drugs showed good absorbances when dissolved in 0.2 N NaOH. Hence, 0.2 N NaOH was selected as the solvent for the method; two wavelengths 285 and 268 nm were selected which are 𝜆 max , two drugs Hesperidin and Diosmin, respectively (see Figure 3). Different concentrations of Hesperidin (5–50 𝜇g/mL) and Diosmin (2–24 𝜇g/mL) and a mixture of Hesperidin and Diosmin were prepared and scanned. Two absorbances were noted at the two wavelengths fixed for the study. The absorbance of Hesperidin and Diosmin was measured, and absorptivity values 𝐸 (1% 1 cm) were determined at all the wavelengths. The concentration of two drugs in mixture can be calculated using the following equations: 𝐶Hesperidin = 𝐶Diosmin
(𝐴2𝑎𝑦1 − 𝐴1𝑎𝑦2) − 𝑎𝑥1𝑎𝑦2, 𝑎𝑥2𝑎𝑦1
(𝐴1𝑎𝑥2 − 𝐴2𝑎𝑥1) = − 𝑎𝑥1𝑎𝑦2, 𝑎𝑥2𝑎𝑦1
(1)
where 𝐶Hesperidin and 𝐶Diosmin are the concentrations of Hesperidin and Diosmin, respectively, in mixture and in sample solution. 𝐴1 and 𝐴2 are the absorbances of sample at 285 nm and 268 nm, respectively. 𝑎𝑥1 and 𝑎𝑥2 are the absorptivity of Hesperidin at 285 nm and 268 nm, respectively; 𝑎𝑦1 and 𝑎𝑦2 are the absorptivity of Diosmin at 285 nm and 268 nm, respectively (see Figures 4 and 5).
3. Results and Discussion The analytical method was validated with respect to parameters such as linearity, precision, accuracy, limit of detection (LOD), limit of quantification (LOQ), and ruggedness.
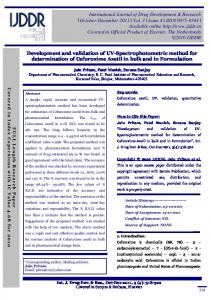
ISRN Spectroscopy 3 y = 0.018x − 0.003 R2 = 0.999
2
2 10
20
30
40
50
60
Concentration
Absorbance
Absorbance
1 0.9 0.8 0.7 0.6 0.5 0.4 0.3 0.2 0.1 0 0
3
1
4
1
Figure 4: Calibration curve of Hesperidin at 285 nm. 1.2
3
Absorbance
1 0.8
0 220
y = 0.041x − 0.021 R2 = 0.999
0.6
250
300
350
400
450
(nm)
0.4
Figure 6: Spectrum of Hesperidin and Diosmin.
0.2 0
0
5
10
15 20 Concentration
25
30
Figure 5: Calibration curve of Diosmin at 268 nm. Table 1: Linearity values of Hesperidin and Diosmin. Parameter Regression equation Linearity 𝜇g/mL Correlation coefficient
Hesperidin 𝑌 = 0.018𝑥 − 0.003 5–50 0.999
Diosmin 𝑌 = 0.04𝑥 + 0.021 2–24 0.999
Table 2: Precision values of Hesperidin and Diosmin. Drug Hesperidin Diosmin
Concentration (𝜇g/mL)
Intraday (% RSD)
Interday (% RSD)
20 10
0.21 0.14
0.055 0.21
3.1. Linearity. Linearity was established by least squares linear regression analysis of the calibration curve, and the calibration curves were linear over the concentration range of 5–50 𝜇g/mL for hesperidin and 2–24 𝜇g/mL for Diosmin. Absorbances were plotted versus respective concentrations, and linear regression analysis was performed on the resultant curves; correlation coefficient was found to be 0.999 and 0.999 for hesperidin and Diosmin, respectively (see Table 1). 3.2. Precision. To check the degree of repeatability of the method, suitable statistical evaluation was carried out. The concentrations of the two drugs were measured 3 times on the same day at intervals of one hour and on three different days for intra- and inter-day study. The standard deviation (SD) and relative standard deviation (RSD) were calculated. The results are given in Table 2. 3.3. Accuracy. Recovery studies were carried out by applying the method to a drug sample to which known amount of
standard. Hesperidin and Diosmin corresponding to 50, 100, and 150 of label claim had been added. At each level of the amount, three determinations were performed. The results are given in Table 3. 3.4. LOD and LOQ. The LOD of hesperidin and diosmin was found to be 0.139 𝜇g/mL and 0.048 𝜇g/mL, respectively, and the LOQ was found to be 0.042 𝜇g/mL, and o.147 𝜇g/mL respectively. the results are given in Table 4. 3.5. Analysis of Marketed Formulation. Twenty tablets (Daflon 500 mg) were powdered, and the average weight was calculated. The Quantity equivalent to 10 mg of drug was dissolved in 0.2 N NAOH and to it 8 mg of (standard addition method) such that sample contains 9 mg of each Hesperidin and Diosmin. Absorbances were noted at 285 nm and 268 nm, respectively (see Table 5 and Figure 6).
4. Conclusion This method is considered simple, reliable, and selective providing satisfactory accuracy, precision with lower limits of detection, more specific quantification and sensitivity. The good recoveries were obtained in all cases, and the reliable agreement with the reported procedure proved that the proposed method could be applied efficiently for the determination of Hesperidin and Diosmin in oral dosage form with satisfactory precision; moreover, the shorter duration of analysis of Hesperidin and Diosmin marks the reported method suitable for routine analysis in pharmaceutical dosage forms.
Authors’ Contribution Author Srilatha managed the literature survey and analysis of the study and wrote the first draft of the paper. Author Mahesh Nasare designed the study plan and authors Dr. V. V. L. N. Prasad and Dr. Prakash V. Diwan provided chemicals and instruments.
4
ISRN Spectroscopy Table 3: Recovery values of Hesperidin and Diosmin.
Drug Hesperidin Diosmin
Recovery 100% 98.66 99.3
50% 100.6 102
150% 101 100
50% 0.289 0.280
% RSD 100% 0.260 0.204
150% 0.281 0.239
% RSD of three observations.
Table 4: LOD and LOQ of Hesperidin and Diosmin. Drug Hesperidin Diosmin
LOD 0.139 0.048
LOQ 0.42 0.147 [9]
Table 5: Analysis of formulation and its % RSD values. Drug Amount labeled Amount found % label claim % RSD Hesperidin 50 49.8 99.6 0.24 Diosmin 450 452 100.4 0.19
Acknowledgment The authors are grateful to the School of Pharmacy, Anurag Group of Institutions, Hyderabad, for giving permission to carry out their research work.
[10]
[11]
[12]
References [1] Z. Moldovan, A. A. Bunaciu, M. Al-Omara, and H. Y. AboulEnein, “A spectrophotometric method for diosmin determination,” The Open Chemical and Biomedical Methods Journal, vol. 3, pp. 123–127, 2010. [2] V. Kuntic, N. Pejic, and S. Micic, “Direct spectrophotometric determination of hesperidin in pharmaceutical preparations,” Acta Chimica Slovenica, vol. 59, pp. 436–441, 2012. [3] S. Wei, X. Ze, and L. Xin, Detection of Hesperidin in Orange Skin By the UV-VIS Spectrophotometry, Chinese Journal of Spectroscopy Laboratory, 2005. [4] A. El Bayoumi, “Modified H-point standard addition method and logarithmic function for the spectrophotometric and spectrodensitometric determination of hesperidin and diosmin in mixtures,” Analytical Letters, vol. 32, no. 2, pp. 383–400, 1999. [5] Z. Moldovan and H. Y. Aboul-Enein, “A sensitive spectrophotometric method for determination of diosmin using sodium nitroprusside as a chromogenic reagent,” Instrumentation Science and Technology, vol. 39, no. 2, pp. 135–148, 2011. [6] L. A. Pavun, J. M. D. Markovic, P. T. Durdevic et al., “Development and validation of a fluorometric method for the determination of hesperidin in human plasma and pharmaceutical forms,” Journal of the Serbian Chemical Society, vol. 77, no. 11, pp. 1625–1640, 2012. [7] A. M. El-Shafae and M. M. El-Domiaty, “Improved LC methods for the determination of diosmin and/or hesperidin in plant extracts and pharmaceutical formulations,” Journal of Pharmaceutical and Biomedical Analysis, vol. 26, no. 4, pp. 539–545, 2001. [8] M. A. Campanero, M. Escolar, G. Perez, E. Garcia-Quetglas, B. Sadaba, and J. R. Azanza, “Simultaneous determination of
[13]
[14]
diosmin and diosmetin in human plasma by ion trap liquid chromatography-atmospheric pressure chemical ionization tandem mass spectrometry: application to a clinical pharmacokinetic study,” Journal of Pharmaceutical and Biomedical Analysis, vol. 51, no. 4, pp. 875–881, 2010. I. Saeidi, M. R. Hadjmohammadi, M. Peyrovi et al., “HPLC determination of hesperidin, diosmin and eriocitrin in Iranian lime juice using polyamide as an adsorbent for solid phase extraction,” Journal of Pharmaceutical and Biomedical Analysis, vol. 56, no. 2, pp. 419–422, 2011. L. S. Mazzaferro and J. D. Breccia, “Quantification of hesperidin in citrus-based foods using a fungal diglycosidase,” Food Chemistry, vol. 134, no. 4, pp. 2338–2344, 2012. G. Chen, L. Zhang, J. Zhao, and J. Ye, “Determination of hesperidin and synephrine in Pericarpium Citri Reticulatae by capillary electrophoresis with electrochemical detection,” Analytical and Bioanalytical Chemistry, vol. 373, no. 3, pp. 169– 173, 2002. S. A. Mir, A. A. Ahangar, and A. S. Bhat, “A new, simple colorimetric method for assaying diosmin, and flavonoids in daflon tablets and orange peel extracts,” International Journal of PharmTech Research, vol. 5, no. 2, pp. 341–348. Z. Janeczko, U. Hubicka, J. Krzek, and I. Podolak, “Qualitative and quantitative analysis of diosmin in tablets by thin-layer chromatography with densitometric UV detection,” Journal of Planar Chromatography: Modern TLC, vol. 16, no. 5, pp. 377– 380, 2003. M. S. El-Shahawi, A. S. Bashammakh, and T. El-Mogy, “Determination of trace levels of diosmin in a pharmaceutical preparation by adsorptive stripping voltammetry at a glassy carbon electrode,” Analytical Sciences, vol. 22, no. 10, pp. 1351–1354, 2006.
International Journal of
Medicinal Chemistry Hindawi Publishing Corporation http://www.hindawi.com
Volume 2014
Photoenergy International Journal of
Organic Chemistry International Hindawi Publishing Corporation http://www.hindawi.com
Volume 2014
Hindawi Publishing Corporation http://www.hindawi.com
Volume 2014
International Journal of
Analytical Chemistry Hindawi Publishing Corporation http://www.hindawi.com
Volume 2014
Advances in
Physical Chemistry Hindawi Publishing Corporation http://www.hindawi.com
Volume 2014
International Journal of
Carbohydrate Chemistry Hindawi Publishing Corporation http://www.hindawi.com
Journal of
Quantum Chemistry Hindawi Publishing Corporation http://www.hindawi.com
Volume 2014
Volume 2014
Submit your manuscripts at http://www.hindawi.com Journal of
The Scientific World Journal Hindawi Publishing Corporation http://www.hindawi.com
Journal of
International Journal of
Inorganic Chemistry Volume 2014
Journal of
Theoretical Chemistry
Hindawi Publishing Corporation http://www.hindawi.com
Hindawi Publishing Corporation http://www.hindawi.com
Volume 2014
Spectroscopy Hindawi Publishing Corporation http://www.hindawi.com
Analytical Methods in Chemistry
Volume 2014
Hindawi Publishing Corporation http://www.hindawi.com
Volume 2014
Chromatography Research International Hindawi Publishing Corporation http://www.hindawi.com
Volume 2014
International Journal of
Electrochemistry Hindawi Publishing Corporation http://www.hindawi.com
Volume 2014
Journal of
Hindawi Publishing Corporation http://www.hindawi.com
Volume 2014
Journal of
Catalysts Hindawi Publishing Corporation http://www.hindawi.com
Journal of
Applied Chemistry
Hindawi Publishing Corporation http://www.hindawi.com
Bioinorganic Chemistry and Applications Hindawi Publishing Corporation http://www.hindawi.com
Volume 2014
International Journal of
Chemistry Volume 2014
Volume 2014
Spectroscopy Volume 2014
Hindawi Publishing Corporation http://www.hindawi.com
Volume 2014