Journal of Applied Pharmaceutical Science Vol. 5 (01), pp. 094-098, January, 2015 Available online at http://www.japsonline.com DOI: 10.7324/JAPS.2015.50117 ISSN 2231-3354
Development and Validation of RP-HPLC Method for the Simultaneous Determination of Trimethoprim, Sulfadimidine Sodium and Tylosin Tartrate in injectable solution formulation Mashhour Ghanem1, Saleh Abu-Lafi2* 1 2
Pharmacare Pharmaceutical Company, P.O. Box 677, Ramallah, Palestine. Faculty of Pharmacy, Al-Quds University, P.O. Box 20002, Abu-Dies, Palestine.
ARTICLE INFO
ABSTRACT
Article history: Received on: 25/11/2014 Revised on: 14/12/2014 Accepted on: 26/12/2014 Available online: 30/01/2015
A simple, robust and reliable reversed phase HPLC method was developed and validated for the simultaneous determination of Trimethoprim (TMP), Sulfadimidine sodium (SDMS) and Tylosin tartrate (TYT) in Nuroprim® injectable solution formulation. The desired separation was achieved on XBridge C18 column (150 4.6 mm i.d., 5m) at room temperature. The optimized mobile phase consisted of a binary solvent mixture of acetonitrile and aqueous triethylamine (TEA) solution adjusted to pH 5.7 by acetic acid. The mobile phase flow rate was fixed at 1.0 ml/min and the analytes were monitored at 287 nm using photodiode array detector. The effects of the chromatographic conditions on peaks capacity factor, USP tailing factor, column efficiency and resolution were systematically optimized. The method was validated as per International Conference of Harmonization (ICH) and United States Pharmacopeia (USP) guidelines and found to be adequate for the routine quantitative determination of TMP, SDMS and TYT in commercially available Nuroprim® injectable solution dosage form.
Key words: Tylosin Tartrate, Sulfadimidine sodium, Trimethoprim, HPLC, Injectable solution
INTRODUCTION ®
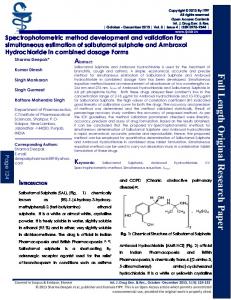
Nuroprim injectable solution is a veterinary drug that is manufactured in Palestine and combines three antibacterial substances, namely Trimethoprim (TMP), Sulfadimidine sodium (SDMS) and Tylosin tartrate (TYT). Figure 1 shows the chemical structure of the three active pharmaceutical ingredients (APIs). Pharmacopoeial methods are available for the determination of each API individually. For example, an antibiotic microbial bioassay of TYT is official in BP and USP (British Pharmacopeia, 2013; United States Pharmacopeia, 2013), but it is considered to be neither accurate nor precise. The assay of TMP is official in BP and USP (British Pharmacopeia, 2013; United States Pharmacopeia, 2013), whereas sulfadimidine is only official in BP (British Pharmacopeia, 2013). The combined simultaneous analysis of the three APIs has not been adopted in any official pharmacopoeias. However, there are several HPLC .
* Corresponding Author Faculty of Pharmacy, Al-Quds University, P.O. Box 20002, Abu-Dies, Palestine. Tel. and Fax: + 970-2-2790413 Email:
[email protected]
and LC-MS methods that have been reported for the quantitative determination of TMP, SDMS and TYT either alone or in combination (Solliec et al, 2014; Kotha et al, 2014; Ghanem et al, 2013). According to intensive literature survey, there is no HPLC method yet reported on the simultaneous determination of the three APIs in any pharmaceutical formulation. Therefore, there is a need to develop a new validated quality control HPLC method to simultaneously determine TMP, SDMS and TYT in Nuroprim® injectable solution. The proposed method is aimed to separate the three active drugs from each other and from the excipients. It was validated as per ICH/USP guidelines validation norms (ICH, 2005; United States Pharmacopeia, 2013). MATERIALS AND METHODS Materials and reagents USP reference standards of trimethoprim (TMP) (Lot: L0M053, Assay 99.9%) and tylosin tartrate (TYT) (Lot: F0D333, dried in vacuum at pressure not exceeding 5mm of mercury at 60°C for 3 hours before usage) were utilized. Reference standard of sulfadimidine sodium (SDMS) was purchased from Nanhai Beisha Pharmaceutical Co., ltd (China).
© 2015 Mashhour Ghanem and Saleh Abu-Lafi. This is an open access article distributed under the terms of the Creative Commons Attribution License NonCommercial-ShareAlikeUnported License (http://creativecommons.org/licenses/by-nc-sa/3.0/).
Ghanem and Abu-Lafi / Journal of Applied Pharmaceutical Science 5 (01); 2015: 094-098
Glacial acetic acid, triethylamine (TEA), and HPLC grade acetonitrile (ACN) solvent were purchased from Merck (Germany). High Purified water was prepared by using a Millipore Milli-Q plus water purification system. Nuroprim® injectable solution samples (labeled claim: each ml contains 25 mg TMP, 140 mg SDMS and 112.5 mg TYT), all the APIs and excipients used in the manufacturing combination were kindly supplied by Pharmacare pharmaceutical company, Palestine. HPLC system Chromatographic analysis was carried out using a Dionex-Ultimate 3000 HPLC system equipped with an LPG3400SD pump, WPS-3000SL autosampler, TCC-3000 column oven, and DAD-3000 UV–VIS diode array detector. Chromeleon Data system Software (Version 6.80, DU10A Build 2826, 171948) was used for all the data acquisitions and analysis. The search for suitable wavelength was achieved by using a double beam ultraviolet-visible spectrometer (PG Instruments, United Kingdom).
095
solution was filtered using 0.45 m PVDF membrane filter before analysis. The obtained final solution contained 125µg/ml TMP, 700µg/ml SDMS and 562.5µg/ml TYT. This solution was directly protected from light. RESULTS AND DISCUSSION Method development and Optimization The main aim of this study is to develop a simple and reliable method that could resolve TMP, SDMS and TYT from each other and from the placebo. Furthermore, the sought after method has to be used routinely in quality control laboratory at a relatively short time. To achieve this goal, several factors that play a significant role in RP-HPLC development including mobile phase percentage, pH and additives was tried. Firstly, overlaid ultraviolet absorption spectra of TMP, SDMS and TYT (0.05 mg/ml each) demonstrated that they shared a wavelength near to 287 nm, and therefore it was selected in the entire study. OMe
NH 2
Chromatographic conditions The HPLC experimental conditions were optimized on octadecyl silane C18 chemically bonded column (XBridge C18, 5µm, 4.6 x 150 mm). The aqueous mobile phase was prepared by diluting 2 ml of TEA in highly purified water up to 1000 ml, adjusted to pH 5.7 with glacial acetic acid, then filtered by using 0.45 m microporous PVDF filter and was degassed by sonication prior to use. The gradient program was started at 5% acetonitrile, 95% TEA solution at pH 5.7, and then it was increased linearly up to 35% acetonitrile during 10 minutes. The acetonitrile was then increased to 55% acetonitrile and stayed there for one minute. Then mobile phase receded back to its initial percentages in one minute and remained for extra 4 minutes to ensure equilibrium achievement. The optimized chromatographic conditions were 1ml/min for flow rate, 287 nm as optimal wavelength, 25oC column thermostated temperature and 20µl injection volume. Preparation of standard solution The standard solution for the three drugs was prepared by dissolving 25 mg TMP reference standard, 140 mg SDMS reference standard and 112.5 mg TYT reference standard in 170 ml of diluent (50% ACN), shaken by mechanical means for 5 minutes, sonicated for two minutes and then diluted up to 200 ml with the same diluent. This solution was filtered using 0.45 m PVDF membrane filter before analysis. The obtained final solution contained 125µg/ml TMP, 700µg/ml SDMS and 562.5 µG/ML TYT. This solution was directly protected from light. Preparation of sample solution One ml of commercial Nuroprim® injectable solution was transferred to 200 ml volumetric flask containing 80 ml of diluent, shaken by mechanical means for 5 minutes, sonicated for two minutes and then diluted up to 200 ml with the same diluent. This
OMe
N H 2N
N
+ O Na _ S N
H2N
OMe
N N
OMe
O
OMe
SDMS
TMP
O CH3
OMe HO H3C
H
OMe H C 3 O
H3C O
O H3C
O
O
OH
N CH3
H OH O
O
CH3
O CH3
OH
. HO
O OH
O
H
O CH3 OH
H3C
OH
OH TYT
Fig. 1: Chemical structure of TMP, SDMS and TYT active ingredients.
The initial mobile phase tested was an isocratic combination of water: acetonitrile (70:30; v/v) adjusted to pH of 5.5 using 0.1N acetic acid. The resulted TMP, SDMS and TYT peaks were very broad with a USP-tailing factor of more than 2.5. Therefore, different percentages of 0.05%, 0.1%, 0.15% and 0.2% triethylamine (TEA) additive adjusted at pH of 5.7 by 0.1N acetic acid were tested to reduce the drugs band broadening and to increase selectivity. It was noticed that using 0.2% TEA solution at pH 5.7 sharpens the peaks to which the tailing factor values were less than 1.3. Three different pH values of 0.2% TEA aqueous solution at 5.5, 5.7, and 5.9 were tested and the optimal pH was at 5.7. It was also noticed that increasing acetonitrile percentage decreased resolution between TMP and SDMS but improved TYT
096
Ghanem and Abu-Lafi / Journal of Applied Pharmaceutical Science 5 (01); 2015: 094-098
peak shape. Therefore, a gradient elution was used to better control acetonitrile content during the chromatographic run, which only lasted about 13 minutes. Figure 2 shows a typical chromatogram of the placebo used, which contains purified water, propylene glycol and glycerol. Figure 3 shows a typical HPLC chromatogram of freshly prepared mixture of TMP, SDMS and TYT using the abovementioned optimized conditions.
Fig. 2: Zoomed view of typical placebo chromatogram (water, propylene glycol and glycerol) using the optimized chromatographic conditions.
Fig. 3: Typical chromatogram of a standard mixture of 125µg/ml TMP (8.117 minutes), 700 µg/ml SDMS (9.760 minutes) and 562.5 µg/ml TYT (13.218 minutes) using the optimized chromatographic conditions.
Method Validation The ICH/USP guidelines were adopted in the entire study. Parameters such as system suitability, selectivity, sensitivity (LOD and LOQ), linearity, range, accuracy (recovery), precision (repeatability and intermediate precision) and robustness were all validated. System suitability The first step of the validation was testing the system suitability by injecting six successive replicates of the standard solutions and analyzing each active ingredient for its peak area, peak USP tailing factor, resolution, number of theoretical plates and capacity factor. The system suitability results for a combined solution of 125 µg/ml TMP, 700 µg/ml SDMS and 562.5 µg/ml TYT were calculated and revealed RSD % of less than 1.0% for all peaks areas. This method meets the accepted requirements as shown in table 1.
Table 1: Summary of the accepted system suitability requirements. Parameter % RSD Tailing factor (Tf) Resolution (Rs) Number of theoretical plates (N) Capacity factor (k')
TMP
SDMS
TYT
0.98 1.04 --8017 3.3
0.76 1.36 3.85 5869 4.2
0.87 1.24 8.47 18876 8.3
Accepted limit 2.0% 2.0 ≥2.0 ≥2000 ≥2.0
Selectivity (placebo interference) The same wavelength of 287 nm was used on placebo, standards and sample test solutions to assure the selectivity of the optimized method. The retention times of TMP, SDMS and TYT in sample solutions and in the standard solutions were identical. Figures 2 and 3 showed that there are no interferences at the retention time of TMP, SDMS and TYT due to placebo presence. Therefore, the proposed method is suitable for the quantification of the active ingredients in Nuroprim® Injectable solution. Sensitivity The sensitivity of the method was examined through measuring the limit of detection (LOD) and the limit of quantitation (LOQ) for TMP, SDMS and TYT at a signal-to-noise ratio of 3 and 10 respectively. This has been achieved by injecting a series of diluted solutions with known concentrations. LOD was found to be 1.25, 7.0 and 5.6 µg/ml for TMP, SDMS and TYT respectively. LOQ was found to be 4.2, 23.3 and 18.7 µg/ml for TMP, SDMS and TYT respectively with RSD (n=3) of 4.9%, 2.9% and 2.5% for TMP, SDMS and TYT respectively (accepted value is less than 10%). Linearity and range Calibration curves were constructed by injecting different amounts of TMP, SDMS and TYT in the range of 60% to 140% of the labeled amount (5 concentration levels and 3 replicates each) spiked to Nuroprim® placebo (water, propylene glycol and glycerol). The linearity in the range of 75-175 µg/ml, 420-980 µg/ml and 337.5-787.5 µg/ml for TMP, SDMS and TYT was investigated respectively. The regression lines demonstrated linearity in the tested range. The regression analysis confirmed that the deviation of the y-intercept from zero is not significant; and the regression lines were linear with R2 of 0.9999, 0.9997 and 0.9996 for TMP, SDMS and TYT respectively. The summary of the regression statistics is shown in table 2. Table 2: Regression statistics. Linearity Linearity range (R2 ) equation* (µg/ml) 75-175 0.9999 Y=431.1 X+320.1 TMP 420-980 0.9998 Y=346.72X+747.9 SDMS 337.5-787.5 0.9996 Y=178.84X+974.1 TYT *Y is the dependent variable and X is the independent variable Active ingredient
Yintercept (%) 0.59% 0.30% 0.96%
Accuracy (recovery) Accuracy was determined by the recovery study of known amounts of TMP, SDMS and TYT standards spiked to a
Ghanem and Abu-Lafi / Journal of Applied Pharmaceutical Science 5 (01); 2015: 094-098
placebo matrix for injectable dosage form. Different concentrations of the three active ingredients were spiked to placebo matrix and the recovery was measured. The accuracy as reflected from recovery data for the three active ingredients is listed in Table 3. The average recovery data of TMP ,SDMS and TYT showed results between 98.5% and 101.4% with % RSD of less than 1.3%, which are within the acceptable limit of (98.0 to 102.0% recovery and %RSD of not more than 2.0%). Table 3: Average recoveries, % RSD values at five concentration levels of spiking of TMP, SDMS and TYT. Active ingredient
TMP
SDMS
TYT
Amount added (level %) 75 µg /ml (60%) 100 µg /ml (80%) 125 µg /ml (100%) 150 µg /ml (120%) 175 µg /ml (140%) 420 µg/ml (60%) 560 µg/ml (80%) 700 µg/ml (100%) 840µg/ml (120%) 980 µg/ml (140%) 337.5 µg/ml (60%) 450µg/ml (80%) 562.5 µg/ml (100%) 675µg/ml (120%) 787.5 µg/ml (140%)
Avg. recovery (%) ± S.D (n=3) 98.8 ± 1.04 100.3 ± 1.28 99.8 ± 0.83 101.4 ± 0.96 98.8 ± 0.91 100.1 ± 0.87 100.8 ± 0.85 98.6 ± 0.89 99.3 ± 0.97 98.9 ± 0.84 98.9 ± 1.08 99.6 ± 0.95 99.2 ± 0.83 98.8 ± 1.02 98.5 ± 0.81
RSD (%) (n=3) 1.05 1.28 0.83 0.95 0.92 0.87 0.84 0.90 0.98 0.85 1.09 0.95 0.84 1.03 0.82
Precision Repeatability One laboratory analyst carried out the assay of TMP, SDMS and TYT on six determinations of homogeneous sample of Nuroprim® injectable solution at 100% level of the test concentration with the same analytical equipment at the same day. The intraday assay results and statistical evaluation for assay of the three active ingredients showed RSD % values of 1.32%, 0.97% and 1.16% for TMP, SDMS and TYT respectively, which are within the acceptable limit of 2.0%. Intermediate Precision (ruggedness) Two laboratory analysts carried out the assay of TMP, SDMS and TYT on twelve homogeneous samples of Nuroprim® injectable solution at 100% level of the final test concentration with two different analytical equipments on two different days. The interday assay results and statistical evaluation for assay of the three active ingredients reveals RSD % values of 1.58%, 1.14% and 1.28% for TMP, SDMS and TYT respectively, which are within the acceptable limit of 2.0%. The results of the assay of the three ingredients proved that the method is repeatable and rugged enough for day-to-day use. Robustness Deliberate variations were performed in critical experimental conditions of the RP-HPLC method to assess its robustness. The five variations enforced to the chromatographic
097
method are summarized in Table 4. The modifications include different mobile phase flow rates of 0.9, 1.0, and 1.1 ml/min and three different column temperatures in the range 15-30C. Different TEA percentages (in the range of ± 5 of the nominal value and the normal TEA %) was also investigated. Finally, three different pH values of the buffer at 5.5, 5.7, and 5.9 were tested along with different column batches. The RSD % values showed no significant change in the final assay results of each of the above two ingredients using the five variations (Table 4). Table 4: Robustness testing of the two active ingredients of TMP, SDMS and TYT Active Average assay% ± S.D Parameter ingredient (n=3) 0.9ml/min flow 99.4 ±0.83 1.0ml/min flow 98.9 ±0.76 1.1ml/min flow 99.8 ±0.94 95% TEA 100.1± 1.06 100% TEA 99.7±1.12 105% TEA 98.7 ±0.86 TMP 5.5 pH buffer 100.4 ±0.79 5.7 pH buffer 100.1 ±1.06 5.9 pH buffer 99.8 ±0.81 Temperature (15oC) 99.1 ±1.13 Temperature (25oC) 99.3 ±0.97 Temperature (30oC) 100.7 ±0.74 Different columns 99.4 ±1.46 0.9ml/min flow 100.6 ±1.02 1.0ml/min flow 99.4 ±1.15 1.1ml/min flow 99.3 ±0.86 95% TEA 99.2± 1.08 100% TEA 98.5±0.68 105% TEA 99.4 ±0.78 SDMS 5.5 pH buffer 100.7 ±0.93 5.7 pH buffer 101.2 ±0.84 5.9 pH buffer 99.5 ±0.88 Temperature (15oC) 98.6 ±0.73 Temperature (25oC) 98.9 ±0.92 Temperature (30oC) 100.8 ±1.09 Different columns 100.3 ±1.38 0.9ml/min flow 99.1 ± 0.93 1.0ml/min flow 100.2 ±1.06 1.1ml/min flow 99.3 ±0.74 95% TEA 99.8± 1.08 100% TEA 101.3±1.01 105% TEA 100.7 ±1.14 TYT 5.5 pH buffer 100.6 ±0.86 5.7 pH buffer 101.4 ±0.78 5.9 pH buffer 99.4 ±0.83 Temperature (15oC) 101.2±0.67 Temperature (25oC) 99.3 ±0.85 Temperature (30oC) 99.1 ±1.11 Different columns 99.7 ±1.26
Applicability of the method to marketed products: In the local market, there is only one injectable dosage form that is commercially available (Nuroprim® injectable solution). The validated method is applied to the commercially available package as shown in Table 5. This acceptable value indicated the applicability of the proposed method for the routine
098
Ghanem and Abu-Lafi / Journal of Applied Pharmaceutical Science 5 (01); 2015: 094-098
quality control of Nuroprim® Injectable solution without interference with the excipients. This was evidenced from the good actual results obtained as compared to the labeled claim percentages as well as the absence of any other peaks in the chromatogram of the injectable solution. Table 5: Result of market product (Nuroprim® injectable solution). Product Labeled claim TMP SDMS TYT Name (mg/ml) (mg/ml) (mg/ml) (mg/ml) Nuroprim® TMP (25), Injectable SDMS (140) 25.4 138.2 110.8 solution TYT (112.5)
CONCLUSION A novel validated RP-HPLC method was developed for the quantitative quality control determination of TMP, SDMS and TYT in nuroprim® injectable solution. It was evaluated for system suitability, selectivity, sensitivity, linearity, range, accuracy (recovery), precision (repeatability and intermediate precision) and robustness. The method proved to comply with ICH/USP guidelines and specifications. The method is rapid, accurate, precise and simple for the simultaneous determination of the combined TMP, SDMS and TYT in nuroprim® injectable solution in the presence of excipients.
REFERENCES British Pharmacopoeia (Veterinary). 1985. Her Majesty's Stationery Office. Ghanem M, Abu-Lafi S, Mohammad D. Validation of a stability indicating HPLC method for the simultaneous determination of sulfadiazine sodium, sulfathiazole, and sulfadimine sodium in water soluble powder dosage form. International journal of pharmacy and pharmaceutical sciences, 2013; 5 (3):547-554. Ghanem M, Abu-Lafi S. Development and Validation of a StabilityIndicating HPLC Method for the Simultaneous Determination of Sulfadiazine Sodium and Trimethoprim in Injectable Solution Formulation. Scientia Pharmaceutica, 2013; 81:167–182. Ghanem M, Abu-Lafi S. Validation of a Stability-Indicating RPHPLC Method for the Simultaneous Determination of Trimethoprim and Sulfadimethoxine Sodium in Oral Liquid Dosage Form. Scientia Pharmaceutica, 2013; 81:459–474. International Conference of Harmonization. 2005. ICH Q2 (R1), Validation of Analytical Procedures: Text and Methodology, Geneva, Switzerland. Kotha S, Sunitha N, Manoharbabu S. Development and validation of RP-HPLC method for the estimation of tylosin tartrate in pure and pharmaceutical formulation. International Journal of Pharmacy and Analytical Research. 2014; 3 (2):214-221. Solliec M, Massé D, Sauvé S. Analysis of trimethoprim, lincomycin, sulfadoxin and tylosin in swine manure using laser diode thermal desorption-atmospheric pressure chemical ionization-tandem massspectrometry. Talanta, 2014; 128-130. The United States Pharmacopoeia-National Formulary Monograph. 2013.
How to cite this article:
ACKNOWLEDGEMENT We would like to thanks Pharmacare pharmaceutical company (Palestine) for their continuous support.
Mashhour Ghanem, Saleh Abu-Lafi. Development and Validation of RP-HPLC Method for the Simultaneous Determination of Trimethoprim, Sulfadimidine Sodium and Tylosin Tartrate in injectable solution formulation. J App Pharm Sci, 2015; 5 (01): 094-098.