quantitative analysis of Diazepam and Impiramine hydrochloride in bulk drugs and formulations. Keywords: Diazepam, Impiramine hydrochloride, HPLC, Bulk ...
Pharmacophore 2016, Vol. 7 (1), 63-73
USA CODEN: PHARM7 ISSN 2229-5402
Pharmacophore (An International Research Journal)
Available online at http://www.pharmacophorejournal.com/
Original Research Paper DEVELOPMENT AND VALIDATION OF RP-HPLC METHOD FOR DIAZEPAM AND IMIPRAMINE IN BULK & PHARMACEUTICAL FORMULATIONS Vishal Srivastava*, Pradeep Kumar and R.K. Jat Institute of Pharmacy, Shri Jagdishprasad Jhabarmal Tibrewala University, Vidya Nagri, Jhunjhunu-333001, Rajasthan, India ABSTRACT A simple, specific, accurate and stability-indicating reversed phase high performance liquid chromatographic method was developed for the simultaneous determination of Diazepam and Impiramine hydrochloride, using a ODS C-18 (HIQ SIL 4.6mm x 25cm, 10µm) column and a mobile phase composed of Methanol: Phosphate buffer (75:25 v/v). The retention times of Diazepam and Impiramine hydrochloride were found to be 2.85 min and 5.24 min, respectively. Linearity was established for Diazepam and Impiramine hydrochloride in the range of 10-500 μg/ml and 2-12 μg/ml, respectively. The percentage recoveries of Diazepam and Impiramine hydrochloride were found to be in the range of 99.83-99.91% and 98.81-99.96%, respectively. Both the drugs were subjected to variance of conditions like flow rate, difference in mobile phase and concluded that this method can be successfully employed for simultaneous quantitative analysis of Diazepam and Impiramine hydrochloride in bulk drugs and formulations.
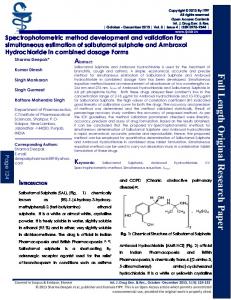
Keywords: Diazepam, Impiramine hydrochloride, HPLC, Bulk drugs, Pharmaceutical formulations. INTRODUCTION Diazepam [7-chloro-1-methyl-5-phenyl-2, 3dihydro-1H-1, 4-benzodiazepin-2-one] (figure 1), is a colorless to light yellow crystalline powder, almost odorless, freely soluble in water, methanol and solvent ether. Diazepam is anxiolytic, sedative & hypnotic, antiepeleptic and muscle relaxant. It is official in Indian Pharmacopoeia1,2,3,4, which recommends a titrimetric method for its analysis. Impiramine hydrochloride, [3-(5, 6-dihydrobenzo[b] [1]benzazepin-11-yl)-N,N-dimethylpropan-1-amine HCl] (figure 2) is a white to off-white powder, odorless, crystalline powder, sparingly soluble in water and freely soluble in methanol. It is commonly used as an antidepressant and urinary incontinancy agent. Imipramine is official in British Pharmacopoeia5,6, which recommends HPLC and HPTLC methods for its analysis. Diazepam and Imipramine combination suspension is combination in Indian market. This
paper reports validated RP- HPLC method for simultaneous determination of Diazepam and Imipramine HCl in pharmaceutical formulation. The proposed method is simple, accurate, reproducible and suitable for routine determination of Diazepam and Imipramine in combined dosage form. The method was validated in compliance with ICH guidelines.7 Literature survey reveals that many analytical methods are reported for determination of Diazepam and Imipramine.8-35
MATERIALS AND METHODS Cipla Pharmaceuticals (Maharashtra, India) supplied pure drug sample of Diazepam and Impiramine hydrochloride procured from Umedica Laboratories Ltd. (Gujarat, India) and were certified to contain 99.32% (w/w) and 99.16% (w/w) respectively, on dried basis. Methanol and water used were of HPLC grade
http://www.pharmacophorejournal.com
63
Vishal Srivastava et al. / Pharmacophore 2016, Vol. 7 (1), 63-73 and were purchased from Merck and CDH Preparation of Mobile Phase and Stock respectively. Potassium dihydrogen phosphate Solutions was purchased from Rankem. The suspension Seven hundred and fifty ml of methanol and 250 formulation (Parfil, Perron Pharmaceuticals, ml of water were mixed and pH of mixture was Karampura, New Delhi, India) containing 125 mg adjusted to 6.6 with potassium hydroxide. This of Diazepam and 5 mg of Imipramine per 5 ml mixture was sonicated for 10 min and filtered was procured from local market and used for through 0.22 μm membrane filter and used as analysis of marketed formulation. The liquid mobile phase. Standard stock solution (1000 chromatographic system was of Younglin µg/ml) of Diazepam was prepared by dissolving (ACME-9000), which consisted of following 50 mg of Diazepam in 50 ml mixture of methanol components: a gradient pump, variable and standard stock solution (100 µg/ml) of wavelength programmable UV/Vis detector, a Impiramine hydrochloride was prepared by manual injection facility with 20 μl fixed loop. In dissolving 5 mg of Impiramine hydrochloride in addition, an electronic balance (Ohaus N-13123), 50 ml mixture of methanol. The HPLC analysis a pH meter (Labtronics LT-11). was performed on reversed-phase highperformance liquid chromatographic system with Selection of Analytical Wavelength isocratic elution mode using a mobile phase of Stock solutions of both the drugs were prepared methanol: water (75:25, v/v) pH 6.6 adjusted with separately by dissolving 10 mg in 100 ml potassium hydroxide on ODS C-18 column volumetric flask. UV spectrum showed maximum (250×4.6 mm, 5μm particle size) with 1 ml/min absorbance at 248 nm for Diazepam and 252 nm flow rate at 250 nm using UV detector. for Impiramine hydrochloride. The UV overlain spectra of both Diazepam and Imipramine showed that both drugs absorbed appreciably at 250 nm, so this wavelength was selected as the detection wavelength (figure 3). Selection of Mobile Phase The standard solution containing mixture of Diazepam and Impiramine was run and different individual solvents as well as combination of solvent have been tried to get a good separation and stable peak. Each mobile phase was filtered through 0.45 μ membrane filter. Initially methanol and water in different ratios were tried. It was found that methanol: water (Phosphate buffer) in ratio of 75: 25, v/v gave acceptable retention time (tR = 2.853 min for Diazepam and tR = 5.246 for Imipramine) at the flow rate of 1 ml/min and drugs showed typical peak nature and peaks were symmetrical at 250 nm (figure 9). Tailing factor for both Diazepam and Impiramine hydrochloride peak was less than 2 and the resolution was satisfactory. Ultimately mobile phase consisting of methanol, water (Phosphate buffer) (75: 25 v/v) was selected for validation purpose.
Calibration Curves for Diazepam and Imipramine From Diazepam standard stock solution 10, 100, 200, 300, 400, 500µg/ml was prepared in mobile phase. Different concentrations of Impiramine hydrochloride 2, 4, 6, 8, 10, 12µg/ml were prepared in mobile phase. Procedure: The mobile phase was allowed to equilibrate with stationary phase until steady baseline was obtained. Then each dilution of both the drugs were injected and peak areas were recorded. Analysis of Marketed Formulations The peaks at tR 2.868 min for Diazepam and at 5.247 min for Impiramine hydrochloride were observed in the chromatogram of the drug samples extracted from formulation. The drug content was found to be 99.48 % ± 0.62 (% RSD of 0.62) for Diazepam and 99.70 % ± 0.11(% RSD of 0.11) for Impiramine hydrochloride respectively. Procedure for Analysis of Formulation Each 5 ml (Perron Pharmaceuticals) was labeled to contain 25 mg of Diazepam and 1.25 mg of Impiramine hydrochloride. Volume equivalent to
http://www.pharmacophorejournal.com
64
Vishal Srivastava et al. / Pharmacophore 2016, Vol. 7 (1), 63-73 10 mg of Diazepam and 0.5 mg of Impiramine one time to estimate the effect. Each factor hydrochloride was measured and transferred to selected was changed at three levels (-1, 0, +1) 100 ml volumetric flask and dissolved in mixture with respect to optimized parameters. Robustness of methanol and water (75: 25 v/v) to give of the method was done at the concentration level concentration 100 µg/ml of Diazepam and 5 40, 80, 120 μg/ml and 2, 4, 6 μg/ml of Diazepam µg/ml of Imipramine and then solution was and Imipramine respectively. filtered through 0.45 μ membrane filter. From this System suitability tests are an integral part of solution, further dilutions were made using chromatographic method which are used to verify solvent to get a final concentration of 80 µg/ml of reproducibility of the chromatographic system. Diazepam and 4 µg/ml of Impiramine HCL To ascertain its effectiveness, certain system respectively. Twenty micro liters of solution was suitability test parameters were checked by injected into HPLC system to obtain repetitively injecting the drug solution at the chromatogram for standard drug solution. concentration level 100 μg/ml and 4 μg/ml for Diazepam and Imipramine, respectively to check Method Validation the reproducibility of the system. The method of analysis was validated as per the recommendations of ICH7 and USP2 for the parameters like accuracy, linearity, precision and robustness. Diazepam showed good correlation coefficient in concentration range of 10-500 µg/ml (r2 = 0.997 ± 0.98) and Impiramine hydrochloride showed good correlation coefficient in concentration range of 2-12 µg/ml (r2 = 0.991 ± 0.96) for HPLC). For HPLC method the linearity of calibration graphs and adherence of the system to Beer’s law was validated by high value of correlation coefficient and the S.D. for intercept value was less than 1. The accuracy of the method was determined by calculating percentage recovery of Diazepam and Imipramine. For both the drugs, recovery studies were carried out by applying the method to drug sample to which known amount of Diazepam and Imipramine corresponding to 50, 100 and 150% of label claim had been added (standard addition method). At each levels of the amount six determinations were performed and the results obtained were compared. Intraday and interday precision study of Diazepam and Imipramine was carried out by estimating the corresponding responses 3 times on the same day and on 3 different days for the concentration of 40, 80, 120 μg/ml and 2, 4, 6 μg/ml of Diazepam and Imipramine respectively. For robustness evaluation of HPLC method a few parameters like flow rate, percentage of methanol in the mobile phase and pH of mobile phase were deliberately changed. One factor was changed at
RESULTS AND DISCUSSION
UV overlain spectra of both Diazepam and Imipramine showed that both drugs absorbed appreciably at 250 nm, so this wavelength was selected as the detection wavelength (figure 3). Details for selection of mobile phase are given in (table 1) and the chromatograms obtained are shown in (figure 4-9). The mobile phase consisting of Methanol: Phosphate buffer (75:25 v/v). The retention times of Diazepam and Impiramine hydrochloride were found to be 2.85 min and 5.24 min, respectively at 1ml/min flow rate was optimized which gave two sharp, wellresolved peaks. Tailing factor for both Diazepam and Impiramine hydrochloride peak was less than 2 and the resolution was satisfactory (figure 9). The calibration curve for Diazepam and Imipramine was found to be linear over the range of 10- 500 μg/ml and 2-12 μg/ml, respectively (figure 10-11). The data of regression analysis of the calibration curves is shown in (table 2-3). Experimental results of the amount of Diazepam and Impiramine hydrochloride in formulation, expressed as percentage of label claim were in good agreement with the label claims as stated in (table 4), thereby suggesting that there is no interference from any excipients, which are normally present in syrup. The proposed method was successfully applied to the determination of Diazepam and Imipramine in their combined suspension dosage form. The results for the combination were comparable with the http://www.pharmacophorejournal.com 65
Vishal Srivastava et al. / Pharmacophore 2016, Vol. 7 (1), 63-73 corresponding labeled amounts. The developed method was accurate, precise, and repeatable. The method was also found to be specific, since it was developed method was found to be simple, able to separate other excipients present in sensitive and selective for analysis of Diazepam suspension from the two drugs. The linearity was and Imipramine in combination without any evaluated by determining six standard working interference from the excipients. The method was solutions containing 10-500 µg/ml in triplicate for successfully used for determination of drugs in a Diazepam and 2-12 µg/ml for Impiramine pharmaceutical formulation. Assay results for hydrochloride (table 5). The recovery results were combined dosage form using proposed method in the limit as stated in (table 6-7). Inter and showed 99.65±0.40 % of Diazepam and intraday studies were also under limit, RSD was 99.14±0.21 % of Imipramine. The results below 2% as shown in (table 8). Results for indicated the suitability of the method to study robustness evaluation for both the drugs are presence of Diazepam and Imipramine under presented in (table 9). Insignificant differences in various conditions viz. pH changes, change in peak areas and less variability in retention times mobile phase and change in flow rate. were observed. ACKNOWLEDGEMENTS In the proposed study, RP-HPLC method was I thank to Suresh Kalawania (Drug Inspector) for developed for the simultaneous determination of providing gift sample of drugs from Sun Pharma Diazepam and Imipramine and validated as per Jammu Division. ICH guidelines. Statistical analysis proved that
Sr. No.
Mobile Phase Composition
Table 1: Selection of mobile phase Retention Time (min) Peak Area Diazepam
Imipramine
Diazepam
Imipramine
Remarks
1.
Methanol
3.1
--
28889.37
--
2.
Methanol: (50 : 50)
Water 2.9
--
28794.09
--
3.
Methanol: Phosphate 3.0 buffer (pH 6.6) (90:10)
3.4
21860.18
1530.43
4.
Methanol: Phosphate buffer (pH 6.6) (85:15)
3.1
20924.93
2728.74
5.
Methanol: Phosphate 2.8 buffer (pH 6.6) (80:20) Methanol: Phosphate 2.8 buffer (pH 6.6) (75:25)
3.5
23188.68
9127.94
Slight tailing in peak of Para & Imipramine.
5.2
23225.02
11689.06
Good resolution both peaks.
6.
2.2
http://www.pharmacophorejournal.com
No peak differentiation for both & Imipramine Asymmetry in peak of Diazepam Tailing in peak of Diazepam. Short peak of Imipramine Slight tailing in peak of Diazepam. Tailing and broadness in peak of Imipramine
of
66
Vishal Srivastava et al. / Pharmacophore 2016, Vol. 7 (1), 63-73 Table 2: Calibration table for standard Diazepam (n=3) Sr. No. 1 2 3 4 5 6
Conc. µg/ml 10 100 200 300 400 500
Area (μ AU) 11246.13 23225.02 35632.15 45542.42 61331.32 73753.83
Table 3: Calibration table for Impiramine hydrochloride (n= 3) Sr. No 1 2 3 4 5 6
Conc. µg/ml 2 4 6 8 10 12
Area (μ AU) 8246.45 11689.19 14632.87 17542.69 19331.52 23753.14
Table 4: Analysis of marketed formulation Sr. Conc. Area Conc. found % of labeled claim No. μg/ml (μ AU) μg/ml Diazepam Imipramine Diazepam Imipramine Diazepam Imipramine Diazepam Imipramine 1
80
4
23227
11686
79.59
3.98
99.54
99.75
2
80
4
23225
11689
79.34
3.98
98.99
99.50
3
80
4
23227
11685
80.23
3.99
100.3
99.75
4
80
4
23227
11686
79.97
3.99
99.78
99.75
5
80
4
23227
11689
79.89
3.99
98.95
99.75
Table 5: Linear regression data for calibration curve (n = 3) Parameters Diazepam Impiramine Hydrochloride Linearity Range (µg/ml) 10 – 500 2 - 12 2 r ± SD 0.997 ± 0.98 0.991 ± 0.96 Slope ± SD 9969 ± 0.85 2969 ± 0.97 Intercept ± SD 126.3 ± 0.87 5571 ± 0.93
Table 6: Statistical analysis for recovered Diazepam Level of % Recovery 50 100 150
% Mean Recovery*
Standard Deviation
% R. S. D.
Standard Error
Diazepam Imipramine Diazepam Imipramine Diazepam Imipramine Diazepam Imipramine 99.83 99.16 0.025 0.862 0.013 0.689 0.012 0.276 99.89 99.10 0.036 0.657 0.034 0.613 0.019 0.315 99.91 99.18 0.049 0.586 0.057 0.589 0.028 0.287
* Mean of three readings
http://www.pharmacophorejournal.com
67
Vishal Srivastava et al. / Pharmacophore 2016, Vol. 7 (1), 63-73 Table 7: Statistical analysis for recovered Impiramine HCl Level of % recovery
% Mean Recovery*
Standard Deviation
% R. S. D.
Standard Error
Diazepam Imipramine Diazepam Imipramine Diazepam Imipramine Diazepam Imipramine 99.68 99.81 0.159 0.069 0.162 0.076 0.248 0.043 99.43 99.96 0.257 0.198 0.259 0.195 0.196 0.092 99.89 99.89 0.583 0.073 0.589 0.709 0.381 0.654
50 100 150
* Mean of three readings
Table 8: Observation of inter and intraday precision Drug Diazepam
Impiramine HCL
Factorb
Inter day precision Found ± S.D. (µg/ml), R.S.D. (%)
Intraday Precision Found ± S.D. (µg/ml), R.S.D. (%)
10 100 200 300 400 500 2 4 6 8 10 12
10.2 + 0.1 ± 0.97 99.93+ 0.1 ± 0.29 199.6+ 0.4 ± 0.23 299.9+ 0.1 ± 0.97 400.3+ 0.7 ± 0.17 500.5+ 0.1 ± 0.21 2.12+ 0.1 ± 0.09 3.99+ 0.05 ± 1.31 6.12+ 0.15 ± 2.56 8.11+ 0.1 ± 1.32 10.1+ 0.1 ± 0.98 12.2+ 0.2 ± 1.52
10.5 + 0.1 ± 0.99 100.0+ 0.15 ± 0.14 199.9+ 0.15 ± 0.07 300.1+ 0.18 ± 0.92 400.2+ 0.25 ± 0.06 500.1+ 0.11 ± 0.021 2.10 + 0.1 ± 4.14 4.11 + 0.05 ± 1.28 6.21 + 0.1 ± 0.26 8.14 + 0.05 ± 0.51 10.3 + 0.15 ± 1.44 12.2 + 0.3 ± 0.14
Level
0.90 -1 1.00 0 1.10 +1 Mean ± S.D (n = 3) 89 -1 90 0 91 +1 Mean ± S.D (n = 3) 6.5 6.6 6.7 Mean ± S.D (n = 3)
Range (μg/ ml)
Table 9: Robustness testing HPLC method Chromatographic Changes Diazepama trc kd Te trc A: Flow rate(ml/min) 3.11 2.16 1.40 5.42 2.84 2.17 1.39 5.10 2.23 2.12 1.26 4.83 2.83 ± 0.05 2.15 ± 0.10 1.39±0.34 5.41±0.44 B: %age of methanol in the mobile phase (v/v) 3.01 2.19 1.45 5.50 2.85 2.15 1.42 5.10 2.81 2.18 1.46 4.86 2.85±0.07 2.16±0.10 1.44±0.14 5.10±0.46 C: Change in pH 2.85 2.19 1.43 5.27 2.87 2.14 1.38 5.23 2.89 2.11 1.41 5.26 2.87±0.09 2.14±0.90 1.40±0.57 5.25±0.45 http://www.pharmacophorejournal.com
Imipraminea kd
Te
2.14 2.11 2.09 2.14±0.39
1.93 1.87 1.86 1.87±0.45
2.20 2.16 2.17 2.21±0.56
1.97 1.96 1.94 1.95±0.07
2.15 2.10 2.13 2.12±0.89
1.98 1.89 1.92 1.93±0.76 68
Vishal Srivastava et al. / Pharmacophore 2016, Vol. 7 (1), 63-73 A
average of three concentrations 40, 80, 120 µg/ml for Diazepam and 2, 4, 6 µg/ml for Impiramine hydrochloride respectively three factors were slightly changed at three levels (1, 0, -1); each time a factor was changed from level (0) the other factors remained at level (±1). retention time. Dcapacity factor.etailing factor.
B C
Table 10: System suitability test results Sr. No.
Rt. (min)
Peak area
Tailing factor (T)
Diazepam
Imipramine
Diazepam
Imipramine
Diazepam
1 2 3 4 5
3.10 2.23 2.85 2.83 2.87
5.50 4.86 5.10 5.40 4.85
23225.02 23227.16 23231.54 23222.82 23223.79
11689.19 11687.80 11685.23 11690.06 11692.31
1.42 1.38 1.26 1.43 1.45
Mean ±S.D C.V.
2.776 0.324 0.23
5.142 0.300 0.65
23226.07 11688.92 3.463 2.633 0.096 0.0410
Resolution (R)
Imipramine
2.06 1.91 1.89 1.97 1.89 Statistics 1.944 0.072 0.005
1.388 0.075 1.893
Diazepam
2.02 1.98 2.00 1.97 1.99 1.992 0.019 0.349
H3C 9
1
7381.49 7.86 0.241
Selectivity (α)
Imipramine Diazepam Imipramine
3132.45 3128.16 3139.77 3135.48 3130.62 3133.29 4.49 0.397
2.15 2.18 2.12 2.15 2.14 2.148 0.021 0.326
2.10 2.09 2.08 2.11 2.13 2.102 0.019 0.080
2.01 2.02 2.03 2.01 2.02 2.018 0.009 0.413
2 3
7
Cl
7381.40 7387.35 7378.73 7390.03 7369.98
Capacity factor (K’)
O
N
8
No. of Theoretical plates (N)
5
N 4
6
7-chloro-1-methyl-5-phenyl-1,3-dihydro-2H-1,4-benzodiazepin-2-one
Figure 1: Structure of Diazepam
10
9
11 1
8
2 7
N 6
5
4
3
N
CH3 CH3
3-(10,11-dihydro-5H-dibenzo[b,f]azepin-5-yl)-N,N-dimethylpropan-1-amine
Figure 2: Structure of Imipramine hydrochloride
Figure 3: UV-Absorption overlay spectra of Diazepam & Impiramine HCl http://www.pharmacophorejournal.com
69
Vishal Srivastava et al. / Pharmacophore 2016, Vol. 7 (1), 63-73
Figure 4: Chromatogram obtained by using mobile phase- Methanol
Figure 5: Chromatogram obtained by using mobile phase- Methanol: Water (50: 50)
Figure 6: Chromatogram obtained by using mobile phase- Methanol: Phosphate buffer (pH 6.6) (90 : 10)
http://www.pharmacophorejournal.com
70
Vishal Srivastava et al. / Pharmacophore 2016, Vol. 7 (1), 63-73
Figure 7: Chromatogram obtained by using mobile phase -Methanol: Phosphate buffer (pH 6.6) (85: 15)
Figure 8: Chromatogram obtained by using mobile phase - Methanol: Phosphate buffer (pH 6.6) (80: 20)
Figure 9: Chromatogram obtained by using mobile phase- Methanol: Phosphate buffer (pH 6.6) (75: 25) http://www.pharmacophorejournal.com
71
Vishal Srivastava et al. / Pharmacophore 2016, Vol. 7 (1), 63-73
Figure 10: Calibration curve of Diazepam
Figure 11: Calibration curve of Impiramine hydrochloride
REFERENCES 1. Reynolds, JEF (1996), “Martindale the Extra Pharmacopoeia”, 31st Ed., Pharmaceutical Press, London, 27-28. 2. (2000), “The United State th Pharmacopoeia”, 24 Revision, U.S. Pharmacopoeial Convention, Rockville, 17-39. 3. (1998), “British Pharmacopoeia CD”,, 2nd Version, The Stationary Office Ltd., Norwich. 4. (1996), “European Pharmacopoeia”, 3rd Ed., Convention on the elaboration of a European Pharmacopoeia, Strasbourg, 748749. 5. Floury, K; “Analytical Profile of Drug Substances”, Elseveir Publication, New York, Vol. 5, 55.
6. Rang ,HP; Dale, MM and Ritter, JM (1999), “Pharmacology”, Churchill Livingstone, New York, 542. 7. FDA (1997),“International Conference on Harmonization: Guideline on the Validation of Analytical Procedures: Methodology, Availability, Notice,” Federal Register 62 (96), 27463–27467. 8. Choukesy, MK; Khandpur, A and Tyagi, NK (2006), “Indian Drugs”,43 (3),216220. 9. Hauula, GV; Bhanu, R and Bhoir, IC(2001), “Indian Drugs”, 38 (4), 203207. 10. Ravisankar, S; Vasudevan, M and Najan, MJ (1997), “Indian Drugs”, (11), 663665.
http://www.pharmacophorejournal.com
72
Vishal Srivastava et al. / Pharmacophore 2016, Vol. 7 (1), 63-73 11. Raman, B and Patil, D (2000), “Indian 24. Momin, MY and Yeole, PG (2006), “IJPS” Drugs”, 37(9), 437-440 68(3), 387-389. 12. Shenoy, KRP; Krishnamurthy, KS and 25. Ola, A; Saleh, A; Hassan, Y and Badawy, Sumatheendra, KS (2006), “Indian AM(2009), “Drug Dev. Ind. Pharm.”, Drugs”,(10), 486-488. 35(1), 19-25. 13. Bhatia, MS; Kashedikar, SG and 26. Rukhadze, MD; Aleksishvili, MM and Chaturvedi, SC (1997), “Indian Drugs”, Tsgareli, SK(2000), “J. Pharm. Chem., 34(3)149-153. 34(9), 497-498. 14. Vasudevan, M; Ravisankar, S and 27. Pistos, C and Stewart, JT (2003), “Biomed. Ravibabu, T (2000), “Indian Drugs”, 37(8) Chromatogra.”, 17(7), 465-470. 386-389. 28. Liang, G; Wang, I and Zhong, P (2005), “J. 15. Erram, SV; Doshi, SM and Kulkarni, VM Pharm. Anal., 25(9), 1129-1131. (1992), “Indian J. of Pharm. Sci.”, 54 (1), 29. Devani, MB; Suhagia, BN and Shah, SA 122-124. (1999), “Ind. J. Pharm. Sci.”, 61(2), 11016. Aditya, N; Arora, RK and Tiwari, M 112. (2006), “Indian Jouranl of 30. Basavaiah, K and Drishnamurthy, G Pharmaceutical Sciences, 68 (3), 370-373. (1997), “Ind. J. Pharm. Sci.”, 59 (6), 17. Gangwal, S and Trivedi, P (1998), “Indian 327-330. Drugs”, 35 (5), 291-295. 31. Zhang, QI and Xiancheng, Z (2005), “Int. 18. Patil, D and Raman, B(2001), “Indian J. Pharm., 302(1), 10-17. Drugs, 38 (1), 36-39. 32. Kubacak, P (2005), “Methods and 19. Goicoecha, G and Lpez, MJJ(1995), “Liq. Findings”, 27(80), 529. Chrom. And Rel. Tech.”, 18 (16), 325733. Mouayed, Q Al-Abachi (1990), “J. Anal. 3268. Chem.,337(4), 408-411. 20. Milenkova, K and Dimitrovska, A(2003), 34. Muhammad, JS and Jamil A(2005), “Bull. Chem. And Tech. Mace.”, 22(1), “Talanta”, 67(5), 869-872. 33-37. 35. (2009),“Simultaneous estimation of 21. Meyer, J and Karst, U (2001), Diazepam and Impiramine hydrochloride in “Chromatograph”, 54,3-4. pharmaceutical formulations by a RP22. Altun, ML (2002), “Turk, J. Chem.”, HPLC method”, International Journal of (26),521-528. ChemTech Research., 1 (3), 667- 670. 23. Erk, N and Ozkan, Y (2001), “J. Pharm and Biomed. Anal.”, 24(3), 469-475. Correspondence Author: Vishal Srivastava Institute of Pharmacy, Shri Jagdishprasad Jhabarmal Tibrewala University, Vidya Nagri, Jhunjhunu-333001, Rajasthan, India
Cite This Article: Vishal, Srivastava; Pradeep, Kumar and RK, Jat (2016), “Development and validation of RP-HPLC method for diazepam and imipramine in bulk & pharmaceutical formulations”, Pharmacophore, Vol. 7 (1), 63-73
http://www.pharmacophorejournal.com
73