Available online www.jocpr.com. Journal of ... KVSR Siddhartha College of Pharmaceutical Sciences, Vijayawada, AP, INDIA ... Buchi N. Nalluri et al. J. Chem. Pharm. Res., 2013, 5(1):329-335 ..... Research J Pharm Tech 2008, 1, 513-515.
Available online www.jocpr.com
Journal of Chemical and Pharmaceutical Research, 2013, 5(1):329-335
Research Article
ISSN : 0975-7384 CODEN(USA) : JCPRC5
Development and validation of RP-HPLC-PDA method for the simultaneous estimation of hydrochlorothiazide, amlodipine besylate and olmesartan medoxomil in bulk and pharmaceutical dosage forms Buchi N. Nalluri*, D. Venkateswara Naik, B. Sunandana and K. Sushmitha KVSR Siddhartha College of Pharmaceutical Sciences, Vijayawada, AP, INDIA _____________________________________________________________________________________________ ABSTRACT A simple, specific and LC-MS compatible reverse phase liquid chromatographic method was developed for the simultaneous estimation of Hydrochlorothiazide (HCT), Amlodipine Besylate (AML) and Olmesartan Medoxomil (OLM) in bulk and pharmaceutical dosage forms. A C18 reverse phase column (Develosil- RP Aqueous) of 250 x 4.6mm dimensions and 5µm particle size with mobile phase containing 0.1%v/v formic acid: acetonitrile (60:40% v/v) was used at isocratic mode and eluents were monitored at 254nm. The retention times of HCT, AML and OLM were 3.91, 5.50, and 7.62min respectively and showed a good linearity in the concentration range of 5-25µg/mL with a correlation coefficient (R) of 0.9998, 0.9996 and 0.9994 respectively. The percentage assays were found to be 99.20, 97.20, and 98.90 respectively for HCT, AML and OLM. The proposed method was validated as per ICH guidelines and successfully applied to the simultaneous estimation of HCT, AML, and OLM in tablet formulations. Keywords: Hydrochlorothiazide, Amlodipine Besylate, Olmesartan Medoxomil, Simultaneous estimation, PDA detection _____________________________________________________________________________________________ INTRODUCTION HCT, chemically is 6‐chloro‐3,4‐dihydro‐7‐sulfamoyl‐2H‐1,2,4 ‐benzothia‐diazine‐1,1–dioxide, is a thiazide diuretic. It increases sodium and chloride excretion in distilled convoluted tubule. AML, chemically is 3-ethyl-5methyl (±)-2-[(2-aminoethoxy) methyl]-4-(2-chlorophenyl)-1,4-dihydro-6-methyl-3,5-pyridine dicarboxylate, monobenzene sulphonate and is a long-acting calcium channel blocker. OLM chemically is 2,3-dihydroxy-2-butenyl -(1-hydroxy-1-methylethyl)-2-propyl-1-[P-(O-1H-tetrazole-5-ylphenyl)benzyl]-imidazole-5carboxylate, cyclic 2,3carbonate, is a angiotensin II receptor blocker. OLM is a prodrug of Olmesartan and is rapidly and completely deesterified to the Olmesartan during absorption from the gastrointestinal tract1. Most of the hypertensive patients require more than one therapeutic agent in order to achieve adequate blood pressure control. Combination of HCT with AML and OLM shows better therapeutic efficacy than the individual administration. Literature survey revealed various HPLC [2-6], LC-MS[7-9], HPTLC [10-12] and simultaneous UV spectrophotometric methods[13,14] have been reported for the estimation of AML either alone or in combination with other drugs like HCT and Valsartan etc. Several HPLC methods were also reported for the estimation of OLM either alone or in combination with HCT or AML in different dosage forms and degradation product analysis by HPLC[15]. However, there were no validated HPLC-UV/PDA methods published so far for the simultaneous estimation of HCT, AML and OLM, except two reports, one of which used HCT as an internal standard for the simultaneous estimation of AML and OLM and the other is the stability-indicating UPLC method which used nonvolatile buffers in mobile phase which is not LC-MS compatible [16,17]. Hence, the present investigation was aimed at developing a fully validated HPLC-PDA method for the simultaneous estimation of HCT, AML and OLM in bulk and tablet dosage forms with a mobile phase that is compatible with LC-MS analysis.
329
Buchi N. Nalluri et al
J. Chem. Pharm. Res., 2013, 5(1):329-335 ______________________________________________________________________________ EXPERIMENTAL SECTION Reagents and Chemicals HCT, AML, and OLM were gift samples from Darwin Laboratories, Vijayawada, India. Acetonitrile, water and formic acid were purchased from E. Merck, Mumbai, India. All the solvents and reagents were of HPLC grade. TRIOLMEZEST (Batch # ML0441, manufactured by Sun Pharma Industries Ltd, Mumbai) is a tablet containing HCT (12.5 mg), AML (5 mg) and OLM (20 mg) were commercially purchased. Equipment A Shimadzu Prominence HPLC system provided with DGU-20A3 degasser, LC-20AD binary pumps, SIL-20AHT auto sampler, and SPD-M20A PDA detector was used. Data acquisition was carried out using LC solutions software. The chromatographic analysis was performed on Develosil- RP aqueous column (250 × 4.6mm, 5µ). Chromatographic Conditions Mobile phase consisting of 0.1% v/v formic acid: acetonitrile (60:40% v/v) was used in isocratic mode and the mobile phase was filtered through nylon disc filter of 0.45µm (Millipore) and sonicated for 3 min before use. The flow rate was 1 mL/min and the injection volume was 10µL. PDA detection was performed at 254 nm and the separation was achieved at ambient temperature. Preparation of stock and standard solutions The stock solutions of HCT, AML and OLM of strength 1mg/mL were prepared by dissolving 10 mg of each drug separately in acetonitrile in a 10mL volumetric flask. Appropriate volumes of these stock solutions were then further diluted with acetonitrile to get the required concentrations of standard solutions at a concentration range of 525µg/mL. Validation of HPLC method Linearity A linear relationship was evaluated across the range of the analytical procedure with a minimum of five concentrations. The linearity of HCT, AML and OLM responses were determined by preparing and injecting standard solutions in the range of 5 - 25µg/mL. Linearity is evaluated by a plot of peak areas as a function of analyte concentration, and the test results were evaluated by appropriate statistical methods where by slope, intercept, and regression (R2) correlation coefficients (R) were calculated and the data was given in Table1 and shown in Figure 3. Precision Precision was measured in terms of repeatability of application and measurement. Repeatability of standard application was carried out using six replicates of the same standard concentration (15µg/mL). The data was given in Table 2 and shown in Figure 4. Accuracy Accuracy (recovery) of the method was tested by spiking 80, 100 and 120% of HCT, AML, OLM at 15µg/mL test concentration. The accuracy of the analytical method was established in triplicate across its range according to the assay procedure and the data was given in Table 3. Robustness Robustness was determined by analyzing same sample at normal operating conditions and also by changing some operating analytical conditions such as mobile phase composition, flow rate. The data was given in Tables 4 & 5. Specificity Specificity studies were carried for both pure drug and drug product by comparing the 3D plots with diluent and placebo. Peak purity tests were also carried out to show that the analyte chromatographic peak is not attributable to more than one component as the impurities are not available by analyzing the purity index data. The data was shown in Figures 5 & 6. LOD and LOQ LOD and LOQ were determined by calibration curve method. Standard solutions of HCT, AML and OLM were prepared in the range of 5-25µg/mL and injected (10µL) in triplicate. Peak areas of three drugs were plotted against concentration. LOD and LOQ were calculated by using following equations: LOD = (3.3 ×σ)/m; LOQ= (10.0×σ)/m (Where, σ is the standard deviation of the responses and m is mean of the slopes of the calibration curves).
330
Buchi N. Nalluri et al
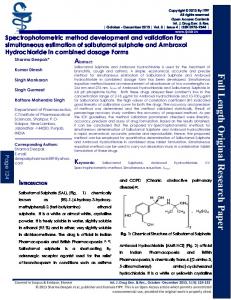
J. Chem. Pharm. Res., 2013, 5(1):329-335 ______________________________________________________________________________ Assay Twenty tablets were weighed individually and finely powdered and 200mg of powder blend equivalent to 12.5mg of HCT, 5mg of AML and 20 mg of OLM was accurately weighed and transferred to a 100 mL volumetric flask and 50 mL of diluent was added to the same. The flask was sonicated for 5 min and volume was made up to the mark with diluent. The above solution was filtered using Nylon disposable syringe filter (13 mm, 0.45 µm) and the 1mL of the filtrate was diluted to 10 mL with diluent in 10 mL volumetric flask. The amount present in the each tablet was calculated by comparing the area of standard HCT, AML and OLM with that of the tablet sample. RESULTS AND DISCUSSION The present investigation was carried out with a view to develop a RP- HPLC-PDA method for the simultaneous estimation of HCT, AML and OLM in bulk and tablet dosage forms which is LC-MS compatible. In the present investigation, different analytical columns with various stationary phases and mobile phase combinations were tested to develop a highly sensitive LC method, for the analysis of HCT, AML and OLM in bulk and formulations. Initial trials were carried with Phenomenex C18 column (250 x 4.6 mm) using methanol and water as mobile phase in different ratios. HCT was eluted but not the other two drugs within 15 min run time at 1 mL/min flow rate. Similar results were obtained with acetonitrile as organic modifier. In other trial, water was replaced with 0.01% formic acid and acetonitrile was used as organic modifier (30:70% v/v) and over lapping of peaks was observed. Further trials were continued with increasing the acid strength in the buffer to 0.1% v/v and still over lapping of the peaks were observed. The Phenomenex C18 column was replaced with Develosil-RP Aqueous column (250 x 4.6 mm) in order to achieve proper resolution of the 3 peaks. Finally with a mobile phase composition of 0.1% v/v formic acid: acetonitrile (60:40% v/v) at a flow rate of 1 mL/min a good resolution between peaks and desired elution time was obtained. The retention times were 3.91, 5.50, 7.62 min respectively for HCT, AML and OLM. For quantitative analytical purpose wavelength was set at 254 nm, which provided better reproducibility with minimum or no interference. The method was validated as per ICH guidelines18. A sample chromatogram of all three standards along with diluent was shown in Figure 1. The peak purity indices were also found to be greater than 0.9999 and this indicating peak purity of the all three drug samples used in the analysis and shown in Figure 2 along with UV spectra. uV 35000 30000
OLM
25000
HCT
20000 15000
AML 10000
B A
5000 0 0.0
1.0
2.0
3.0
4.0
5.0
6.0
7.0
8.0
9.0
m in
Fig. 1: Overlay of the diluent (A) and HCT, AML and OLM (B) chromatograms
A linear relationship was evaluated across a concentration range (5-25 µg/mL) of the analytical procedure in triplicate. The range of concentrations was selected based on 80-120% of the test concentration (for assay). Peak area and concentrations were subjected to least square regression analysis to calculate regression equation. The correlation coefficient (R2) was found to be 0.999 and showed good linearity (Figure 3). The data of the calibration curve was given in Table 1. Precision studies were carried out in terms of repeatability. Six determinations of 100% concentration at 15µg/mL level was evaluated and the data was given in Table 2 and shown in Figure 4. The % RSD was found to be below 2 and fulfilled the ICH guidelines criteria.
331
Buchi N. Nalluri et al
J. Chem. Pharm. Res., 2013, 5(1):329-335 ______________________________________________________________________________ mAU
0.8 Purity Curve Zero Line
Peak
mAU
0.9 Purity Curve Zero Line
mAU Peak 55.0
0.60 Purity Curve Zero Line
Peak 110
250.0
0.55
0.8
0.7
50.0 100
225.0
0.50 45.0
0.7
0.6
90
0.45
80
0.40
70
0.35
60
0.30
30.0
50
0.25
25.0
40
0.20
20.0
30
0.15
200.0 0.6
40.0
175.0
0.5
0.5
35.0
150.0 0.4 125.0 0.3 100.0 0.2
75.0 50.0
0.1
25.0
0.4
0.3
0.2
20
0.1
10
5.0 0.00
0
0.0 3.80
3.85
3.90
3.95
4.00
4.05
4.10
4.15
4.20
7.3
7.4
7.5
7.6
7.7
7.8
7.9
8.0
8.1
8.2
8.3
8.4
8.5
0.0
8.6 m in
min
5.3
mAU 3.9 1/ 1.00
mAU 5.64/ 1.00
HCT
175
5.4
5.5
5.6
5.7
5.8
5.9
6.0
6.1
min
mAU 8.05/ 1.00
90
225
200
10.0 0.05
0.0
0.0 3.75
15.0
0.10
140
AML
80
OLM
130 120 110
70
100
150 60
90
238
271
125
80
50
40
70
223
100
60 50
75
30 361
40
50
20
30
10
0
0
0
373
10 289
296
242
317
20
25
-10
200.0
225.0
250.0
275.0
300.0
325.0
350.0
375.0
200.0
nm
225.0
250.0
275.0
300.0
325.0
350.0
375.0
nm
200.0
225.0
250.0
275.0
300.0
325.0
350.0
375.0
nm
Fig. 2: Peak purity index and UV spectrums for HCT, AML and OLM Table 1: Linearity data for HCT, AML and OLM Mean Peak area with ± SD (%RSD) HCT AML OLM 37177± 94.75 (0.25) 24969 ± 183.14 (0.73) 58978± 323.14 (055) 125870 ± 592.55 (0.46) 89989 ± 106.06 (0.11) 236042 ± 2081.72(0.88) 219774 ± 2036.46 (0.93) 162924 ± 562.14 (0.34) 381206 ± 795.49(0.20) 311742 ± 586.89 (0.18) 235023 ± 1414.21(0.6) 551123±707.85(0.128) 395738 ± 2682.70 (0.67) 298139± 2148.19 (0.72) 697322 ± 493.41(0.21) y = 18060x - 52838 y = 13827x - 45203 y = 31835x – 92597 0.9997 0.9993 0.9992 0.9998 0.9996 0.9994
Concentration (µg/ml) 5 10 15 20 25 Regression equation R2 R uV 40000
uV 60000
HCT
30000
AML
OLM
50000 40000 30000
20000 20000 10000
10000
0
0
0.0
1.0
2.0
3.0
4.0
5.0
6.0
7.0
8.0
9.0
10.0
11.0
Fig. 3: Overlay chromatograms of the HCT, AML and OLM standard solutions ranging from 5-25 µg/mL Table 2: Precision data of three drugs
Injections Injection 1 Injection 2 Injection 3 Injection 4 Injection 5 Average SD %RSD
HCT 256200 257121 256501 256105 257010 256582 457.29 0.17
Peak area AML 236061 234787 235877 234128 233508 234872 1100.56 0.46
332
OLM 588028 593074 571148 591012 586082 585868 2737.59 0.46
m in
Buchi N. Nalluri et al
J. Chem. Pharm. Res., 2013, 5(1):329-335 ______________________________________________________________________________ uV
HCT
40000
OLM 30000
AML
20000
10000
0 0.0
1.0
2.0
3.0
4.0
5.0
6.0
7.0
8.0
9.0
10.0
11.0
m in
Fig. 4: Overlay of the chromatograms obtained in precision analysis
Accuracy of the method was examined by performing recovery studies by standard addition method for drug product as the exact components are unknown and for drug substance the analyte peak is evaluated by 3D plot of the chromatogram in order to confirm the existence of one component at 3.91, 5.50, 7.62 min elution time of HCT, AML and OLM. As the impurities are not available, the recovery of the added standard to the drug product sample was calculated and it was found to be 98.55-101.53%, 98.52-99.68% and 98.41-101.93% respectively for HCT, AML and OLM. These results indicate a good accuracy of the method to that of the label claim. The obtained recovery results were given in Table 3. Table 3: Mean % recovery data for HCT, AML and OLM (n=3) % Level of addition 80% 100% 120%
HCT (%RSD) 99.29 ± 0.86(0.87) 98.68 ± 0.60(0.60) 99.78.53 ± 0.99(0.99)
AML (%RSD) 99.64 ± 0.54(0.55) 100.18 ± 0.98(0.97) 99.95 ± 0.89(0.89)
OLM (%RSD) 100.79 ± 0.50(0.50) 99.93 ± 0.51(0.51) 99.76 ± 0.81(0.81)
As part of the robustness, deliberate changes in the flow rate, mobile phase composition, was made to evaluate the impact on the method. Retention times were significantly changed with flow rate and mobile phase compositions, however % assay values were within limits and these results indicated minor changes in the flow rate and mobile phase composition didn’t affect the assay results. The results were presented in Tables 4, 5. Table 4: Robustness data relating to flow rate change Drug HCT
AML
OLM
Flow rate (mL/min) 0.8 1.0 1.2 0.8 1.0 1.2 0.8 1.0 1.2
Retention time (min) 4.18 3.91 3.15 5.80 5.50 4.91 7.82 7.62 7.05
Theoretical Plate # 41587 43278 45792 42060 46921 47753 57786 58744 59717
Tailing factor (Tf) 1.4 1.4 1.4 1.5 1.7 1.7 1.4 1.4 1.4
% Assay 98.79 99.15 99.01 98.98 99.23 99.53 99.89 100.51 99.01
Table 5: Robustness data relating to mobile phase composition change Drug HCT
AML
OLM
Change in mobile phase composition 2% less Actual 2% more 2% less Actual 2% more 2% less Actual 2% more
Retention time (min) 3.76 3.91 3.18 5.70 5.50 4.91 7.82 7.62 7.05
Theoretical Plate # 41587 43278 45792 42060 46921 47753 57786 58744 59717
Tailing factor (Tf) 1.44 1.45 1.40 1.5 1.7 1.7 1.4 1.4 1.4
% Assay 99.13 99.81 98.97 98.58 99.01 98.89 99.53 99.85 100.13
LOD and LOQ were calculated from the average slope and standard deviation from the calibration curve. LOD for HCT, AML and OLM was found to be 0.218, 0.165, 0.096µg/mL respectively. LOQ for HCT, AML and OLM was
333
Buchi N. Nalluri et al
J. Chem. Pharm. Res., 2013, 5(1):329-335 ______________________________________________________________________________ found to be 0.662, 0.500, 0.292µg/mL respectively. These results indicate that the method is sensitive enough to carry out the routine simultaneous analysis of HCT, AML and OLM in dosage forms. System suitability studies were carried out by injecting a 5µg/mL standard of HCT, AML and OLM at different injection volumes. The data was given in Table 6. With increment of injection volumes, the %RSD for tailing factor and theoretical plate number was less than 2% and is satisfactory. Table 6: System suitability test parameters Parameters Retention Time (min) Tailing Factor Theoretical Plate #
HCT (%RSD) 3.91 (0.83) 1.44 (0.90) 45706 (0.36)
AML (%RSD) 5.50 (0.64) 1.46 (0.83) 42724 (0.93)
OLM (%RSD) 7.62 (0.73) 1.40 (0.31) 59380 (0.69)
uV 45000 40000 35000 30000 25000 20000 15000 10000 5000 0 0.0
1.0
2.0
3.0
4.0
5.0
6.0
7.0
8.0
9.0
10.0
11.0
12.0
m in
Fig. 5: Overlaid chromatograms of Placebo (--), Diluent (--), Sample (--), Standard (--) chromatograms
1
2
3
4
Fig. 6: 3D plots of diluent (1), Placebo (2), Sample (3), Standard (4) chromatograms.
334
Buchi N. Nalluri et al
J. Chem. Pharm. Res., 2013, 5(1):329-335 ______________________________________________________________________________ The specificity of the method was established by spiking diluent solution of commonly used excipients. From the overlaid chromatograms of placebo, sample, standard chromatograms (Figure 5) and from the 3D plots it was evident that no peaks observed within the retention time of three drugs and also over the range of 10.0min (Figure 6). The amount present in the each tablet (TRIOLMEZEST) was calculated by comparing the area of standard with that of tablet sample. The percentage content of HCT, AML and OLM in the tablet formulations was found to be 99.20± 0.2, 97.20± 0.05, and 98.90± 0.12% respectively. The assay was found to be within the limits and the present LC conditions can be used for the assay of HCT, AML and OLM in different commercially available formulations. CONCLUSION The proposed RP-HPLC - PDA method was validated fully as per International Conference on Harmonisation (ICH) Guidelines, and found to be applicable for routine quality control analysis for the estimation of HCT, AML and OLM in combination using isocratic mode of elution. The results of linearity, precision, accuracy and specificity, proved to be within the limits. The method provides selective quantification of HCT, AML and OLM without interference from diluent and placebo. The proposed method is highly sensitive, reproducible, reliable, rapid and specific and also has the unique advantage of LC conditions being compatible with MS detection. Therefore, this method can be employed in quality control to estimate the amount of HCT, AML and OLM in bulk and in combined dosage forms. Acknowledgements The authors are thankful to Darwin Laboratories, Vijayawada for providing gift samples of drugs and also to the Siddhartha Academy of General and Technical Education, Vijayawada, for providing necessary facilities to carry out this research work. REFERENCES [1] N Daryl; B Evans; S Bridget; H Marlon. Drug Forecast 2002, 27, 12. [2] A Zarghi; SM Forotan; A Shafaati; A Khoddam. Farmaco 2005, 60, 789-792. [3] C Mustafa; K Sinan; A Sacide. Hacettepe University Journal of the Faculty of Pharmacy 2008, 28, 15-30. [4] B Chaudhari, NM Patel. J Pharm Research 2006, 5, 141-144. [5] RP Priyanka; U Sachin; PN Dhabale; KB Burade. Int J Chem Tech Res 2009, 1, 20-24. [6] O Sagirli; AO Nall; SE Toker; D Sensoy. Chromatogr 2007, 66, 213–218. [7] Y Feng; L Zhang; Z Shen; F Pan; Z Zhang. J Chromatogr Sci 2002, 40, 49-53. [8] J Bhatt, S Singh, G Subbaiah, B Shah, S Kambli. J Biomed Chromatogram 2007, 21, 169-175. [9] L Dongyang; H Pei; M Nobuko; L Xiaoming; L Li; J Ji. J Chromatogr B 2007, 856: 190-197. [10] AR Chabukswar; C Swati; SV Kumdhar; J Vinayak. Arch Apll Sci Res 2010, 2, 94-100. [11] NJ Shah; BN Suhagia; RR Shah; NM Patel. Indian J Pharm Sci 2007, 69, 834–836. [12] NR Vekariya; GF Patel; HS Bhatt; HS Patel; RB Dholakiya; GK Ramani. Int J Pharm Tech Res 2009, 1, 16441649. [13] RB Kakde; VH Kotak; AG Barsagade; NK Chaudhary; DL Kale. Research J Pharm Tech 2008, 1, 513-515. [14] M Pradeep; S Kamal; G Alka. Int J Pharm Pharm Sci 2009, 1, 55-61. [15] M Tomonori; K Hidetoshi; F Naoto; O Michinobu; K Takao; K Fumiyo. J Pharm Biomed Anal 2008, 47, 553– 559. [16] VP Rane; KR Patil; Sangshetti JN. Int J Pharm Pharm Sci 2011, 3, 146-149. [17] R Kishore Kumar; C Kameswara; G Madhusudan; K Mukkanti; American Journal of Analytical Chemistry 2012, 3, 50-55. [18] International Conference on Harmonization Q2 (R1). Validation of Analytical Procedures: Text and Methodology. IFPMA, Geneva, Switzerland, 2005.
335