Bull. Chem. Soc. Ethiop. 2016, 30(1), 13-25. Printed in Ethiopia DOI: http://dx.doi.org/10.4314/bcse.v30i1.2
ISSN 1011-3924 2016 Chemical Society of Ethiopia
DEVELOPMENT AND VALIDATION OF STABILITY-INDICATING METHODS FOR DETERMINATION OF TORSEMIDE Hala E. Zaazaa*, Samah S. Abbas, Hebatallah M. Essam and Mohammed G. El-Bardicy Analytical Chemistry Department, Faculty of Pharmacy-Cairo University, Kasr El-Aini Street, 11562 Cairo, Egypt (Received March 6, 2014; revised August 22, 2015) ABSTRACT. Four sensitive and precise methods for determination of torsemide in presence of its degradation product and in pharmaceutical formulation were developed and validated. Method A is the second derivative spectrophotometry at 262.4 nm with mean percentage recoveries 100.06±0.75. Method B is first derivative of the ratio spectra spectrophotometry, at 232.4, 244.6 nm and at the total peak amplitude from the maximum at 232.4 nm to the minimum at 244.6 nm (1DD232.4+244.6nm). Method C is a TLC-densitometric one, for torsemide separation using acetone : chloroform : ethyl acetate (4:4:2 v/v) as a developing system. Method D is HPLC one, it provides complete separation of torsemide from its degradation product on C8 column with UV detection at 287 nm and recovery 99.98±0.76. The proposed methods have been successfully applied to the analysis of torsemide in pharmaceutical formulations without interference from other additives and the results were statistically compared with the official method. KEY WORDS: HPLC, Stability-indicating, Spectrophotometry, TLC-densitometry, Torsemide
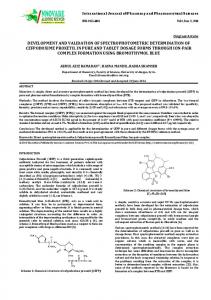
INTRODUCTION Torsemide (TOR) is sulfonylurea derivative, used as a loop diuretic, for treatment of oedema associated with heart failure, renal and hepatic disorders, also used in the treatment of hypertension, either alone or with other antihypertensives [1]. Chemically it is N-[{(1methylethyl)amino}carbonyl]-4-[(3-methylphenyl)amino]-3-pyridinesulfonamide (Figure 1) [2]. TOR was determined by pharmacopoeial and non-pharmacopoeial methods where it is assayed in the British pharmacopoeia via non-aqueous titration [3], while assayed in the USP pharmacopoeia by HPLC method [4]. The non-pharmacopoeial methods used for determination of TOR include HPLC [5-9], LC/MS [10-13], GC/MS [14, 15], spectrophotometry [16-20] and TLC-densitometry [21]. Stability-indicating HPTLC [22], HPLC [23] and ion selective electrode [24] methods have been recently reported for analysis of TOR but no spectrophotometric studies were performed. Although UV spectrophotometry is a key method in pharmaceutical analysis and is used for both identification and quantification of raw material and pharmaceutical products, no method was described for the stability assessment of torsemide. Spectrophotometry has the merits of rapidness, simplicity and validity. Therefore, it was thought worthwhile to develop and validate spectrophotometric methods for determination of TOR in the presence of its degradation product in powdered forms, laboratory prepared mixtures and in pharmaceutical formulation. While, chromatography is probably the most powerful and versatile tool for the combined separation and quantitative analysis of many individual components present in a mixture in one single procedure, in contrast to the previously described chromatographic methods for TOR analysis, this work develops and validates a stability indicating methods for the determination of TOR; namely, TLC-densitometric and HPLC methods. According to the literatures in hands, all the described methods lake the inherent stability studies, exceptionally two chromatographic recently published methods [22-24]. The HPLC method depends on sophisticated gradient elution program due to less suitable chromatographic conditions [23], while, the TLC method offers a narrow quantitative range for pharmaceutical __________ *Corresponding author. E-mail:
[email protected]
14
Hala E. Zaazaa et al.
application [22]. Therefore, the suggested methodology in this work aims to improve such drawbacks and produce more advantageous procedures to be used in routine analysis of torsemide in quality control labs. EXPERIMENTAL Instruments A double beam UV-visible spectrophotometer (SHIMADZU, Japan), model UV-1601 PC with matched 1cm quartz cells, connected to an IBM-compatible PC and an HP-600 inkjet printer. Bundled, UV-PC personal spectroscopy software version 3.7, was used to process the absorption and the derivative spectra. The spectral band width was 2 nm with wavelengthscanning speed of 2800 nm min−1. A liquid chromatograph consisted of an isocratic pump (Agilent Model G 1310 A), an ultraviolet variable wavelength detector (Model G 1314 A, Agilent 1100 Series), a Rheodyne injector (Model 7725 I, Rohnert Park, CA, USA) equipped with 20 µL injector loop, Agilent (USA); stationary phase; a C8 (22 cm × 4.6 mm i.d. 5 µm particle size) analytical column, Alltech (USA). Mobile phase; acetonitrile: K phosphate buffer pH 4 (2:3 v/v). The mobile phase was degassed for 15 min in an ultrasonic bath prior to use. UV-detection was done at 289 nm. The samples were injected by the aid of a 20 µL Agilent ® analytical syringe. CamagLinomat 5 autosampler (Switzerland), Camagmicrosyringe (100 µL), Camag TLC scanner 3 S/N 130319 with win CATS software, the following requirements are taken into consideration (Slit dimensions: 5 mm × 0.2 mm, scanning speed: 20 mm/s, spraying rate: 10 µL s−1 and data resolution: 100 µm/step). Precoated TLC-plates, silica gel 60 F 254 (20 cm × 20 cm, 0.25 mm), E. Merck (Darmstadt-Germany), pH-meter, Digital pH/MV/TEMP/ATC meter, Jenco Model- 5005 (USA) were used. Samples Pure standard. Standard TOR was kindly supplied by Multi-Apex Pharma, Badr City, Cairo, Egypt. It was assayed for its purity according to a pharmacopeial HPLC method [4] and found to contain 99.77%. Pharmaceutical formulation. Examide® tablets, manufactured by Multi-Apex Pharma, Badr City, Cairo, Egypt. Batch No. 1230311 and 1240311, labelled to contain 10 and 20 mg of torsemide/tablet, respectively. Degraded sample. Accelerated acid-degradation was performed by dissolving 50 mg of pure TOR powder in 50 mL of 2 M hydrochloric acid then the solution was refluxed for 4 h. Complete degradation was followed by thin layer chromatography using acetone : chloroform : ethyl acetate (40:40:20 v/v) as developing system. Then, the degradation product (deg 1) was precipitated at pH 6.8±0.2 by 2 M sodium hydroxide, washed and re-crystallized from methanol. Chemicals and reagents All chemicals used throughout this work were of analytical grade, and the solvents were of spectroscopic grade. Concentrated HCl, 2 M aqueous solution, acetone, ethyl acetate, NaOH, 2 M aqueous solution and chloroform were obtained from El-Nasr Pharmaceutical Chemicals Co. (Abu-Zabaal, Cairo, Egypt). Methanol; spectroscopic grade; S.D. Fine-Chem Limited, (Mumbai, India); acetonitrile, HPLC-grade; E. Merck (Darmstadt, Germany), potassium dihydrogen phosphate and ortho-phosphoric acid (85%); El-Nasr Pharmaceutical Chemicals Co. (Abu-Zabaal, Cairo, Egypt) were used. A 0.01 M phosphate buffer was prepared by dissolving specified weight of KH2PO4 in 1000 mL bi-distilled water, adjusting to pH 4 by ophosphoric acid if necessary. Bull. Chem. Soc. Ethiop. 2016, 30(1)
Development and validation of stability-indicating methods for determination of torsemide 15
Standard solutions Stock standard solutions of torsemide 0.1 and 1 mg mL−1 in methanol and 0.1 mg mL-1 in themobile phase for 2D, 1DD, TLC and HPLC methods, respectively were prepared. Stock standard solutions of the acid degradation products derived from complete degradation of TOR standard solution (0.1 and 1 mg mL−1 in methanol and 0.1 mg mL-1 in themobile phase for 2D, 1 DD, TLC and HPLC methods, respectively, were prepared. All stock standard solutions were freshly prepared on the day of analysis and stored in refrigerator to be used within 24 h. Spectrophotometric methods Construction of calibration curve for 2D spectrophotometric method. In to a series of 10-mL volumetric flasks, accurate aliquots equivalent to 50-300 µg of TOR were transferred from its standard solution (0.1 mg mL-1) and diluted to volume with methanol. The 2D spectrum of each TOR concentration was obtained using scaling factor = 100 and ∆λ = 8 nm. The peak amplitude was measured at 262.4 nm, plotted against the corresponding concentration of TOR and then the regression equation was computed. Construction of calibration curve for 1DD spectrophotometric method. Aliquots of TOR stock solution (0.1 mg mL−1) equivalent to 40–280 µg were accurately transferred into a series of 10 mL volumetric flasks then diluted to volume using methanol. 1DD curves were recorded at Δλ = 4 nm and scaling factor = 10. The absorption spectra of this solution were divided by the absorption spectrum of 30 µg mL−1 of the acid degradation product (as a divisor), and then the obtained ratio spectra were differentiated with respect to wavelength. The peak amplitudes at 232.4, 244.6 nm and 1DD (232.4+244.6) were recorded. Calibration graphs were constructed relating the peak amplitudes of (1DD) to the corresponding concentrations. The regression equations were then computed for the studied drug at the specified wavelengths and used for determination of unknown samples containing TOR. Chromatographic methods Construction of calibration curve for TLC-densitometric method. Aliquots equivalent to 0.25– 2.50 mg from TOR standard solution (1 mg mL-1) were transferred separately, into a series of 10 mL measuring flasks. The contents of each flask were made up to volume with methanol, then 20 µL of each solution were applied in the form of bands on a TLC plate using a CamagLinomat IV applicator. The bands were applied 14 mm apart from each other and 15 mm from the bottom edge of the plate with a length of 4 mm. Linear ascending development was performed in a chromatographic tank previously saturated with acetone : chloroform : ethyl acetate (4:4:2 v/v) for 1 h at room temperature. The developed plates were air-dried, then scanned at 287 nm using deuterium lamp. A calibration curve relating the optical density of each band to the corresponding concentration of TOR was constructed. The regression equation was then computed for the studied drug and used for determination of unknown samples containing it. Construction of calibration curve for HPLC method. In to a series of 10 mL volumetric flasks, aliquots equivalent to 20–60 µg were accurately transferred from the standard stock solution of TOR (0.1 mg mL−1 in the mobile phase), then the volume was completed with the mobile phase and the samples were chromatographed using the following chromatographic conditions: stationary phase; a C8 (150 mm × 4.6 mm i.d.), 5 µm analytical column and mobile phase consisted of phosphate buffer pH 4 : acetonitrile (3:2, v/v). The mobile phase was filtered through a 0.45 µm millipore membrane filter and was degassed for about 15 min in an ultrasonic Bull. Chem. Soc. Ethiop. 2016, 30(1)
Hala E. Zaazaa et al.
16
bath prior to use, flow rate; 1 mL min−1 [isocratically at ambient temperature (25 0C)], with UVdetection at 287 nm. The samples were filtered also through a 0.45 µm membrane filter, and were injected by the aid of a 20 µL Agilent®analytical syringe. To reach good equilibrium, the analysis was usually performed after passing 50–60 mL of the mobile phase, just for conditioning and pre-washing of the stationary phase. The relative peak area ratios (drug/external standard), using the concentration 8 µg mL−1 of TOR as external standard were plotted versus the corresponding concentrations of TOR to get the calibration graph and to compute the corresponding regression equation. Analysis of laboratory prepared mixtures containing different ratios of Trosemide and its acid degradation product using the suggested methods Aliquots of intact and degraded drug were mixed to prepare different mixtures containing 5– 90% of the degradation product, and proceed as mentioned under each method. The concentrations were calculated from the corresponding regression equations. Assay of pharmaceutical formulations (Examide®tablets) Ten tablets of Examide® 10 and 20 mg were weighed, powdered finely and mixed thoroughly. Amount of the powder equivalent to 10 mg of TOR were accurately weighed into two separate 100 mL volumetric flasks, 25 mL of appropriate solvent was added, sonicated for 10 min, then 25 mL solvent was added and sonicated for 10 min to affect complete dissolution of TOR. Volumes were made up with appropriate solvent to get 0.1 mg mL−1 stock solutions, then filtered. The procedure detailed under linearity and construction of calibration curve for each method was followed. When carrying out the standard addition technique, the powder content of the tablets and that of pure TOR were mixed well together before proceeding in the above mentioned procedures. RESULTS AND DISCUSSION The ICH [25] guidelines Q1A (R2) on ″Stability Testing of New Drug Substances″ suggest that the testing of those features which are susceptible to change during storage and are likely to influence quality, safety and efficacy must be done by validated stability indicating methods. Stress testing was carried out on TOR, it was subjected to stress acid, alkaline conditions (1 M HCl and NaOH for 5 h, 2 M HCl and NaOH for 4 h) and oxidative condition (3% H2O2 for 2 h, 4 h and 6 h). The compound was found to be liable to degradation under acidic, basic and oxidative condition. Among these stress conditions, the acidic condition was the mildest one that results the higher degradation yield as shown in Table 1, so this study was conducted using the acidic degradation conditions. Table 1. Forced degradation study results. Condition Acidic (2 M HCl) Alkaline (2 M NaOH) Oxidative ( 3% H2O2)
Time (h) 4 5 3
TOR degradation % 99.85 78.43 63.77
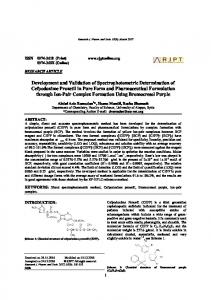
The degradation process under the previously mentioned conditions was followed using TLC and HPLC. It was found that all conditions produce the same two degradation products, Figure 1, which confirms the already existing analytical data [22-24]; one of them (deg 1) is among the impurities stated in USP and BP (impurity B), while the other degradation product is an aliphatic fragment with no considerable UV absorption (deg 2) [24]. Therefore, it is essential to develop analytical procedure which will serve a reliable, accurate and sensitive stability Bull. Chem. Soc. Ethiop. 2016, 30(1)
Development and validation of stability-indicating methods for determination of torsemide 17
indicating method for the determination of TOR in presence of its degradation products (related impurity B). (a)
(b)
(c)
Figure 1. Chromatograms showing separation of torsemide degradation product under: (a) acidic conditions, (b) oxidative conditions and (c) alkaline conditions. Second derivative spectrophotometric method Few spectrophotometric methods were described for determination of TOR in bulk powder or in pharmaceutical formulations with co-formulated drugs using either direct spectrophotometric or colorimetric procedures, but none of these methods was validated for the stability indicating determination of TOR in presence of its degradation product.
Bull. Chem. Soc. Ethiop. 2016, 30(1)
18
Hala E. Zaazaa et al.
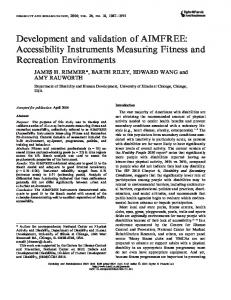
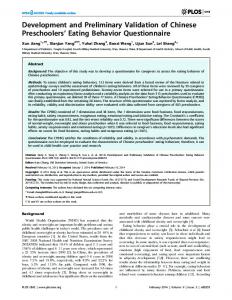
Torsemide and its degradation product are absorbing substances in the UV region with severe overlapping, as shown in Figure 2, which interferes with the direct determination of TOR. Different solvents were tried to resolve their overlapping, e.g. methanol, ethanol, 0.1 M NaOH and 0.1 M HCl, but no satisfactory resolution was obtained. On the basis of derivative theory, first derivative was done but poor resolution was found. Zero absorption of the degradation product corresponding to peak of TOR was obtained by applying second derivative technique using methanol as a solvent that permits selective determination of pure TOR at 262.4 nm in the presence of its degradation product as in Figure 3. The instrumental parameters affecting the 2D spectrum were tested, namely ∆λinterval and scaling factor. The best results were obtained upon using 8 nm as ∆λ interval and scaling factor 100 to enlarge the signal of TOR to facilitate its measurement and to diminish error in reading the signal. Linear relationship was obtained in the range of 5-30 µg mL-1 between the peak amplitudes at 262.4 nm and the corresponding drug concentrations from which the regression equation was computed and found to be: P.A. = 0.0241C + 0.0562, r = 0.9998, where P.A. is the peak amplitude at 262.4 nm, C is the concentration of TOR in µg mL-1 and r is the correlation coefficient. First derivative of ratio spectra spectrophotometric method
Peak amplitude
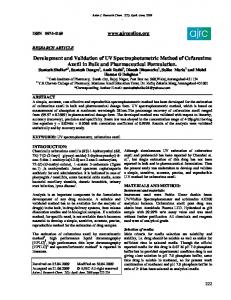
Upon application of 1DD method, TOR can be determined selectively at 232.4, 244.6 nm and at the total peak amplitude from the maximum at 232.4 nm to the minimum at 244.6 nm (1DD232.4+244.6nm) as shown in Figure 4. Selection of the divisor concentration is very important, so several spectra with different concentrations of the degradation product were tried (10, 20 and 30 µg mL-1) as divisor. The best results in terms of sensitivity and selectivity followed using the spectrum of 30 µg mL-1 degradation product as a divisor. Different smoothing and scaling factors were tested, where a smoothing factor Δλ = 4 and a scaling factor = 10 produced optimum signal to noise ratio.
Figure 2. Zero order spectra of 10 µg mL-1 of torsemide ( products (- - - -) using methanol as a blank.
) and 20 µg mL-1 of its degradation
The relationships between the peak amplitudes of TOR at 232.4, 244.6 nm and at the total peak amplitudes from the maximum at 232.4 nm to the minimum at 244.6 nm (1DD 232.4+244.6nm) in the range of 4-28 µg mL-1 and its corresponding concentrations was calculated then regression equations were computed and found to be: P.A1 = 0.0499C - 0.0409, r = 0.9999 at Bull. Chem. Soc. Ethiop. 2016, 30(1)
Development and validation of stability-indicating methods for determination of torsemide 19
232.4 nm; P.A2 = 0.0558C + 0.0809, r = 0.9999 at 244.6 nm; P.A3 = 0.1034C + 0.0636, r = 0.9999 at 232.4 + 244.6 nm; where P.A1, P.A2 and P.A3 are the peak amplitudes at 232.4, 244.6 nm and from 232.4 to 244.6 nm, respectively, C is the concentration of TOR in µg mL-1 and r is the correlation coefficient.
Peak amplitude
262.4 nm
Peak amplitude
Figure 3. Second derivative spectra of torsemide (5–30 µg mL-1) (──) and 20 and 30 µg mL-1 of its degradation products (- - - -) using methanol as a blank.
Figure 4. Ratio spectra of 10 µg mL-1 of torsemide (──) and 20 µg mL-1 of its degradation products (- - - -) using the spectrum of 30 µg mL-1 degradation products as a divisor and methanol as a blank. TLC-densitomeric method TLC-densitometry is an important technique in the field of separation and analysis of closely related compounds. In contrast to the TLC method which was described for determination of TOR in presence of its degradation products at λ 297 nm [22], this method offers better results regarding accuracy, precision and system suitability through scanning the chromatogram at the maximum peak of TOR (λmax 287 nm). Also, it allows quantification of wide concentration Bull. Chem. Soc. Ethiop. 2016, 30(1)
Hala E. Zaazaa et al.
20
Detector response
range of TOR. The use of acetone : chloroform : ethyl acetate (4:4:2 by volume) as a developing system offers good separation by the difference in the retardation factor (Rf) values of TOR (Rf = 0.20) and its degradation product (deg 1) (Rf = 0.58), as shown in Figure 5, while the degradation product (deg 2) has no UV absorption at λ > 206 nm. It was necessary to test different variables that affect the separation to obtain the optimum chromatographic conditions as the following:
Torsemide:
Degradation 1
Rf
Figure 5. Densitogram of torsemide (4 µg/band, Rf = 0.20) and its degradation product (deg 1) (1 µg/band, Rf = 0.58). Mobile phase. Different developing systems of different composition and ratios were tried for separation, e.g. methanol : acetone (8:2, v/v), chloroform : methanol (5:5, v/v), chloroform : methanol : ethyl acetate (7:1:2 by volume) and acetone : chloroform : ethyl acetate (2:6:2 by volume). The best separation was achieved by using acetone: chloroform: ethyl acetate (4:4:2 by volume) as a developing system. Band dimensions. The band width and the interspaces between bands should be chosen carefully to avoid diffusion of bands outside the scanning tracks and interferences between adjacent bands. Accordingly, the optimum band width chosen was 4 mm and the interspaces between bands were 14 mm. Scanning wavelength and slit dimension of scanning light beam. Different scanning wavelengths were tried, where 287 nm offers the best result regarding sensitivity, peak symmetry and sharpness, as shown in Figure 5. Also, different slit dimensions were tested for complete coverage of band dimensions, where 5 mm × 0.2 mm showed highest sensitivity for TOR. System suitability. Parameters including resolution (Rs), peak symmetry, capacity factor (K΄) and selectivity factor (α) were calculated. The resolution is always above 1.5, the selectivity more than one and an accepted value for symmetry factor was obtained, Table 2. The linearity of TOR was checked at the selected wavelength 287 nm in the concentration range of 0.5-5.0 Bull. Chem. Soc. Ethiop. 2016, 30(1)
Development and validation of stability-indicating methods for determination of torsemide 21
µg/band. Calibration curve was constructed by plotting the integrated peak areas versus the concentrations of TOR and then the regression equation was calculated and found to be: P = 0.0576C + 0.0891, r = 0.9999, where P is the integrated area under the peak (x10−4) for TOR, C is the concentration of TOR in µg/band and r is the correlation coefficient. Table 2. Parameters of system suitability of the developed TLC-densitometric method for the determination of torsemide in presence of its degradation products. Parameters
Resolution (Rs) Selectivity (α) Tailing factor (T) Capacity factor (K΄)
TLC-densitometric method HPLC method Degradation Degradation Torsemide Torsemide product product 4.13 6.98 0.14 1.38 0.90 1.00 0.87 0.95 2.83 0.41 1.74 2.79
Column efficiency (N)
-
-
6449
8704
HETP*
-
-
2.33×10⁻³
1.72×10⁻³
Reference value
R > 1.5 >1 ≈1 1–10 acceptable Increase with efficiency of the separation The smaller the value the higher the column efficiency
*
Height equivalent to theoretical plate.
HPLC method Different HPLC methods were described for determination of torsemide either in binary mixture or in presence of its metabolites. Only one HPLC method was described for stability indicative determination of TOR [23]. The drawback of this method is the use of C18 analytical column which results in poor resolution and overlapped peaks with less non polar molecules which leads to the use of more difficult gradient elution technique. Studies were done in trials to optimize all the parameters that affect the chromatographic separation. Stationary phase. Molecules with certain hydrophilicity are not retained on C18 column. This may results sometimes in low selectivity, resulting in poor or even no separation [26, 27]. So, C8 analytical column was the stationary phase of choice for the separation of TOR and its degradation products in short time with good resolution. Mobile phase. Mobile phase composition and pH have great effects on resolution and peak symmetry, even they manipulate the signal to noise ratio which in turn affect the method sensitivity. So, the optimization of organic modifiers percentage and pH of the mobile phase was of utmost importance. The optimum resolution was achieved upon using a mobile phase consisting of phosphate buffer pH 4 : acetonitrile (3:2, v/v). Instrumental conditions. Several wavelengths were tested, the best wavelength was 287 nm at which high sensitivity was obtained. In addition, mobile phase was delivered at different rates (1, 1.5 and 2 mL min-1), the optimum was 1 mL min-1, which provides maximum separation with minimum run time. Torsemide was determined in USP [4] using C8 column with 7 m particle size and flow rate of 1.5 mL min-1, while the proposed method has smaller particle size (5 m ) and 1 mL min-1 flow rate to offer a better opportunity for good separation with minimum amounts of the mobile phase. Finally a satisfactory separation was achieved by using the chromatographic conditions described in this work. The average retention times are 2.2 ± 0.2 min for TOR and 3.0 ± 0.2 min for its degradation product (deg 1) as shown in Figure 6. Bull. Chem. Soc. Ethiop. 2016, 30(1)
Hala E. Zaazaa et al.
Detector response
22
TOR
2.2
Deg 1
3.0
Time (min) Figure 6. HPLC chromatogram of torsemide and its degradation product (deg 1) (2.2 and 3.0 min, respectively) using phosphate buffer (pH 4) : acetonitrile (3:2, v/v) as a mobile phase. System suitability. System suitability testing was done in order to demonstrate that the instrumental system is performing properly. The robustness of the HPLC method was investigated by analysis of samples under a variety of experimental conditions such as small changes in the pH (6.0–6.5) and small changes in buffer/methanol ratio (from 1/1 to 1.25/0.75) in the mobile phase. The effect on retention time and peak parameters was studied. It was found that the method was robust when the column and the mobile phase ratio were varied. During these investigations, the retention times were modified, however the areas and peaks symmetry were conserved. Calculations revealed good results as shown in Table 2. Using the above mentioned chromatographic conditions, calibration curve was constructed by plotting the relative peak area (drug/external standard of 8 µg mL-1 TOR) versus the corresponding concentration of TOR and good linearity was obtained in the range of 2-16 µg mL-1. The computed regression equation is given below: P = 0.1255 C + 0.0064, r = 0.9999, where P is the relative peak area for TOR, C is the concentration of TOR in µg mL-1 and r is the correlation coefficient. Table 3. Determination of torsemide in laboratory prepared mixtures by the proposed methods. 2 Degrada D spectrophotometric 1 DD spectrophotometric method tion method products Concentration Concentration Recovery% of Torsemide % (µg mL-1) (µg mL-1) Recovery degradat degradat at at torse torsemi at 244.6 % of ion ion 232.4 (232.4 + mide de nm torsemide products products nm 244.6 nm) 5% 30.00 1.50 98.33 20.00 1.00 98.89 100.76 100.57 25% 20.00 5.00 99.71 16.00 4.00 98.98 100.92 100.25 50% 8.00 4.00 99.28 10.00 5.00 98.16 98.16 100.75 75% 16.00 12.00 101.11 24.00 18.00 99.37 98.94 100.77 90% 25.00 22.50 99.00 5.00 4.50 100.85 99.18 100.29 Mean± 99.49± 99.25 99.59 100.53 SD 1.04 ±1.00 ±1.20 ±0.25
TLC-densitometric method
To assess the stability-indicating efficiency of the proposed methods, the degradation product of TOR were mixed with the intact sample in different ratios and analyzed by the proposed methods. Table 3 illustrates good selectivity in the determination of TOR in the Bull. Chem. Soc. Ethiop. 2016, 30(1)
HPLC method
Concentration Concentration (µg mL-1) (µg mL-1) Recovery degradat Recovery degradat torse torse % of % of ion ion mide mide torsemide products torsemide products 2.00 0.10 99.96 10.00 0.50 99.72 4.00 1.00 98.39 16.00 4.00 100.93 3.00 1.50 100.05 12.00 6.00 99.02 2.80 2.10 100.52 8.00 6.00 98.95 5.00 4.50 98.96 5.00 4.50 100.43 99.58 99.81 ±0.87 ±0.87
Development and validation of stability-indicating methods for determination of torsemide 23
presence of up to 90% (w/w) of its degradation product where 1DD method at showed high selectivity at peak-peak determinations (1DD 232.4+244.6nm) in accordance to accuracy and precision without prior separation. The suggested methods were successfully applied for the determination of TOR in its pharmaceutical formulation, showing good percentage recoveries. The validity of the suggested methods was further confirmed by the results in Table 4 that obtained upon applying the standard addition technique. The precision of the suggested methods was also expressed in terms of relative standard deviation of the interday and intraday analysis results in three concentration levels (80%, 100%, 120%) as presented in Table 5. Statistical comparison of the results of the suggested methods for determination of TOR with those obtained by applying the official HPLC method [4] showing no difference thus confirming good accuracy and excellent precision (Table 6). Table 4. Determination of torsemide in Examide®tablets by the proposed methods and application of standard addition technique. 2
Pharmaceutical formulation
D spectrophotometric method (, nm) 287
1
DD spectrophotometric method TLCHPLC (, nm) densitometric method method 232.4 244.6 (232.4 + 244.6 )
Examide®tablets 99.42 101.74 99.77 10 mg TOR/tablet Found ±0.83 ±1.11 ±0.62 Batch No. 1230311 %a Recovery of standard 99.59 99.50 100.40 added % b ±0.71 ±1.17 ±1.25 Examide®tablets 100.17 20 mg TOR/tablet Found 100.84 99.32 ±0.77 a Batch No. 1240311 % ±0.93 ±0.50 Recovery of standard 99.62 99.47 99.37 b added % ±0.98 ±1.02 ±0.78 a Average of five determinations. bAverage of three determinations.
99.98 ±0.34
100.27±0.48
100.58 ±0.35
100.13 ±0.51
98.66±0.82
100.30 ±0.49
101.18±0.79
101.53 ±0.28
99.65±0.88
100.25 ±0.93
99.57 ±0.39 99.74 ±0.92
Table 5. Results of assay validation parameters of the proposed methods for determination of torsemide. 2
D method (, nm)
1
DD spectrophotometric method TLCHPLC (, nm) Parameters densitometric method (232.4 + method 287 232.4 244.6 244.6) Accuracy (mean ±% RSD ) 100.06±0.75 100.12±0.88 99.93±0.83 99.95±0.61 99.86±0.70 99.98±0.76 Precision (%RSD) Repeatability* 80% ±0.58 ±0.47 ±0.31 ±0.39 ±0.46 ±0.37 100% ±0.69 ±0.32 ±0.22 ±0.26 ±0.49 ±0.43 120% ±0.67 ±0.22 ±0.29 ±0.22 ±0.57 ±0.48 Intermediate precision** 80% ±0.82 ±0.92 ±0.75 ±0.58 ±0.99 ±0.71 100% ±0.77 ±0.87 ±0.72 ±0.63 ±0.89 ±0.80 120% ±0.79 ±0.70 ±0.84 ±0.52 ±0.80 ±0.67 Specificity and selectivity 99.49±1.05 99.25±1.01 99.59±1.20 100.53±0.25 99.58±0.87 99.81±0.87 Range (µg mL-1) 5- 30 4-28 4-28 4-28 0.50 –5.0 2-16 Linearity: Slope 0.0241 0.0499 0.0558 0.1034 0.0576 0.1255 Intercept 0.0562 -0.0409 0.0809 0.0636 0.0891 0.0064 Correlation coefficient (r) 0.9998 0.9999 0.9999 0.9999 0.9999 0.9999 Robustness 100.17±0.54 100.97±0.84 LOD*** (µg mL-1) 0.68 0.30 0.38 0.31 0.08 (µg/band) 0.22 -1 LOQ*** (µg mL ) 2.08 0.92 1.16 0.93 0.25 (µg/band) 0.66 * The intraday (n = 9), average of three different concentrations repeated three times within the day. **The interday (n = 9), average of three concentrations repeated three times in three successive days. ***Limit of detection and quantitation are determined via calculations, LOD = (SD of the response/slope) x 3.3; LOQ = (SD of the response/slope) x 10. Bull. Chem. Soc. Ethiop. 2016, 30(1)
24
Hala E. Zaazaa et al.
Table 6. Statistical comparison of the results obtained by the proposed methods and the official method for the determination of torsemide in pure powder form. Parameters 2D method (, nm) 1DD spectrophotometric method (, nm) TLCHPLC Official (232.4 + densitometric method method* 287 232.4 244.6 method 244.6) Mean 100.1 100.1 99.93 99.95 99.86 99.98 99.77 SD 0.75 0.88 0.83 0.61 0.70 0.76 0.42 %RSD 0.75 0.88 0.83 0.61 0.70 0.76 0.42 Variance 0.56 0.77 0.69 0.37 0.49 0.58 0.18 N 6 7 7 7 7 7 6 F-value 3.11 (5.05) 4.28 (4.95) 3.83 (4.95) 2.06 (4.95) 2.72 (4.95) 3.22 ----(4.95) Student’s 0.826 0.886 0.424 0.606 0.274 0.598 ----t-test (2.228) (2.201) (2.201) (2.201) (2.201) (2.201) * HPLC method using C8 column, K phosphate buffer pH 3.5–methanol (3:2, v/v) as mobile phase, UV detection at 288 nm and a flow rate of 1.5 mL min-1. The figures between parenthesis are the corresponding theoretical values of t and F at p = 0.05.
CONCLUSION From the results obtained, we concluded that the suggested methods showed high sensitivity, accuracy, reproducibility and specificity and can be used as stability indicating methods. Moreover, these methods are simple and inexpensive, permitting their application in quality control laboratories. Derivative spectrophotometric method is simple, accurate and specific for TOR in presence of 5-90% degradation products over wide concentration range of torsemide, but it depends on critical measurements at specified wavelength. Concerning the advantage of first derivative of ratio spectra spectrophotometric method over second derivative one, that no critical measurements was needed as the interference due to the degradation products was cancelled along the whole spectrum. The presented TLC-densitometric and HPLC methods could provide highly selective quantitative stability indicating methods for the analysis of TOR in presence of its degradation products. It also offers the capability of estimation the extent of degradation as well as the determination of its concentration. Besides being very sensitive, TLCdensitometric method has the advantage of using single run for analysis of multiple concentrations; saving time and effort. REFERENCES 1. Sweetman, S.C. (Ed.) Martindale The Complete Drug Reference, 36th ed., Pharmaceutical Press: London; 2009. 2. Moffat, A.C. Clark’s Isolation and Identification of Drugs, 2nd ed., Pharmaceutical Press: London; 1986. 3. British Pharmacopoeia Vol. II, The Stationery Office on Behalf of the MHRA, London; 2010 pp 2124-2125. 4. The U.S. Pharmacopoeia, 27th ed., U.S. Pharmacopeial Convention: Rockville, MD; 2004, pp 3775-3776. 5. Vasantha, K.; Sree, M.; Sai, S.; Lakshmi, G.; Nalluri, B.N. J. Chem. Pharm. Res.2014, 6, 334. 6. Engelhardt, S.; Meineke, I.; Brockmoeller, J. J. Chromatogr. B: Anal. Technol. Biomed. Life Sci. 2006, 831, 31. 7. Liu, K.H.; Lee, Y.K.; Ryu, J.Y.; Lee, D.J.; Kang, W.; Lee, S.S.; Yoon, Y.R.; Shin, J.G. Chromatographia 2004, 60, 639.
Bull. Chem. Soc. Ethiop. 2016, 30(1)
Development and validation of stability-indicating methods for determination of torsemide 25
8. Qin, Y.; Wang, X.B.; Wang, C.; Zhao, M.; Wu, M.T.; Xu, Y.X.; Peng, S.Q.; J. Chromatogr. B: Anal. Technol. Biomed. Life Sci. 2003, 794, 193. 9. Qin, Y.; Zhu, S.T.; Wang, C.; Ming, Z.O.; Peng, S.Q. Fenxi Ceshi Xuebao 2003, 22, 41. 10. Deventer, K.; Van Eenoo, P.; Delbeke, F.T. Rapid Commun. Mass Spectrom. 2005, 19, 90. 11. Deventer, K.; Delbeke, F. T.; Roels, K.; Van Eenoo, P. Biomed. Chromatogr. 2002, 16, 529. 12. Kolmonen, M.; Leinonen, A.; Pelander, A.; Ojanpera, I. Anal. Chim. Acta 2007, 585, 94. 13. Goebel, C.; Trout, G.J.; Kazlauskas, R. Anal. Chim. Acta 2004, 502, 65. 14. Barroso, M.B.; Meiring, H.D.; deJong, A.; Alonso, R.M.; Jimenez, R.M. J. Chromatogr B: Biomed. Applications 1997, 690, 105. 15. Beyer, J.; Bierl, A.; Peters, F.T.; Maurer, H.H. Therap. Drug Monit. 2005, 27, 509. 16. Shashikant, B.B.; Sanjay, K.P. Int. J. Pharm. Quality Assur. 2010, 2, 52. 17. Marothu, V.; Dannana, G. E-J. Chem. 2008, 5, 473. 18. Jatin, G.; Gaurav, K.; Vishal, Y.; Wakode, S.R. J. Chem. Pharm. Res. 2010, 2, 513. 19. Sankar, D.G.; Babu, P.J.; Sujatha, N.; Latha, P.V.M. Asian J. Chem. 2006, 18, 3247. 20. Krishna, M.V.; Sankar, D.G. Acta Cienciaindica Chemistry 2006, 32, 355. 21. Sharma, M.C.; Smita, S.K.D.V.; Sharmac, A.D. Der Pharma Chemica 2010, 2, 121. 22. Kakde, R.N.; Chaudhary, A.; Barsagade, D.K. Acta Chromatographia 2011, 23, 145. 23. Patel, H.B.; Mohan, A.; Joshi, H.S. JAOAC Int. 2011, 94, 143. 24. Zaazaa, H.E.; Abbas, S.S.; Hebatallah, M.E.; El-Bardicy, M.G. Portug. Electrochim. Acta 2012, 30, 335. 25. ICH, Q1A (R2) Stability Testing of New Drug Substances and Products, International Conference on Harmonization, IFPMA, Geneva, Switzerland; 2003. 26. Meyer, V.R. Practical High Performance Liquid Chromatography, 3rd ed., John Wiley and Sons: West Sussex.: UK; 1998. 27. Snyder, L.R.; Kirkland, J.J.; Glajch, J.J. Practical HPLC Methods Development, 2nd ed., John Wiley and Sons, Inc.: New York; 1997.
Bull. Chem. Soc. Ethiop. 2016, 30(1)