Asian J. Research Chem. 2(2): April.-June, 2009 ,
ISSN 0974-4169
www.ajrconline.org
RESEARCH ARTICLE
Development and Validation of UV Spectrophotometric Method of Cefuroxime Axetil in Bulk and Pharmaceutical Formulation. Santosh Shelke*1, Santosh Dongre1, Amit Rathi2, Dinesh Dhamecha2, Saifee Maria2 and Mohd Hassan G Dehghan 2 1
2
Yash Institute of Pharmacy, South city, Bajaj Nagar, Post Box no. 968,Waluj,Aurangabad-431134 Y.B.Chavan College of Pharmacy, Maulana Azad Education Trust, Dr. Rafiq Zakaria Marg,Aurangabad-431001 *Corresponding Author E-mail:
[email protected]
ABSTRACT
A simple, accurate, cost effective and reproducible spectrophotometric method has been developed for the estimation of cefuroxime axetil in bulk and pharmaceutical dosage form. UV spectrophotometric method, which is based on measurement of absorption at maximum wavelength 281nm.The percentage recovery of cefuroxime axetil ranged from (99.97 ± 0.3969) in pharmaceutical dosage form. The developed method was validated with respect to linearity, accuracy (recovery), precision and specificity. Beers law was obeyed in the concentration range of 4-28µg/ml having line equation y = 0.0346x + 0.0566 with correlation coefficient of 0.9999. Results of the analysis were validated statistically and by recovery study. KEYWORDS: UV spectrophotometry, cefuroxime axetil
INTRODUCTION:
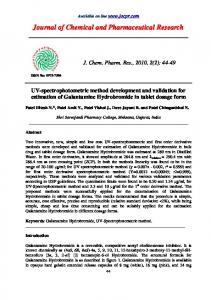
Chemically cefuroxime axetil is (RS)-1-hydroxyethyl (6R, 7R)-7-[2-(2-furyl) glyoxyl-amido]-3-(hydroxymethyl)-8oxo-5-thia-1-azabicyclo[4.2.0]-oct-2-ene-2-carboxylate, 72-(Z)-(O-methyl-oxime), 1-acetate 3-carbamate (figure no.1) ,is semisynthetic ,broad spectrum cephalosporin antibiotic for oral administration. It is indicated in case of pharyngitis / tonsillitis, acute bacterial otitis media, acute bacterial maxillary sinusitis, chronic bronchitis, urinary tract infection, lyme disease1. Analysis is an important component in the formulation development of any drug molecule. A suitable and validated method has to be available for the analysis of drug(s) in the bulk, in drug delivery systems, from release dissolution studies and in biological samples. If a suitable method, for specific need, is not available then it becomes essential to develop a simple, sensitive, accurate, precise, reproducible method for the estimation of drug samples The estimation of cefuroxime axetil by mercurimetric method2, high performance liquid chromatography [HPLC]3, high performance thin layer chromatography [HPTLC]4 and spectroflurimetric method5 is reported in literature. Received on 25.04.2009 Accepted on 21.06.2009
Modified on 30.04.2009 © AJRC All right reserved
Asian J. Research Chem. 2(2): April.-June, 2009 page 222-224
Although simultaneous UV estimation of cefuroxime axetil and probenecid has been reported by Chaudari et. al.6, but single estimation of this drug has not been reported in bulk and in pharmaceutical formulation. Thus the present study was undertaken to develop and validate a simple, sensitive, accurate, precise, and reproducible U.V method for cefuroxime axetil.
MATERIALS AND METHOD:
Instrument and materials: Instrument used were Perkin Elmer double beam UV/Visible Spectrophotometer and schimadzu AX200 analytical balance. Cefuroxime axetil pure drug was obtain from Aurobindo Pharma LTD. Hyderabad as gift sample with 99.99% w/w assay value and was used without further purification. All chemicals and reagents used were of analytical grade. Selection of media: Main criteria for media selection are solubility and stability, i.e. drug should be soluble as well as stable for sufficient time in selected media. Though the official reported media for this drug is 0.07 M pH 7.0 phosphate buffer but in provided experimental condition drug is not giving clear solution in pH 7.0 phosphate buffer, same time drug is soluble in methanol, so for present work combination of methanol and pH 7.0 phosphate buffer in ratio of 2: 8 has been selected as analytical media.
222
Asian J. Research Chem. 2(2): April.-June, 2009 ,
Table No.1 - Calibration Curve parameter. S. No. Concentration Absorbance ± SD ( µg/ml) 1 2 3 4 5 6 7
4 8 12 16 20 24 28
0.1965 ± 0.03 0.3349 ± 0.037 0.4708 ± 0.037 0.6114 ± 0.035 0.745 ± 0.023 0.889 ± 0.057 1.0288 ± 0.037
%Relative standard deviation 1.7 1.1 1.7 1.5 1.3 2.6 3.6
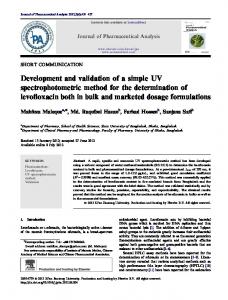
Figure No.2 - Determination of by UV scanning.
max
of cefuroxime axetil
Figure No.1 - Chemical structure of cefuroxime axetil1.
RESULT AND DISCUSSION:
Precision: Assay of method precision (intra-day precision) was evaluated by carrying out three independent assays of test samples of cefuroxime axetil. The intermediate precision (inter-day precision) of the method was also evaluated using two different analysts, systems and different days in the same laboratory. The relative standard deviation (RSD) and assay values obtained by two analysts were Preparation of standard stock solution: Standard drug solution of cefuroxime axetil was prepared 0.36, 99.50 and 0.31, 99.60 respectively (Table no.4). by dissolving 10mg cefuroxime axetil in 20ml methanol and transfered it to 100ml volumetric flask and volume Accuracy (Recovery Test): was made upto mark with phosphate buffer pH 7.0 to Accuracy of the method was studied by recovery obtain stock solution of 100µg/ml concentration. For experiments. The recovery experiments were performed by adding known amounts to tablet. The recovery was obtaining clear solution, solution was ultrasonicated. performed at three levels, 80,100and 120% of cefuroxime axetil standard concentration. The recovery samples were Preparation of calibration curve: Calibration curve was prepared in 2:8 (methanol: 7.0 pH prepared in afore mentioned procedure. Three samples were phosphate buffer) at max 281 nm using Perkin Elmer UV- prepared for each recovery level. The solutions were then visible spectrophotometer. For this stock solution of 100 analyzed, and the percentage recoveries were calculated µg/ml was prepared. Serial dilution of 4, 8, 12, 16, 20, 24 from the calibration curve. The recovery values for and 28 µg/ml were prepared and absorbance was taken at cefuroxime axetil ranged from 99.97 ± 0.3969 (Table no.3). max 281 nm. Averages of such 8 sets of values were taken for standard calibration curve, and solutions were Linearity: scanned in the range of 200-400 nm against blank. The The linearity of the response of the drug was verified at 2 calibration curve was plotted. The optical characteristics to 40 g/ml concentrations,but linearity was found to be between 4-28 g/ml concentration. The calibration graphs are summarized in Table no.1 were obtained by plotting the absorbance versus the concentration data and were treated by linear regression Preparation of sample solution: Ten tablets were weighed and powdered. The amount of analysis (Table no.2). The equation of the calibration tablet powder equivalent to 10 mg of cefuroxime axetil curve for cefuroxime axetil obtained y = 0.0346x + was weighed accurately and transfer to 20 ml methanol 0.0566, the calibration curve was found to be linear in the concentrations. The correlation and kept for 15 min with frequent shaking and volume aforementioned 2 was made up to 100 ml mark with phosphate buffer pH coefficient (r ) of determination was 0.9999. 7.0.The solution was then filtered through whatmann filter paper # 41. This filtrate was diluted suitably with Limit of Detection (LOD) and Limit of Quantification solvent (20% v/v methanol in phosphate buffer pH 7.0) to (LOQ): get the solution of 16µg/ml concentration .The The LOD and LOQ of Cefuroxime axetil were absorbance was measured against blank. The drug content determined by using standard deviation of the response Conference of the preparation was calculated using standard and slope approach as defined in International 7 calibration curve. Amount of drug estimated by this on Harmonization (ICH) guidelines .The LOD and LOQ was found to be as in table no.2. method is given in Table no.3
223
Asian J. Research Chem. 2(2): April.-June, 2009 ,
Table.2 - Validation parameters Sr. No. Parameter 1. Absorption maxima(nm) 2. Linearity Range (µg/ml) 3 Standard Regression Equation 4 Correlation Coefficient (r2 ) 5 Molar absorptivity 6 A (1%, 1cm) 7 Accuracy (% recovery ±SD) 8 Precision 9 Specificity 10 11 12
Sandell’s Sensitivity (µg/cm2/0.001 absorbance unit)8 LOD (µg/ml) LOQ (µg/ml)
Result 281 4-28 y = 0.0346x + 0.0566 0.9999 49647.9 398.453 99.97 ± 0.3969 99.50% (Intra-day precision) and 99.60%(Inter-day precision) A 16 µg/ml solution of candidate drug in 7.0-pH phosphate buffer at UV detection λ of 281 nm will show an absorbance value of 0.6114 ± 0.035 0.02534 1.3669 4.1421
Table No.3 - Determination of Accuracy by percentage recovery method Tablet amount Level Drug of Amount Ingredient (µ µg/ml) (µ µg/ml) addition (%) added (mg) 16 80 16 100 16 120 *cefuroxime axetil having brand name Kefstar-250 cefuroxime axetil*
12.8 16 19.2
Table No.4 - Determination of Precision Sample Assay of cefuroxime axetil as % of labeled number amount Analyst-I Analyst-II (Intra-day precision) (Inter-day precision) 1 99.42 99.70 2 99.63 99.23 3 99.58 99.57 4 99.10 99.88 5 100.12 99.98 6 99.20 99.25 Mean 99.50 99.60 RSD 0.36 0.31
found
28.6918 31.9672 35.3430
% Recovery
Average recovery
%
99.6243 99.8976 100.4064
99.97 ± 0.3969
REFERENCES: 1. 2. 3. 4. 5. 6.
Determination of Active Ingredients in Tablets: The validated method was applied to the determination of cefuroxime axetil in Tablets. Six tablets were assayed and 7. the results are shown in (Table no. 3) indicating that the amount of drug in tablet samples met with requirements 8. (99–102% of the label claim).
Dollery C. Therapeutic drugs .second edn. Churchill Livingstone, London UK.1999;C135-C140. Pospisilova B and Kubes J. Mercurimetric determination of cephalosporin antibiotics. Pharmazie.1998; 43(4):246-248. US Pharmacopoeia (XXIV) and National Formulary (XIX). Asian Edn., US Pharmacopoeial convection,Inc.Rockville,MD.2000;335. Shaha NJ, Shaha SK, Patel VF, Patel NM. Development and validation of HPTLC method for the estimation of cefuroxime axetil. Ind J Pharm Sci.2007;69(1):140-142. Murillo JA, Lemus JM, Garcia LF. Specctroflurometric analysis of cefuroxime axetil in pharmaceutical dosage form. J Pharm Biomed Analysis.1994;12(7):875-881. Chaudari SV, Karnik A, Adhikary A, Tandale RS, Vavia PR. Simultanious UV spectrophotometric method for estimation of cefuroxime axetil and probenecid from solid dosage form. Ind J Pharm Sci.2006;68(1):59-63 Validation of Analytical Procedures, Methodoly, ICH Harmonised tripartite guidelines; 1996:1. Khopkar SM, Basic concepts of analytical chemistry. New age international publisher. 2008; 3rd ed: 277-278.
CONCLUSIONS:
The developed method was found to be simple, sensitive, accurate, precise, reproducible, and can be used for routine quality control analysis of cefuroxime axetil in bulk and pharmaceutical formulation
ACKNOWLEDGEMENT:
We are thankful to Aurobindo Pharma Ltd.. Hyderabad for providing the gift sample of cefuroxime axetil.We would also like to thank Dr.Subhash Devhde Patil Director Yash Institute of Pharmacy for providing all the facilities to complete our work successfully.
224