International Journal of
Environmental Research and Public Health Article
Development and Validation of the Brief Folate-Specific Food Frequency Questionnaire for Young Women’s Diet Assessment 1, * Dominika Głabska ˛ 1 2
*
ID
, Aneta Ksia˙ ˛zek 1 and Dominika Guzek 2
ID
Department of Dietetics, Faculty of Human Nutrition and Consumer Sciences, Warsaw University of Life Sciences (WULS-SGGW), 159c Nowoursynowska Street, 02-776 Warsaw, Poland;
[email protected] Department of Organization and Consumption Economics, Faculty of Human Nutrition and Consumer Sciences, Warsaw University of Life Sciences (WULS-SGGW), 159c Nowoursynowska Street, 02-776 Warsaw, Poland;
[email protected] Correspondence:
[email protected]; Tel.: +48-22-5937126
Received: 13 October 2017; Accepted: 7 December 2017; Published: 14 December 2017
Abstract: The tools enabling brief assessment of folate intake may be of great value for public health purposes. The aim of the presented study was to design a brief folate-specific food frequency questionnaire for Central and Eastern European population of women, as well as to assess the validity and reproducibility of the designed Folate-Intake Calculation-Food Frequency Questionnaire (Fol-IC-FFQ) on a group of Polish women aged 20–30 years. Participants collected 3-day dietary records and completed the Fol-IC-FFQ twice (FFQ1: directly after the dietary record; and FFQ2: six weeks later). The analysis included an assessment of validity (comparison of the results of FFQ1 and 3-day dietary record) and of reproducibility (comparison of the results of FFQ1 and FFQ2). In assessment of validity, a Bland-Altman index of 5.3% was observed. In assessment of reproducibility, a Bland-Altman index of 2.7% was observed, the share of individuals classified into the same intake adequacy category was over 85%, the share of individuals classified into the same tertile was almost 75%, the weighted κ statistic indicated substantial agreement (0.67) and correlation was significant (p = 0.0000; R = 0.7995). Assessment of the Fol-IC-FFQ revealed a satisfactory level of validity and very good level of reproducibility in the population of young Polish women. The Fol-IC-FFQ may be considered a valid tool for the assessment of folate intake in young Polish women and a promising tool for the assessment of folate intake in young women in Central and Eastern Europe. Keywords: folate; food frequency questionnaire; validation study; validity; reproducibility; young women
1. Introduction Folate is indicated by the World Health Organization (WHO) [1] as a nutrient especially important for women of reproductive age, in particular during pregnancy. A deficiency of this nutrient is associated with neural tube defects in progeny, and also with anemia in young women [2]. Considering both neural tube defects and anemia prevention in pregnant women, it is recommended to implement folic acid supplementation as early as possible, while supplementation before conception is indicated as the best option [2]. In terms of WHO’s global targets to be achieved by the year 2025 [3], the role of folate is also undeniable. Regarding the global target of the reduction of anemia in women of reproductive age and of the reduction of low birth weight, there is direct evidence of the effect of daily iron and folic acid supplementation during pregnancy, from the review and meta-analysis of Peña-Rosas et al. [4]. Int. J. Environ. Res. Public Health 2017, 14, 1574; doi:10.3390/ijerph14121574
www.mdpi.com/journal/ijerph
Int. J. Environ. Res. Public Health 2017, 14, 1574
2 of 16
In terms of the global target of the reduction of the number of children who suffer from stunted growth, as well as the reduction of childhood wasting, there is no direct evidence for the link between supplementation during pregnancy and the achievement of these goals, but the pooling analysis of longitudinal birth cohorts conducted by Christian et al. [5] enabled conclusions to be drawn about existing associations [6]. However, it must be indicated that in Western countries, both before and during pregnancy, a number of women do not take adequate folic acid supplements, and this is especially alarming, if in a given country there is no mandatory folic acid fortification [7]. Among countries without such fortification requirements are the Netherlands and Norway, where the frequency of non-adherence to recommended supplementation in the preconception period is, respectively, 45–63% [8,9] and 70% for women of European ethnicity [10]. Among countries with obligatory folic acid fortification are the United States of America and Canada [11], which is noted as a positive example of a decreased frequency of neural tube defects in progeny [7]. However, in Canada 40% of women still do not achieve the recommended folate blood levels [12]. Taking this deficiency into account, in Canada not only is fortification mandatory and supplementation recommended, guidelines for pregnant women also include dietary counseling associated with the food sources of folate [13]. Such nutritional counseling may be of great value for young women, not only to indicate necessary dietary modifications, but also to make women aware of the need for supplementation, due to their insufficient dietary intake. Especially in non-pregnant women of reproductive age, such education could be valuable to ensure necessary understanding before conception [14]. Considering the fact that the number of unplanned pregnancies is still high [15] and such pregnancies are the main reason for a lack of folic acid supplementation [16], properly planned education should be conducted not only for pregnant women but for all women of reproductive age. In assessments of folate [17] and vitamin B intake [18] in countries with no folate fortification [19], food frequency questionnaires are suggested as a good option. However, the majority of folate food frequency questionnaires validated so far consist of a large number of questions, and as a result, are time consuming [20]. Simultaneously, brief questionnaires are indicated as especially valuable, as they enable immediate feedback to respondents, indicating their required dietary goals, as well as may be positively validated [21]. The aim of the presented study was to design a brief folate-specific food frequency questionnaire, as well as to assess the validity and reproducibility of the designed Folate-Intake Calculation-Food Frequency Questionnaire (Fol-IC-FFQ) on a group of Polish women aged 20–30 years. 2. Materials and Methods The study was conducted according to the guidelines laid down in the Declaration of Helsinki, and all procedures involving human subjects were approved by the Bioethical Commission of the National Food and Nutrition Institute in Warsaw (No. 0701/2015). 2.1. Designing the Folate-Specific Food Frequency Questionnaire Fol-IC-FFQ (Folate-Intake Calculation-Food Frequency Questionnaire) The designed folate-specific food frequency questionnaire (Fol-IC-FFQ) included only food products that were sources of folate, because the questionnaire was planned as a brief tool to assess only folate intake. All food products characterized by a folate content no lower than 0.1 µg per 100 g were chosen based on Polish food composition tables [22], containing 932 food products and dishes, while both typical and specific local food products are included. Folate was first included in the tables in the year 2000 and there are no missing data for folate. The Polish food composition tables [22] are elaborated by the National Food and Nutrition Institute in Warsaw, which is a member of EuroFIR [23]. All food products meeting the assumed criteria were included in the designed questionnaire, where they were grouped into food product groups characterized by similar folate contents, as is the
Int. J. Environ. Res. Public Health 2017, 14, 1574
3 of 16
case in other previously published validation studies [24–26]. Afterwards, the food products were clustered into 25 food product groups, while vegetables were clustered into 3 separate groups. This was connected with the fact that in Poland, vegetables and cereals have been listed as the main folate sources [27], and that based on recent data, an even higher contribution from vegetables (35%) than cereals (32%) has been demonstrated [28]. Similarly, in the European Prospective Investigation into Cancer and Nutrition (EPIC) study [29] conducted in 10 European countries, for 8 of them, in groups of women, vegetables were the main folate source, while cereals were ranked second. Simultaneously, for vegetables, a varying folate content is stated. Consequently, 3 groups, characterized by high, medium and low folate content, were created. The most popular serving sizes were based on the Polish food model booklet [30], as well as on our own previous studies of food frequency questionnaires [24–26] and then verified by a dietitian during the pilot research. In the Fol-IC-FFQ these sizes were indicated both in grams and as the described serving sizes. The designed Fol-IC-FFQ is presented in Table 1 and does not include the folate content in the servings. This is so as not to interfere with the provision of answers. However, for each serving size and for a group of food products specified in the questionnaire, the average folate content was calculated based on the Polish food composition tables [22], as presented in Table 2. Table 1. The scheme of an applied food frequency questionnaire including food products, serving sizes and frequencies in the Folate-Intake Calculation-Food Frequency Questionnaire (Fol-IC-FFQ). Products
Serving Size
Frequency
Fish and fish products
50 g (deck of cards)
monthly
Pasta, rice, groats
100 g of cooked (2/3 of a glass)
monthly
Bean, soybeans, peas
100 g of cooked (2/3 of a glass)
monthly
Nuts and seeds
15 g (1 spoon)
monthly
Grains, wheat bran and germs
10 g (1 tablespoon)
monthly
Milk, dairy beverages, cream
250 g (1 glass)
weekly
Rennet cheese
20 g (thin slice)
weekly
Cottage cheese, curd cheese, fromage frais, dairy desserts
40 g (1 slice, large tablespoon)
weekly
Egg
50 g (1 egg)
weekly
Egg yolk
30 g (1 egg yolk)
weekly
Liver
100 g (palm of small hand)
weekly
Other meat and offal
100 g (palm of small hand)
weekly
Pate
40 g (1 tablespoon, 1 slice)
weekly
Other cold cuts
15 g (thin slice of ham, 3 slices of sausage, 1/3 of wiener)
weekly
Bread
35 g (1 medium slice, small roll)
weekly
Oat, wheat, rye cereals, muesli
10 g (1 tablespoon)
weekly
Fluor added to dishes
10 g (1 tablespoon)
weekly
Corn flakes, corn crunches, puffed rice
10 g (2 tablespoons)
weekly
Potatoes
70 g (1 medium, 3 tablespoons of puree)
weekly
Broccoli, kale, Brussels sprouts, broad bean, asparagus, parsley, spinach
100 g (half of a glass, 1 glass of leafy vegetables)
weekly
Zucchini, chicory, corn, red pepper, cauliflower, leek, green cabbage, parsnip, green peas, green beans, lettuce, beetroot
100 g (half of a glass, 1 glass of leafy vegetables)
weekly
Number of Servings *
Int. J. Environ. Res. Public Health 2017, 14, 1574
4 of 16
Table 1. Cont. Products
Serving Size
Frequency
Celery, sorrel, cucumber, onion, eggplant, turnip, turnip cabbage, radish, pumpkin, carrot, tomato, red cabbage, green pepper
100 g (half of a glass, 1 glass of leafy vegetables)
weekly
Avocado
70 g (half of medium one)
weekly
Other fruits
100 g (half of a glass)
weekly
20 g (3–4 chocolate bar squares)
weekly
Chocolate
Number of Servings *
* Column completed by the respondents.
Table 2. The content of folate in one serving of a size specified in the Fol-IC-FFQ. Products
Serving Size
Folate Content/ Serving (µg)
Fish and fish products
50 g (deck of cards)
5
Pasta, rice, groats
100 g of cooked (2/3 of a glass)
12
Bean, soybeans, peas
100 g of cooked (2/3 of a glass)
69
Nuts and seeds
15 g (1 spoon)
9
Grains, wheat bran and germs
10 g (1 tablespoon)
21
Milk, dairy beverages, cream
250 g (1 glass)
11
Rennet cheese
20 g (thin slice)
5
Cottage cheese, curd cheese, fromage frais, dairy desserts
40 g (1 slice, large tablespoon)
8
Egg
50 g (1 egg)
32
Egg yolk
30 g (1 egg yolk)
30
Liver
100 g (palm of small hand)
317
Other meat and offal
100 g (palm of small hand)
10
Pate
40 g (1 tablespoon, 1 slice)
14
Other cold cuts
15 g (thin slice of ham, 3 slices of sausage, 1/3 of wiener)
1
Bread
35 g (1 medium slice, small roll)
12
Oat, wheat, rye cereals, muesli
10 g (1 tablespoon)
7
Fluor added to dishes
10 g (1 tablespoon)
5
Corn flakes, corn crunches, puffed rice
10 g (2 tablespoons)
1
Potatoes
70 g (1 medium, 3 tablespoons of puree)
14
Broccoli, kale, Brussels sprouts, broad bean, asparagus, parsley, spinach
100 g (half of a glass, 1 glass of leafy vegetables)
150
Zucchini, chicory, corn, red pepper, cauliflower, leek, green cabbage, parsnip, green peas, green beans, lettuce, beetroot
100 g (half of a glass, 1 glass of leafy vegetables)
64
Celery, sorrel, cucumber, onion, eggplant, turnip, turnip cabbage, radish, pumpkin, carrot, tomato, red cabbage, green pepper
100 g (half of a glass, 1 glass of leafy vegetables)
26
Avocado
70 g (half of medium one)
43
Other fruits
100 g (half of a glass)
15
Chocolate
20 g (3–4 chocolate bar squares)
2
The Fol-IC-FFQ included questions about the exact typical number of servings of products from the indicated food product groups which had been consumed during a typical week or month (open-ended question). The frequency per week or month was chosen based on typical dietary habits in Poland, depending on the type of food product. The frequency per day was not applied to simplify the
Int. J. Environ. Res. Public Health 2017, 14, 1574
5 of 16
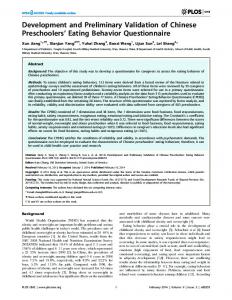
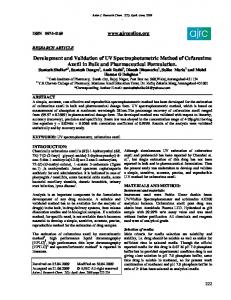
questionnaire and to avoid excessive overestimation. Considering the fact that vegetables are among the most important sources of folate [22] and that the intake of vegetables depends on the season of the year, information on intake throughout the previous year was required. In the Fol-IC-FFQ, it was also specified that the number of servings should include the servings of products consumed and added to consumed dishes, and it was possible to indicate not only whole integers but also decimal fractions. A similar approach had been adopted in our own previous studies conducted for vitamin D [24], iron [25] and iodine [26]. The procedure for daily folate intake calculation included dividing the number of servings into 7 days a week or 30 days a month (depending on the type of food product) to obtain the daily number of servings. Afterwards, the daily folate intake from specific food product groups was to be estimated using the following formula: folate intake (µg) = daily number of servings × typical folate content in one serving (Table 2). The total daily folate intake was to be obtained as the sum of the values of folate intake from all the groups of products. 2.2. Validation of the Fol-IC-FFQ The Fol-IC-FFQ was validated with a group of young women, and convenience sampling was applied. The inclusion criteria were as follows: women, aged 20–30 years, not undergoing weight loss or on any special diet, not pregnant and not during lactation, without any chronic diseases, and living in Warsaw. There were 110 individuals meeting the inclusion criteria who volunteered to participate in the study. Finally, validation of the assessed Fol-IC-FFQ was conducted with a group of 75 young women, as 35 of the individuals who had initially volunteered did not complete all of the required elements (Figure 1). The obtained sample size was in accordance with recommendations on sample size for validation studies of food frequency questionnaires, as the guidelines state that at least 50 to 100 subjects for each demographic group is recommended [31]. The study of validation was conducted in autumn over a period of 4 months: from September 2016 to December 2016. During this period, the participants were asked to conduct 3-day dietary records and to complete the Fol-IC-FFQ twice (FFQ1: directly after conducting the 3-day dietary record; and FFQ2: 6 weeks after FFQ1). In the analyzed group of young women, about 3–5 min was needed to complete the paper Fol-IC-FFQ form, with 25 questions about product groups and no additional questions included. Validation of the Fol-IC-FFQ was conducted according to the same methodology as validations published previously [24–26]. This included an analysis of the validity (external validation comparing results of FFQ1 with results of the 3-day dietary record, where both assessments were conducted by the same researcher) and reproducibility of the method (so-called repeatability; internal validation comparing results obtained twice—FFQ1 and FFQ2, with both assessments conducted by the same researcher), as defined by Willett and Lenart [32]. Because the aim of the study was to validate a questionnaire that enables assessment of dietary folate intake, the reference value was not folate status, but folate intake. It is indicated that when the food frequency questionnaire is applied for folate assessment and biomarkers are used as reference values, observed errors of determination are related to other factors than error of the data obtained using the food frequency questionnaire [33,34], such as the differing bioavailability levels of folate from various sources, or inadequate folate values in the food composition tables [35]. Taking this into account, it was decided to treat the 3-day dietary record as the reference value for folate intake to obtain a reliable assessment of the questionnaire. Both the 3-day dietary record and the Fol-IC-FFQ assessments were based on self-reported data.
Int. J. Environ. Res. Public Health 2017, 14, 1574 Int. J. Environ. Res. Public Health 2017, 14, 1574
6 of 16 6 of 15
Figure 1. The design of the study. Figure 1. The design of the study.
For the 3‐day dietary record, the basis of the analysis was a record conducted in three typical, For the 3-day dietary record, the basis of the analysis was a record conducted in three typical, randomly chosen and not successive days (2 weekdays and 1 day of the weekend). The dietary record randomly chosen and not successive days (2 weekdays and 1 day of the weekend). The dietary record was conducted on the basis of widely accepted and applied rules: using a structured format, with was conducted on the basis of widely accepted and applied rules: using a structured format, with additional questions about the name of the meal, time and location of consumption, meal ingredients additional questions about the name of the meal, time and location of consumption, meal ingredients and weight of serving (weighted using kitchen scales) or size of serving (estimated using standard and weight of serving (weighted using kitchen scales) or size of serving (estimated using standard household measures) [36]. To provide reliable estimates of food intake, participants were instructed household measures) [36]. To provide reliable estimates of food intake, participants were instructed on on the principles of keeping their dietary record as well as on the necessity of accurate and scrupulous the principles of keeping their dietary record as well as on the necessity of accurate and scrupulous recording of all food products consumed and beverages drunk, while the serving sizes were verified recording of all food products consumed and beverages drunk, while the serving sizes were verified afterwards by a dietitian using the Polish food model booklet [30]. Folate intake was analyzed using afterwards by a dietitian using the Polish food model booklet [30]. Folate intake was analyzed using Polish dietary software “Dietetyk 2” and the Polish database for the nutritional value of products Polish dietary software “Dietetyk 2” and the Polish database for the nutritional value of products (National Food and Nutrition Institute, 2001) [22]. (National Food and Nutrition Institute, 2001) [22]. 2.3. Statistical Analysis The statistical analysis of validation included:
Int. J. Environ. Res. Public Health 2017, 14, 1574
7 of 16
2.3. Statistical Analysis The statistical analysis of validation included:
•
•
•
•
Analysis of the Bland-Altman plots in the assessment of validity (Fol-IC-FFQ1 vs. 3-day record) and of reproducibility (Fol-IC-FFQ1 vs. Fol-IC-FFQ2): the results were interpreted using the Bland-Altman index, whereas the limits of agreement value (LOA) was calculated as the sum of the mean absolute differences of folate intake measured by the two methods, and the ± standard deviation of the absolute difference of folate intake recorded for the two methods magnified by 1.96. In the analysis conducted with the Bland-Altman method to assess agreement between the measurements, a Bland-Altman index of a maximum of 5% (95% of individuals observed to be within the LOA) was interpreted, as commonly assumed [37], as positive validation of the method of measurement. Assessment of the share of individuals classified into the same tertile and misclassified (classified into opposite tertiles) in the assessment of validity (Fol-IC-FFQ1 vs. 3-day record) and of reproducibility (Fol-IC-FFQ1 vs. Fol-IC-FFQ2). Calculation of the weighted κ statistic with linear weighting to indicate the level of agreement between the classifications into tertiles in the assessment of validity (Fol-IC-FFQ1 vs. 3-day record) and of reproducibility (Fol-IC-FFQ1 vs. Fol-IC-FFQ2). According to the criteria of Landis & Koch [38], values