International Journal of ChemTech Research CODEN (USA): IJCRGG ISSN : 0974-4290 Vol.1, No.3 , pp 677-689, July-Sept 2009
DEVELOPMENT AND VALIDATION OF TWO CHROMATOGRAPHIC STABILITY-INDICATING METHODS FOR DETERMINATION OF ROSUVASTATIN IN PURE FORM AND PHARMACEUTICAL PREPARATION Hasumati A. Raj*1, Sadhana J. Rajput2, Jayant B. Dave1 and Chaggan N. Patel1 1
Shri Sarvajanik Pharmacy College, Near Arvind baug, Mehsana 384001, Gujarat, India. 2
M. S. University, Faculty of Technology and Engineering, Pharmacy Department, Kalabhavan, Baroda 390001, Gujarat, India. *E-mail:
[email protected] Ph. No.: 09327770619
Abstract: Two new, simple, sensitive and accurate stability-indication methods were developed for quantitative determination of rosuvastain in the presence of its degradation products in raw material. The first is a High-Performance Liquid Chromatography (HPLC) method in which separation was achieved on Phenomenex C18 column (250 mm, i.d. 4.6 mm, 5 µm) using acetonitrile: 0.5 % formic acid (50 + 50, v/v) as the mobile phase at a flow rate of 1.0 mL/min at ambient temperature (22 – 27 °C) with ultraviolet detection at 248 nm over a concentration range of 5 – 300 µg/ml with mean recovery of 99.51 – 100.66 %. The second method is High-Performance Thin Layer Chromatography (HPTLC) in which the drug is separated form its acidic degradation products on silica gel 60F254 plates using ethylacetate: toluene: acetonitrile: formic acid (6 + 3.5 + 0.5 + 0.2 v/v/v/v) as the mobile phase with ultraviolet detection of the separated bands at 243 nm over a concentration range of 318 - 3816 ng/spot for rosuvastain with mean recovery 99.77-101.94 %. Both methods can analysis Rosuvastatin in bulk drug with intraday and interday precision of 0.23 – 0.87% and 0.29 – 0.84%, respectively for HPLC method and 0.48-0.93 % and 0.24-0.77 %, respectively for HPTLC method. Developed methods can apply for the estimation of three strength of NOVASTAT tablet manufacture by Lupin pharmaceuticals. Key Words: Rosuvastatin, stability indicating, HPLC, HPTLC.
Introduction:
Rosuvastain (ROSU), new member of a class of cholesterol-lowering drugs commonly referred to as “statins”, was approved in the U.S. in August 2003 for the treatment of dyslipidemia 1-3. ROSU is chemically bis [(E)-7-[4-(4-fluorophenyl)-6-isopropyl-2[methyl(methyl-sulfonyl) amino] pyrimidin-5-yl](3R, 5S)-3,5dihydroxyhept- 6-enoicacid] calcium salt. ROSU, a synthetic lipid-lowering agent, is a selective and competitive inhibitor of 3-hydroxy-3-methylglutarylcoenzyne A (HMG-CoA) reducates, the key rate-limiting enzyme of cholesterol biosynthesis in liver. Compared with several other HMG-CoA reducates inhibitors, ROSU does not appear to be metabolized significantly by cytochrome P450 3A42 and, therefore, may not possess the same potential for drug interactions as seen for some other statins e.g. lovastatin3 and simvastatin4.
A literature survey revealed that different analytical methods involving high-performance liquid chromatography5 (HPLC) for determination of ROSU in pharmaceutical formulations and in vitro metabolism study. High-performance thin layer chromatography6 (HPTLC) for separation and quantitation of simvastatin, Pravastatin sodium and rosuvastatin calcium. HPLCMS/MS7 and HPLC-MS8 for Pharmacokinetics and pharmacogenetics study of ROSU. HPLC9 method for determination of ROSU. Microbore HPLC-MS10 for detection of ROSU (CrestorTM) in human plasma was investigated. Spectrophotometric11 method for estimation in tablet formulation. LC-MS/MS12 method in combination with Fenofibric acid for estimation in human plasma. HPLC-MS13 method for estimation of ROSU in human plasma using atorvastatin as internal standard. International patent 027530 describe impurity profile
Hasumati A. Raj et al /Int.J. ChemTech Res.2009,1(3)
678
determination of ROSU by testing HPLC14. US patent 7244844 provides detatiled description how to synthesize degradation product and their use as reference standard15. Capillary Zone Elecrophoresis 16 method published for determination of ROSU in formulation. HPLC methods described for estimation of ROSU in reference have ammonia and phosphate as buffer in mobile phase preparation while in developed method have advantage of simple composition of mobile phase which can separate ROSU and its degraded product with in 15 min with good resolution. Only one HPTLC method was reported which can separated ROSU form other statin while developed HPTLC method have advantage it can separated ROSU from its acidic degraded product and estimated ROSU form its formulation. Also developed methods are precise, accurate, specific and sensitive stability indicating methods for estimation of ROSU in presence of its degradation products.
phase consisted of acetonitrile: 0.5 % formic acid (50 + 50, v/v) and was pumped at a flow rate of 1 mL/min. the mobile phase was filtered through a nylon 0.45 μm – 47 mm membrane filter and degassed before use. The elution was monitored by peak area at 248 nm, and the injection volume was 20 μL.
Experimental Apparatus A Shimadzu HPLC, Model: LC-10ATvp (Shimadzu) with rheodyne injector, UV-Visible detector, Model: SPD-10 AVP (Shimadzu) and class VP software. HPLC Column, C18 (size-250 x 4.60 mm, I.D-5 µ) (Phenomenex). Nylon filter 0.45 μm. PH meter (Thermo electro corporation). For HPTLC, Pre-coated silica gel aluminum Plate 60F–254 (20 × 10 cm with 250 µm thickness) (E. Merck). Desaga – 25 µl Dosing syringe (Hamilton Co., Reno, Nevada). Desaga – 100 µl Applicator syringe, GASTIGHT, Model 1701 (Hamilton, Bonaduz, Schweiz). Desaga Applicator with AS30win software. Desaga – Twin trough chamber (100 ´ 100) with stainless steel Lid. Desaga TLC scanner with Proquant software. Desaga Photo chamber with Providoc software with Canon power shot G5 digital camera. UV cabinet with dual wavelength UV lamp (254 nm and 366 nm). Drug was weighed on balance, Model ALC 210.4 (Acculab). Sonicator used was Ultra Sonicator (Fast Clean Ultrasonic Cleaner).
Reagents and Materials
Pharmaceutical grade of Rosuvastatin calcium (ROSU) reference standards were kindly supplied as gift samples by Torrent Research Center, Ahmadabad, India. HPLC grade Acetonitrile was purchased form S.D. Fine Chemicals Ltd. (Mumbai). The water for HPLC was prepared by triple glass distillation and filtered through a nylon 0.45 μm – 47 mm membrane filter (Gelman Laboratory, Mumbia, India). Sodium hydroxide, hydrochloric acid and 30 % Hydrogen peroxide was purchased from Qualigens Fine Chemicals (Glaxo Ltd.). AR grade Acetonitrile was purchase form ACS chemicals (Ahmedabad). Toluene, Ethlylacetate and formic acid were purchased form S. D. fine Chemicals Ltd. (Mumbai) and were of analytical grade.
Chromatographic conditions
(a) HPLC method. – A phenomenex C18 column was used at ambient temperature (22 – 27 °C). The mobile
(b) HPTLC method. – Solution of ROSU was applied to silica gel aluminum Plate 60F–254 (20 × 10 cm with 250 µm thickness) by means of Desaga automatic applicator equipped with a 25 µL syringe and operated with settings of band length, 3 mm; distance between bands, 5 mm; distance from the plate edge, 10 mm; and distance from the bottom of the plate, 15 mm. The plate was developed in a twin trough chamber previously saturated for 30 min with the mobile phase, ethylacetate: toluene: acetonitrile: formic acid (6 + 3.5 + 0.5 + 0.2 v/v/v/v). The spots on the air-dried plate were scanned with a Desaga TLC scanner and peak area was detected at 243 nm using the deuterium source.
Preparation of ROSU standard stock solutions (a) HPLC method. - ROSU (100 mg) was weighed accurately and transferred to 100ml volumetric flask. It was dissolved in 50 ml acetonitrile properly and diluted up to mark with acetonitrile to obtain final concentration of 1000 µg/ml.
(b) HPTLC method. – ROSU (100 mg) was weighed accurately and transferred to 100ml volumetric flask. It was dissolved in 50 ml methanol properly and diluted up to mark with methanol to obtain final concentration of 1000 µg/ml.
System Suitability Test System suitability test of the chromatographic system was performed before each validation run using five replicate injections of a standard solution. Theoretical plates, tailing factor and resolution were determined.
Method validation (a) Calibration curve (linearity of the HPLC method). – From the stock solution (1000 µg/ml), aliquots of 0.1, 0.5, 1, 1.5, 2, 2.5, and 3 ml were transferred to a series of 10 ml volumetric flasks. The volume was adjusted up to the mark with ACN to get final concentrations of 10, 50, 100, 150, 200, 250, and 300 µg/ml of solution. 20 µl of all these solutions were injected separately into HPLC column and the peak area of each solution was measured at selected wavelength.
(b) Calibration curve (linearity of the HPTLC method). –From the stock solution (1000 µg/ml) aliquots of 0.3, 0.6, 0.9, 1.8, 2.7 and 3.6 µl were spotted on the TLC plate under nitrogen stream using Desaga Applicator, AS30win. The calibration curves were plotted over a concentration range of 300 - 3600 ng/spot by plotting peak areas vs concentration. Each reading was the average of 5 determinations.
Accuracy (% Recovery)
The accuracy of the methods was determined by calculating recoveries by the standard addition method.
Hasumati A. Raj et al /Int.J. ChemTech Res.2009,1(3)
679
100 µg/ml of tablet solutions of ROSU was spiked by 50, 100 and 150 µg/ml of standard solutions for the HPLC method. 1000 µg/ml of tablet solutions of ROSU was spiked by 250, 500 and 1000 µg/ml of standard solutions from this 1 µl was spotted on TLC plate for the HPTLC method. The amounts were estimated by the regression equation of the calibration curve.
and transferred to 25 ml volumetric flask and dissolved with 5 ml of ACN and then the volume was made up to the mark with the solvent used for degradation. Putting 25 mg of drug to direct exposure to 80ºC temperature in stability oven and photo stability chamber. Samples were colleted at various stages from 0 min (as soon as sample was prepared) to 48 hrs of exposure to degradation condition. (b) HPTLC method. – Forced degradation study by HPTLC method was done in acidic condition only. 25 mg drug was accurately weighed and transferred to 25 ml volumetric flask. The drug was dissolved in 5 ml of methanol then diluted with concentrated HCl. The degradation was allowed to done at room temperature. Samples were colleted for analysis at three stages, at 0 min (as soon as sample was prepared), after 1 hrs and after 4 hrs of exposure to degradation condition for room temperature. Sample was applied by direct spotting of 1 μl on prewashed TLC plate.
Precision Repeatability
The intraday precision of the proposed methods were determined by estimating the corresponding responses 5 times on the same day for 3 different concentrations of 60, 120 and 240 µg/ml for the HPLC method and 500, 1500 and 2000 ng/spot for the HPTLC method. The results are reported in terms of percentage coefficient of variation (% C.V).
Intermediate Precision The interday precision of the proposed methods were determined by estimating the corresponding responses on 5 different day for 3 different concentrations of 60, 120 and 240 µg/ml for the HPLC method and 500, 1500 and 2000 ng/spot for the HPTLC method. The results are reported in terms of percentage coefficient of variation (% C.V).
Robustness
The robustness of the method was checked by repeatedly injecting (n = 5) standard solutions of 150 µg/ml in two C18 column one was made by phenomenex and one by hypersil for the HPLC method and by repeated scanning of the same spot (n = 5) of 400 ng/spot on aluminum based and class based silica gel plate without changing the position of plate for the HPTLC method.
Limit of Detection and Limit of Quantification
The limit of detection (LOD) and the limit of quantification (LOQ) of the drug were calculated using the following equations as per International Conference on Harmonization (ICH) guideline17. LOD = 3.3 x (X/ S) LOQ=10 x (X/S) Where X = the standard deviation of the response and S = the standard deviation of y-intercept of regression lines.
Procedure for Stress studies
(a) HPLC method. – Stress studies were carried out under the conditions of dry heat, hydrolysis, oxidation and photolysis, as mentioned in ICH Q1A (R2) 17. The approach suggested by Singh and Bakshi was adopted for these studies 18. The blank solution subjected to same stress conditions same manner as the drugs. Hydrolytic decomposition of ROSU was carried out in water at neutral pH 7 at room temperature and reflux at 80 °C, 0.5 N HCl at room temperature and 1 N HCl for reflux at 80 °C and 1 N NaOH at room temperature and reflux at 80 °C. Oxidation stress studies was performed in 30% H2O2 at room temperature and reflux at 80 °C. Photolytic studies was done in phtostability chamber by exposing the solid drug for 48 hrs. Studies were also conducted on solid drug, which was heated at 80ºC temperature in stability oven. Approximate 25 mg drug was weighed
Analysis of ROSU in tablet dosage form
Tablet containing 5, 10 and 20 mg of ROSU of brand NOVASTAT (manufactured by Lupin pharmaceutical, L0548, label claim: Each uncoated tablet contain 5 mg of Rosuvastatin, Mfg. 8/2006, Exp. 08/2008, L-0738, label claim: Each uncoated tablet contain 10 mg of rosuvastatin, Mfg. 6/2006, Exp. 06/2008, L-0184, label claim: Each uncoated tablet contain 20 mg of rosuvastatin, Mfg. 07/2006, Exp. 07/2008) were selected for the study. Twenty tablets were taken of each dose and average weight found. Powder was making by triturated 20 Tablets. The Tablet powder equivalent one Tablet content was transferred into a 100 ml volumetric flask containing 50 ml ACN, sonicated for 15 min and further diluted to 100 ml with ACN. The resulting solution was sonicated for 10 min and supernatant was filtered through whatman filter paper no.41. 20 µl of this solution was injected into HPLC column for two times and peak area was measured at 248 nm and average was considered for HPLC method. Same procedure for preparation of HPTLC test sample but in place of ACN methanol was used. 0.5 µl from this solution was spotted on the TLC plate in for three times under nitrogen stream using Applicator. The plate was dried in air, and then the plate was developed in Twin trough developing chamber (100 ´ 100) with stainless steel Lid, previously saturated with the mobile phase for 30 min. The plate was removed from the chamber, dried in air and was scanned and measure peak area at 243 nm in Reemission/Excitation mode with Desaga TLC scanner and average was taken for HPTLC method. The amount of ROSU in sample solution was determined by fitting the responses into the regression equation of HPLC and HPTLC, respectively.
Result and Discussion HPLC Method
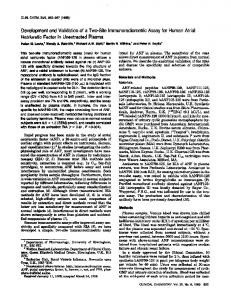
To optimize the HPLC parameters, several mobile phase compositions were tried. A satisfactory separation and good peak symmetry for ROSU was obtained with a
Hasumati A. Raj et al /Int.J. ChemTech Res.2009,1(3)
680
mobile phase consisting of acetonitrile: 0.5 % formic acid (50 + 50, v/v) to obtain better reproducibility and repeatability. Quantification was achieved with UV detection at 248 nm based on peak area. A complete resolution of the peaks with clear baseline separation was obtained (Figure 1).
low % C.V. values indicate the proposed methods are precise. Robustness. - The % C.V. values were found to be 0.059 % and 0.44 % using HPLC and HPTLC methods (Table 2, 6, 9) reveal that the proposed methods are robust. LOD and LOQ. – LOD and LOQ were found to be 0.0905µg/ml and 0.318µg/ml and 0.986 ng/spot and 2.682 ng/spot, respectively, using HPLC and HPTLC methods (Table 2). These data show that both methods are sensitive for the determination of ROSU. Assay of the Tablet Dosage Form (ROSU 5, 10 and 20 mg) The proposed validated methods were successfully applied to determine ROSU in their Tablet dosage form (NOVASTAT (Lupin)). The results obtained for ROUS were comparable with the corresponding labeled amounts (Table 3). Standard sample and test sample can be stored in refrigerator and used for 7 day.
HPTLC Methods
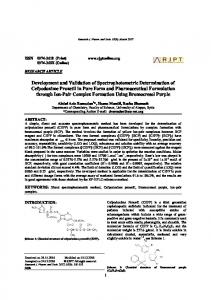
Several mobile phases were tried to accomplish good separation of ROSU and its degradation products. Using the mobile phase ethylacetate: toluene: acetonitrile: formic acid (6 + 3.5 + 0.5 + 0.2 v/v/v/v) and 20x20 cm HPTLC silica gel 60F254 aluminu backed plates; better separation was attained with 0.84 Rf values of for ROSU. A wavelength of 243 nm was used for the quantification of the drugs. Resolution of the peaks with clear baseline separation was found (Figure 2,3,4).
System Suitability Test The system suitability test of the chromatographic system was performed before validation run. The system suitability test is an integrated part of the analytical method and it ascertains the suitability and effectiveness of the operating system. The approximate results were reported in Table 1. The values for these parameters were satisfactory in accordance with the literature 17-22. The tests ensure that the chromatographic system generates safe results. Thus, it was established that the LC system and procedure are capable of providing acceptable quality data.
Validation of the Proposed Method
Linearity. – Linear correlation was obtained between peak areas and concetraitons of ROUS in the rang of 5 – 300 μg/ml and 318 - 3816 ng/spot, respectively, for HPLC and HPTLC methods. The linearity of the calibration curves was validated by the high value of correlation coefficients of regression (Table 2). Accuracy. – The recovery experiments were carried out by the standard addition method. The recoveries obtained were 99.51 – 100.66 % and 99.77 - 101.94 %, respectively, by HPLC and HPTLC (Table 2, 7, 10). The values of % assay range 99-102 indicated their is no any interference form excipient present in tablet formulation both HPLC and HPTLC methods are accurate and selective. Figure 5-1 shows that ROSU can well separate form its all type of degradation products so developed HPLC method is specific and selective for ROSU. Figure 2,4 and 12 indicated that ROSU can be well resolve by developed HPTLC method and can be separated form it acidic degradation product which indicated that developed HPTLC method is also selective and specific. Precision. Repeatability – The % C.V. values for intraday were found to be 0.23 – 0.87 % using HPLC method and 0.480.93 % using HPTLC method (Table 2, 5, 8). The low % C.V. values indicate the proposed methods are repeatable. Intermediate precision. – The % C.V. values for interday were found to be 0.29 – 0.84 % using HPLC method and 0.24-0.77 % using HPTLC method (Table 2, 5, 8). The
Degradation Behavior HPLC studies on the stressed solutions Seven degradation products were identified during degradation study of ROSU. The retention times (Rt), system suitability parameters and percentage degradation of ROSU were reported in Table 1. The degradation products carry the notations A, B, C, D, E, F and G in accordance with the sequence of degradation studies. HPLC studies of the stressed samples showed the following degradation behavior:
Hydrolytic conditions The drug showed 32 % degradation in 0.5N HCl at room temperature at 72 hrs and form three degradation products peak (Figure 5) at Rt 8.925, 11.825 and 11.667 with respect to A, B and C. The drug showed 52 % degradation in 1 N HCL for reflux for 5 hrs and four peaks were appeared at Rt 11.825, 11.667, 4.933 and 7.665 with respect to peaks B,C,E and F(Figure 6). But there is no hydrolysis of ROSU in alkaline and neutral conditions (Figure 7, 8).
Oxidative studies
In oxidative condition drug was exposure to 30 % H2O2 for room temperature it was converted in two degradation products and peak appeared at Rt of 8.925 and 10.200 with respect to peaks A and D (Figure 9(a)). Oxidation by reflux at 80°C drug was converted in to tow degradation products and peaks appeared at Rt 10.200 and 4.933 with respect to peaks D and E (Figure 9(b)). The drug showed very susceptible behavior towards oxidative stress and was completely converted in two products after exposes for oxidation by reflux for 5 hrs.
Photolytic studies Under light ROSU degrade in two peaks at Rt 8.925 and 10.200 (peaks A and D). As expose time increase degraded peaks area also increase so after long expose drug completely converted in degradation peaks A and D (Figure 10). When rosuvastatin calcium was exposed to visible light irradiation two degradation products were form which are diastereomeric cyclic products A and D
Hasumati A. Raj et al /Int.J. ChemTech Res.2009,1(3)
681
with the creation of an additional asysmmetric center in position 615.
ROSU on a C18 column, which could separate the drug and its degradation products formed under a variety of stress conditions. ROSU was found to be unstable in acidic, thermal and oxidative and photolytic condition, whereas it was comparatively much stable in neutral and alkaline hydrolysis. Percentage degradation of ROSU by various stress conditions was reported in Table 4. HPTLC method can selectively separated ROSU form its acidic degradation products. The results of the analysis of pharmaceutical dosage forms by the proposed methods are highly reproducible and reliable and are in good agreement with the label claim of the drug. The additives usually present in the pharmaceutical formulations of the assayed samples did not interfere with determination of ROSU by HPLC and HPTLC methods. The methods can be used for routine analysis of ROUS in pharmaceutical preparation and also it is hoped that this report on stability indicating method and degradation of ROSU would be helpful for the multiple generic manufacturers of the drug around the globe by saving them for unnecessary repetition of the same studies.
Solid – state studies
There was no significant degradation of solid ROSU on exposure to drug heat at 80 C for 72 hrs, but one minor degradation form at peak A (Rt 8.925), which indicated that the drug was susceptible to thermal stress (Figure 11).
HPTLC studies on the stressed solutions
An HPTLC study was carried out only for acidic conditions. When acidic hydrolysis products were spotted on TLC plate. ROSU was degraded in five minor products (Figure 12) out of five three main degradation products seen in Figure which also carry the notations A, B, C, D and E. Form this A, B and C is major degradation products. Around 88 % degradation was appeared in acidic hydrolysis. In which B and C is major product and after prolong exposer (Figure 13).
Comparison of the Proposed Methods
The assay result for ROSU in their dosage form obtained using HPLC and HPTLC methods were compared by applying the paired t-test. The calculated t-value of 0.79 is less than the tabulated t-value (4.60) at the 95% confidence interval. Therefore, there is no significant difference in a determined content of ROUS by the HPLC and HPTLC methods.
Acknowledgements:
The authors are thankful to Torrent Research Center, Ahmadabad, India, for providing standards sample of drug and also the Shri Sarvajanik Pharmacy College Mehsana for providing facilities to carry out work.
Conclusions
In this study, it was possible to develop a selective and validated stability indicating HPLC assay method for
Table 1: System suitability parameters of ROSU. Sr. No 1 2 3 4 5 6 7
System suitability parameters Retention time (minutes) Theoretical plates Resolution Asymmetry USP width Tailing Factor Capacity Factor
ROSU
Degradation products D E
A
B
C
F
G
6.742
8.925
11.825
11.667
10.200
4.933
7.675
8.025
2778.41
3392.23
4571.56
4822.53
3454.23
2678.30
2710.74
3984.84
7.28 1.08
3.90 1.09
4.92 1.43
2.31 1.21
8.77 1.13
7.58 1.31
2.34 1.02
1.70 1.12
1.32 0.91
3.06 1.10
4.38 1.38
1.11 1.20
3.64 1.15
1.24 1.30
0.49 0.93
0.71 1.07
1.96
0.77
1.63
4.30
1.16
0.81
3.15
3.15
Hasumati A. Raj et al /Int.J. ChemTech Res.2009,1(3)
Sr. No 1
682
Table 2: Summary of Validation parameters by HPLC with UV detection Parameters HPLC HPTLC Analytical wavelengths (nm)
248
243
5 - 300µg/ml
318 - 3816 ng/spot
Y = 74552xcon. +133679 0.9999
Y = 0.2392 x conc. + 137 0.9993
2
Linearity range
3
Regression equation
4
Correlation coefficient (r2)
5
Intercept
133679
137
6
Slope
74552
0.2392
7
% Assay
100.18 – 100.45%
102.93%
8
Precision Intra day % CV (n = 5)
0.23 – 0.87%
0.48-0.93 %
Inter day % CV (n = 5)
0.29 – 0.84%
0.24-0.77 %
Reproducibility of measurements %CV % Recovery
0.059
0.44
99.51 – 100.66 %
99.77-101.94 %
9
Limit of detection
0.0905µg/ml
0.986 ng/spot
10
Limit of quantification
0.318µg/ml
2.682 ng/spot
%C.V. calculated form five replication of readings Table 3: Estimation of ROSU in tablet by HPLC with UV detection HPLC HPTLC Labeled Tablet % Assay ± Amount Claim % Assay Amount found* Formulation S.D Found* (mg/tablet) ± S.D (mg/tablet) (mg/tablet) 5 5.09 100.18 ± 0.77 NOVASTAT 102.93 ± 10 10.02 100.21 ± 0.67 10.29 (Lupin) 0.38 20 20.09 100.45 ± 0.23 *Average of five readings SD = Standard deviation. Sr. No
Table 4: Percentage degradation of ROSU by force degradation Parameters (Stress condition ROSU /duration/state) Degradation products A
B
68
2
12
48 100
-
15
1
Neutral/H2Oat pH 7/48 h/ sol./RT Neutral/H2Oat pH 7/3 h/ sol./Ref.
100 100
2
Acidic/0.5 N HCl/72 h/ sol./RT Acidic/ 1 N HCl/5 h/ sol./Ref. Alkali/ 1N NaOH/48 h/ sol./RT Alkali/ 1N NaOH/4 h/ sol./Ref.
3 4
Oxidative/30% H2O2/48 h/ sol./RT
100 70
15
-
C D E F No degradation found No degradation found 17
-
-
-
32
17 8 12 No degradation found No degradation found 15 -
53 Oxidative/30% H2O2/5 h/ sol./Ref. 86 14 Thermal/80 C/48 h/solid/RT Photo/uv254 and Vis/366 nm/48 69 12 4 13 h/solid/RT RT is room temperature and Ref. is reflux at 80C temperature. h is hours for degradations 5 6
-
G
Total % Deg.
47 -
-
52
-
30
2
100 14 31
Hasumati A. Raj et al /Int.J. ChemTech Res.2009,1(3)
683
Table 5: Intraday and interday precision data of ROSU by HPLC Sr. Concentration Intraday Interday No. (µg/ml) RT* Peak area* %CV Peak area* 1 60 4660782 0.38 6.733 4653026 2 120 9314584 0.87 6.715 9316911 3 240 18544624 0.23 6.7495 18618309 *Average of five readings
%CV 0.48 0.29 0.84
RT* 6.733 6.733 6.715
T able 6: Robustness data of ROSU (150 µg/ml) by HPLC Hypersile Phenomenex C18 Column Peak Area* RT Peak Area* RT 11634504 6.817 11643812 6.715 150 µg/ml 11624421 6.733 11636055 6.7495 11636831 6.733 11635125 6.7495 0.059 0.58 0.67 0.15 %CV Table 7: Accuracy data of ROSU by HPLC with UV detection Quantity of std. Added (µg/ml)(B) Total Initial conc. Amount (A + B) (µg/ml)(A) 100 100 100 *Average of five readings
50 100 150
150 200 250
Peak Area Total quantity Found*± S.D.
%Recovery ± S.D
149.67 ± 0.48 201.32 ± 0.39 248.78 ± 0.29
99.78 ± 0.38 100.66 ± 0.54 99.512 ± 0.57
Table 8: Intraday and interday precision data of ROSU by HPTLC with UV detection Intraday Interday Sr. Concentration No. (ng/ml) Rf* Peak area* ± %CV Peak area* ± %CV S.D. S.D. 1 500 267 ± 0.39 0.93 0.38 267 ± 0.56 0.24 2 1500 763 ± 0.28 0.56 0.37 763 ± 0.67 0.77 3 2000 1057 ± 0.47 0.48 0.38 1055 ± 0.36 0.17 *Average of five readings Table 9: Robustness data of ROSU by HPTLC with UV detection (400 ng/spot) Time Peak Area Rf 192.64 0.37 Aluminum TLC plate 192.72 0.38 193.05 0.38 Glass TLC plate 192.14 0.37 194.00 0.37 192.91 0.38 0.69 0.12 S.D. 0.44 (1%) %CV *Average of five readings Table 10: Accuracy data of ROSU by HPTLC with UV detection %Assay Total quantity ± S.D Found Spott Mean ± S.D. Amount 750 749.98 ± 0.84 1000 1023.84 ± 0.47 1500 1503.08 ± 0.38 *Average of five readings
99.77 ± 0.33 101.94 ± 0.34 100.20 ± 0.35
Rf* 0.37 0.38 0.38
Hasumati A. Raj et al /Int.J. ChemTech Res.2009,1(3)
Figure 1: ROSU by HPLC with UV detection
Figure 2: ROSU by HPTLC method
Figure 3: 3D Spectra of ROSU by HPTLC method
684
Hasumati A. Raj et al /Int.J. ChemTech Res.2009,1(3)
Figure: 4: TLC plate of ROSU method (After detection)
Figure 5: Chromatograms of ROSU in 0.5 N HCl at room temperature
Figure 6: Chromatograms of ROSU in 1 N HCl at 0 min, 30 min,1 hr, 2 hr, 3 hr, 4 hr and after 5 hrs reflux at 80°C
685
Hasumati A. Raj et al /Int.J. ChemTech Res.2009,1(3)
Figure 7: Chromatograms of base hydrolysis in 1 N NaOH (a) at room temperature (b) reflux at 80°C
Figure 8: Chromatograms of neutral (H2O) (a) at room temperature and (b) reflux at 80°C
Figure 9: Chromatograms of oxidative in 30% H2O2 (a) room temperature and (b) reflux at 80°C
686
Hasumati A. Raj et al /Int.J. ChemTech Res.2009,1(3)
Figure 10: Chromatograms of Thermal-degraded ROSU
Figure 11: Chromatograms of photlolytic degradation of ROSU
Figure 12: HPTLC Chromatogram of ROSU and its acidic degradation in UV detection.
687
Hasumati A. Raj et al /Int.J. ChemTech Res.2009,1(3)
688
Figure 13: Overlain HPTLC Chromatogram of ROSU and its acidic degradation products.
References: 1. Brown W. V., Bays H. E., Hassman D. R., McKenney J., Chitra R., Hutchinson H., Miller E., Rosuvastatin Study Group. Efficacy and safety of rosuvastatin compared with pravastatin and simvastatin in patients with hypercholesterolemia: a randomized, doubleblind, 52-week trial, Am. Heart J., 2002, 144(6), 1036-1043. 2. Olsson A. G., McTaggart F., Raza A. Rosuvastatin: a highly effective new HMG-CoA reductase inhibitor, Cardiovasc. Drug Rev., 2002, 20(4), 303-328. 3. New drug to lower cholesterol, FDA Consum, 2003, 37(6), 3. 4. Martin P. D., Mitchell P.D., Schneck D. W., Pharmacodynamic effects and pharmacokinetics of a new HMG-CoA reductase inhibitor, rosuvastatin, after morning or evening administration in healthy volunteers, Br. J. Clin. Pharmacol., 2002, 54(5), 472-477. 5. Pasha M. K., Muzeeb S., Basha S. J., Shashikumar D., Mullangi R., Srinivas N. R., Analysis of five HMG-CoA reductase inhibitorsatorvastatin, lovastatin, pravastatin, rosuvastatin and simvastain: pharmacological, pharmacokinetic and analytical overview and development of a new method for use in pharmaceutical formulations analysis and in vitro metabolism studies, Blomed. Chromatogr., 2006, 20, 282-293. 6. Bharat G. C., Natvarlal M. P., Paresh B. S., Determination of Simvastatin, Pravastatin
7.
8.
9.
10.
11.
12.
Sodium and Rosuvastatin Calcium in Tablet Dosage Forms, Ind. J. Phar. Sci., 2007, 130 -132. Hull C. K., Martin P. D., Warwick M. L., Thomas E., Quantification of the N-desmethyl metabolite of rosuvastatin in human plasma by automated SPE followed by HPLC with tandem MS detection, J. Pharm. Biomed. Anal., 2004, 35, 609-614. Lee E., Ryan S., Birmingham B., Zalikowski J., March R., Ambrose H., Moore R., Lee C., Chen Y., Schneck D., Rosuvastatin pharmacokinetics and pharmacogenetics in white and Asian subjects residing in the same environment, Clin. Pharmacol. Ther., 2005, 78, 330-341. Jamil S., Ansari T. A., Sing R. M., Mathur S. C., Nivoria C. S., Pandey M. K., Sing G. N., Determination of rosuvastatin calcium by RPHPLC method, Indian Drugs, 2005, 42, 98-101. 0udhoff K. A., Sangster T., Thomal S. E., Wilson L. D., Application of microbore HPLC in combination with tandem MS for the quantification of rosuvastatin in human plasma, J. Chromatogra. B, 2006, 832, 191-196. Ansari T. A., Jamil S., Sing R. M., Mathur S. C., Kumar Y., Sing G. N., Specroscopic estimation of rosuvastatin calcium in tablet formulation, Indian Drugs, 2005, 42, 244-245. Ravi T., Raja R. K., Ramesh M., Nuggehally R S., Simultaneous determination of rosuvastatin and fenofibric acid in human plasma by LC– MS/MS with electrospray ionization: Assay development, validation and application to a clinical study, J Phar. Bio. Ana., 2005, 39, 3-4, 661-669.
Hasumati A. Raj et al /Int.J. ChemTech Res.2009,1(3)
689
13. Sonu S. S., Kuldeep S., Harshvardhan P., Mallish J., Hiten S., Sapna G., Purav T., Nimesh P., Prakash S., Lohray B. B., Estimation of Rosuvastatin in Human Plasma by HPLC Tandem mass Spectroscopic method and its Application to Bioequivalence Study, J. Braz. Chem. Soc, 2005, 16, 4, 723-726. 14. International paten 027530, Teva pharmaceutical industries ltd. Pub. 03/17/2005. 15. US paten 7244844, Teva pharmaceutical Ltd. Pub. 07/17/2007. 16. Suslu I., Celebier M., Altinozz S., Determination of Rosuvastatin in Pharmaceutical Formulations by Capillary Zone Electrophoresis., Chromatographia, 2007, 66, 1, 65-72. 17. International Conference on Harmonization (ICH) of Technical Requirements for Registration of Pharmaceuticals for Human Use (1996) Guideline on Validation of Analytical
Procedure-Methodology, ICH, Geneva, Switzerland International Conference on Harmonization (ICH) of Technical Requirements for Registration of Pharmaceuticals for Human Use (2003) Guideline on Validation of Analytical Procedure-Methodology, ICH, Geneva, Switzerland Singh S., Bakshi M. Pharm. Technol., 2005, 24, 1 –14. Snyder L. R., Kirkland J. J., Glaich J. L., Practical HPLC method development and validation, 2nd edn. Wiley, New York, 1997, 765 Linday S. High performance liquid chromatography, 2nd edn. Wiley, New York, 1992, 337 FDA, center of Drug Evaluation and Research. Reviewer guidance: validation of chromatographic methods, Rockville, MD. 1994.
*****
18.
19. 20. 21. 22.