RESEARCH ARTICLE ISSN 2278 –2818
DEVELOPMENT AND VALIDATION OF UV-SPECTROSCOPIC METHODS FOR THE ESTIMATION OF ALCAFTADINE IN BULK AND ITS OPHTHALMIC DOSAGE FORM Priyanka R. Mishra†1, Priyal Inamdar1, Preya Jamdar1, Nivedita Patel1, Minal Rohit1, Dinesh Satone2, Dhananjay B. Meshram1 ABSTRACT Development of simple, specific, precise and accurate UV-Visible Spectroscopic methods for the estimation of Alcaftadine in bulk and its ophthalmic dosage form. Two methods were developed for the analytical estimation of Alcaftadine. Methanol was used as a solvent. Method A, Absorption maxima method, where, λmax was found to be 282 nm. Method B, First derivative spectroscopy, where, the response dA/dλ of standard solution was measured at 267 nm. The developed method was validated for linearity, accuracy, precision, specificity, LOQ and LOD. The methods were linear in Beer’s range 1-16 µg/ml. The correlation coefficient was found to be 0.999 for method A and 0.997 for method B. The % assay for Alcaftadine in ophthalmic formulation was found to be 101.01% and 112.5% respectively by absorption maxima method and first derivative spectroscopy method respectively. The values of % RSD values within acceptable ranges revealed that the developed methods are precise and accurate. The methods were found to be simple, precise, linear and accurate and can be employed for routine quality control analysis of Alcaftadine in bulk drug as well as ophthalmic dosage forms. KEYWORDS: Alcaftadine, Absorption maxima, First derivative INTRODUCTION
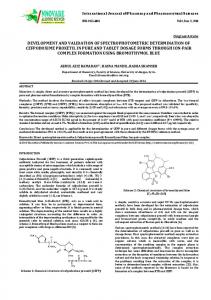
Figure 1.
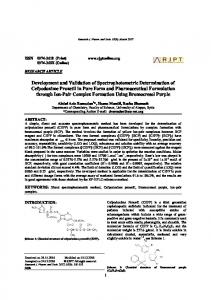
Spectroscopy is the measurement and interpretation of electromagnetic radiation absorbed, scattered or emitted by atoms, molecules, or other chemical species. This absorption or emission is associated with changes in the energy states of the interacting chemical species and, since each species has characteristic energy states, spectroscopy can be used to identify the interacting species [1]. Chemically Alcaftadine is 6, 11-dihydro-11-(1-methyl-4piperidinylidene)-5H-imidazo [2, 1-b] [3] benzazepine-3carboxaldehyde (Figure 1). Alcaftadine is a broad-spectrum antihistamine displaying a high affinity for histamine H1 and H2 receptors and a lower affinity for H4 receptors. It also exhibits modulatory action on immune cell recruitment and mast cell stabilizing effects. It acts by inhibiting release of histamine from mast cells. The drug was approved by USFDA in July 2010. It is commercially marketed under the name LASTACAFT [2-4].
Structure of Alcaftadine
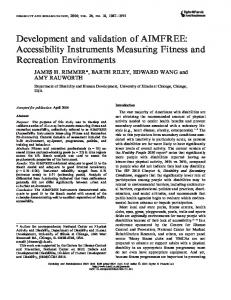
Moreover the metabolic fate of 14 C- Alcaftadine was studied by high performance liquid chromatography-based separation of parent compound from metabolites [5]. Figure 2.
Selection of absorption maxima of Alcaftadine
A literature survey on Alcaftadine showed that no proposed analytical method was reported for analytical determination of Alcaftadine in bulk drug and its ophthalmic dosage form. However, clinical pharmacological review report was found during the survey in which liquid chromatography with tandem mass spectrometry (LC/MS/MS) was used to quantitate concentrations of Alcaftadine and R90692 (active metabolite) in K3 EDTA human plasma [4]. The aim of the present work is to develop two simple, precise and accurate UV- spectroscopic methods for the determination of Alcaftadine in bulk drug and its application to the ophthalmic solution. The analytical method for Alcaftadine is not officially available in any pharmacopoeia. Therefore an attempt was made to develop analytical spectroscopic methods which can be employed for routine analysis of Alcaftadine. The developed method
1Pioneer Pharmacy Degree College,
Near Ajwa Cross Road, N. H. 8, Ajwa Nimeta Road, Post Sayajipura, Vadodara 390019, Gujarat, India. 2Department of Pharmaceutical Sciences, RTM Nagpur University Nagpur ϯCorresponding author:
[email protected]
FS J Pharm Res | 2015 | Vol 4 | No 1
14
Mishra et al.
Preparation of working standard solution The standard stock solution of 50 µg/ml was suitably diluted with methanol to get working standard solutions of concentrations 1, 4, 8, 12, 16 µg/ml. These solutions were scanned in the wavelength range of 200 – 400 nm.
was validated for linearity, accuracy, and precision, limit of detection and limit of quantification. Table 1.
Linearity range of Alcaftadine
Concentration (μg/ml) 1 4 8 12 16 Regression equation Correlation coefficient Figure 3.
Method A Mean Absorbance at 282 nm± SD 0.090±0.0 0.330±0.001 0.668±0.001528 1.023±0.001528 1.362±0.001
Method B Absorbance at 267 nm± SD 0.002±0.0 0.009±0.0 0.018±0.0 0.027±0.0 0.035±0.0
Y = 0.085x - 0.004
Y = 0.002x + 0.000
0.999
0.997
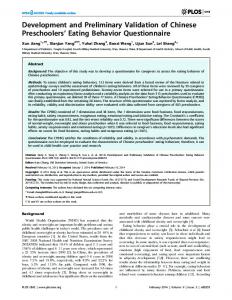
Selection of wavelength The standard solution of 10 µg/ml was scanned in the wavelength range of 200 – 400nm. The λmax was found to be 282nm (Figure 2). Method A: Absorption maxima method [6] The standard stock solution of 50 µg/ml was prepared from 1000 µg/ml standard stock solution. This was further diluted with methanol to get working standard solutions in increasing concentration range, (i.e. 1 – 16 µg/ml). These were scanned in the wavelength range of 200 – 400 nm. The absorption at λmax 282 was recorded. The calibration curve was plotted with concentration v/s absorbance and the regression equation was calculated. The overlain spectra and the calibration curve is shown in Figure 3 and 4 respectively.
Overlain spectra of Alcaftadine
Method B: First order derivative spectroscopy [6-8] The first order derivative spectra of Alcaftadine showed response dA/dλ at 267 nm. Then calibration curve was plotted by constructing concentration v/s response dA/dλ at 267 nm. The respective figures are shown in Figures 5 - 7. Figure 4. MATERIALS AND METHODS
1.6
Materials and instruments Digital precision balance (ATX 224), UV-visible spectrophotometer (SHIMADZU-1800). Alcaftadine API was procured from JHP Pharmaceuticals LLC and the marketed formulation of Alcaftadine was procured from MediPrime Pharmacy, Dubai. Methanol was procured from Sulab Chemicals, distilled water. Table 2.
Absorbance
1.2
Repeatability (n=6) Intra-day precision (n=3) Inter-day precision (n=3)
Conc. of drug (µg/ml)
% RSD Method A
8
0.173
0.0
4, 8, 12
0.125 – 0.388
0.0
0.126 – 0.389
0.4
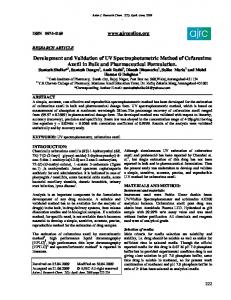
y = 0.0852x - 0.0044 R² = 0.9998 0
Method B
4, 8, 12
0.8
0
Precision studies of Alcaftadine
Precision
Calibration curve of Alcaftadine by Method A
5
10 Concentration
15
20
Validation of the developed methods [9, 10] Specificity The specificity of the method was determined by checking the interference of placebo with analyte. Also to evaluate interference from blank (placebo), or impurities present in the drug matrix and identify the specific absorbance of the drug. Figure 5.
First order derivative spectrum of Alcaftadine
0.0
Methods Preparation of standard stock solution 10mg drug was accurately weighed and transferred into a 10 ml volumetric flask, dissolved in methanol and diluted with the same solvent l to make the standard stock solution of 1000 µg/ml. The stock solution was diluted sufficiently to make concentration of 50 µg/ml.
FS J Pharm Res | 2015 | Vol 4 | No 1
15
pubs.fonscientia.com/archives/jpharmres
Table 3.
Accuracy studies of Alcaftadine
Recovery level (%)
Amount present (µg/ml)
Amount spiked (µg/ml)
Total amount of drug (µg/ml)
80
5
1.4
6.4
100
5
3
8.0
120
5
4.6
9.6
Linearity The linearity was evaluated by analyzing different concentrations of Alcaftadine. From the standard stock solutions of 1000 µg/ml, appropriate dilutions were made in methanol to prepare range of 1-16 µg/ml. Absorbances of these solutions were measured at 282 nm for method A. The derivative spectra were recorded at 267 nm (Method B). The correlation coefficient was found to be 0.999 and 0.997 for Methods A and B respectively. Table 4.
Method Labeled amount (mg/ml) Amount found (mg/ml) % Label claim± SD Assay (n=3)
B
2.5
2.5
2.5
2.81
101.016 ± 0.642
112.5 ± 0.0
% RSD
A
1.43
102.63
0.185
B
1.50
106.57
0.000
A
3.02
100.50
0.398
B
3.50
100.00
0.000
A
4.51
98.10
0.404
B
5.0
97.65
0.000
Spectrophotometric characteristics of Alcaftadine
Parameters
Method A
Method B
Wavelength
282 nm
267 nm
Beer’s range
1 – 16 µg/ml Y = 0.085x – 0.004
1 – 16 µg/ml Y = 0.002x + 0.000
0.999
0.997
0.004
0.000
Slope Sandell’s Sensitivity (g/cm2/0.001 absorbance unit) LOD (µg/ml)
0.085
0.002
0.06
0.5
0.022
0.95
LOQ (µg/ml)
0.067
2.88
Correlation coefficient Intercept
Precision Repeatability The precision of the instrument was checked by repeated scanning and measurement of the absorbance of 8 µg/ml Alcaftadine standard solution (n = 6) without changing the parameters for the method.
Analysis of marketed formulation For estimation of ophthalmic solution of Alcaftadine, LASTACAFT (3 ml) containing 2.5 mg/ml of Alcaftadine, 1 ml was withdrawn and diluted to 10 ml with methanol to obtain stock solution of 2500 µg/ml. From the above stock sufficient dilutions were made using methanol to make the final concentration of 50 µg/ml. The working standard 8 µg/ml was prepared from the above stock to estimate concentration of Alcaftadine in ophthalmic solution. For method A, the concentration of Alcaftadine was determined by measuring absorbances of sample solutions at 282 nm (λmax of Alcaftadine). In method B, i.e. first order derivative spectroscopy, the concentration of Alcaftadine was determined by scanning the sample solution and taking the derivative spectra that showed response dA/dλ at 267 nm. The estimated amount of drug in marketed formulation is given in Table 4.
Intermediate Precision It can be assessed by intra-day and inter-day analysis. The intraday and inter-day precision of the proposed methods were performed by analyzing the corresponding responses 3 times on the same day and on different days. Concentrations of standard solutions of Alcaftadine selected were (4, 8, 12 µg/ml). Accuracy The accuracy studies were carried out by spiking of standard at three different concentrations i.e. 80, 100, and 120 % of the working standard solution (8 µg/ml). The percent recovery was evaluated using the formula: % Recovery = A-B/C where, A = Total Amount of Drug Estimated (mg); B = Amount of Drug Found on Pre Analyzed Basis (mg); C = Amount of Bulk Drug Added (mg) FS J Pharm Res | 2015 | Vol 4 | No 1
Mean % recovery
Regression equation
Eye Drops A
Amount recovered (µg/ml)
Table 5.
Assay of the marketed formulation
Formulation
Metho ds
Limit of detection (LOD) and limit of quantification (LOQ) LOD and LOQ were calculated by application of the formula; LOD = 3.3σ / S LOQ = 10 σ / S where, σ = Standard Deviation of Response; S = Slope of Calibration Curve 16
Mishra et al.
Table 6.
Results and summary of validation Results
Parameters Linearity (µg/ml) Precision Repeatability (n = 6) Inter-day precision (n = 3) Intra-day precision (n = 3) Accuracy (n = 3) 80% 100% 120%
Method A
Method B
1-16 (µg/ml)
1-16 (µg/ml) % RSD
0.173 0.125-0.388 0.126-0.389
0.0 0.0 0.0
% recovery
%RSD
Method A
Method B
Method A
Method B
102.63 100.50 98.10
106.57 116.40 108.52
0.185 0.398 0.404
0.0 0.0 0.0
RESULTS AND DISCUSSION
proved the efficacy of the methods. The results are summarized in Table 4.
Specificity In order to evaluate interference from matrix components or impurities, specificity was performed. The blank sample i. e. placebo did not show any interference (Figure4).
Limit of Detection and Limit of Quantitation The results of LOD and LOQ are summarized in Table 5. The spectrophotometric characteristics of Alcaftadine and results of validation parameters are summarized in Table 5 and Table 6 respectively.
Linearity The absorbance was found to have a direct relationship with the concentration of the drug. The correlation coefficient (r2) for method A was found to be 0.999 (Figure 5) and for method B, 0.997 (Figure 6). The regression line equation was calculated by plotting a graph of concentration Vs absorbance for method A and concentration Vs first derivative response for method B. The linearity data are presented in Table 1.
CONCLUSION The proposed spectroscopic methods were found to be linear in the concentration range of 1-16μg/ml for all the three methods. The correlation coefficient was found to be 0.999 for method A and 0.997 for method B. The estimation of Alcaftadine in marketed formulation by the proposed methods was found to be reliable and reproducible. The method can be employed for routine analysis of Alcaftadine in ophthalmic dosage form.
Precision Repeatability Repeatability was evaluated by analyzing six replicates of the standard drug of 8µg/ml. % RSD was calculated.
ACKNOWLEDGEMENT
Intra-day precision Intra-day precision was evaluated by estimating response of three replicates each for three different concentrations i. e. 4, 8 and 12 µg/ml on the same day by both the methods.
The authors are heartily thankful to Shri D. D. Patel President, Om Gayatri Education and Charitable Trust and Pioneer Pharmacy Degree College for their valuable guidance and support. Authors are thankful to the JHP pharmaceuticals, LLC for providing the drug sample and the Management of Pioneer Pharmacy Degree College for providing necessary research facilities.
Inter-day precision Intraday precision was evaluated by estimating response of three replicates each for three different concentrations i.e. 4, 8 and 12 µg/ml on the different days by both the methods. The results of precision studies are summarized in Table 2.
REFERENCES
Accuracy (Recovery studies) The percent recovery of Alcaftadine was found in the range of 98.10 – 102.63 % by method A; 100.50 – 104.32 % by method B and 97.65 – 106.57 % by method C. Three replicates were analyzed for recovery studies. The results of accuracy are summarized in Table 3.
[1]
[2]
Analysis of the marketed formulation The assay was carried out for the estimation of Alcaftadine in the marketed formulation by the proposed methods. The results of the assay were found to be reliable and hence FS J Pharm Res | 2015 | Vol 4 | No 1
[3]
17
Beckett, A. H., Stenlake, J. B. Practical Pharmaceutical Chemistry, 4th ed.; CBS Publishers and Distributors, India, 2007. Alcaftadine 0.25% ophthalmic solution (Lastacaft) National PBM Drug Monograph http://www.pbm.va.gov/PBM/clinicalguidance/dru gmonographs/Alcaftadine_Drug_Monograph.docx. (Last reviewed on 25th March 2015). CHEMISTRY REVIEW http://www.accessdata.fda.gov/drugsatfda_docs/nd
pubs.fonscientia.com/archives/jpharmres
[4]
[5]
[6]
a/2010/022134s000ChemR.pdf (Last reviewed on 16th March 2015). CLINICAL PHARMACOLOGY REVIEW http://www.fda.gov/downloads/Drugs/Developme ntApprovalProcess/DevelopmentResources/UCM22 3817.pdf (last reviewed on 11th March 2015). Bohets , H.; McGowan, C.; Mannens, G.; Schroeder, N.; Edwards-Swanson, K.; Shapiro A. Clinical pharmacology of Alcaftadine, a novel antihistamine for the prevention of allergic conjunctivitis. J. Occul. Pharmacol. Ther, 2011, 27, 187-95. Rathod, D.; Dole, M.; Sawant, S. Spectrophotometric determination of Glipizide in bulk and tablet dosage form by Absorption maxima, first derivative spectroscopy and Area under curve. Asian J. Pharm. Clin. Res., 2012, 5, 102-104.
FS J Pharm Res | 2015 | Vol 4 | No 1
[7]
Acharjya, S.; Rao, B.; Kumar, R.; Annapurna, M. UV Spectroscopic method for the determination of Zolmitriptan in bulk and pharmaceutical dosage form. J. Adv. Sci. Res., 2011, 2, 42-47. [8] Deosarkar, A.; Deshpande, S.; Walode, S. Quantitative estimation of Carbimazole in UV derivative spectrophotometry in bulk drug and tablet formulation. Amer. J. Pharm. Tech. Res., 2012, 2, 678-685. [9] International Conference on Harmonization (ICH), Validation of Analytical Methods: Definitions and Terminology, ICH Q2A, 1994. [10] International Conference on Harmonization (ICH), Validation of Analytical Procedures: Text and Methodology, Q2 (R1), 2005.
18
Mishra et al.