Development of a Cascade Processing Method for Microarray Spot Segmentation Antonis Daskalakis1, Dionisis Cavouras2, Panagiotis Bougioukos1, Spiros Kostopoulos1, Ioannis Kalatzis2, George C. Kagadis1, and George Nikiforidis1 1
Department of Medical Physics, School of Medicine, University of Patras, Rio, GR-26503 Greece 2 Medical Signal and Image Processing Lab, Department of Medical Instrumentation Technology,Technological Education Institution of Athens, Ag. Spyridonos Street, Aigaleo, 122 10, Athens, Greece
[email protected]
Abstract. A new method is proposed for improving microarray spot segmentation for gene quantification. The method introduces a novel combination of three image processing stages, applied locally to each spot image: i/ Fuzzy C-Means unsupervised clustering, for automatic spot background noise estimation, ii/ power spectrum deconvolution filter design, employing background noise information, for spot image restoration, iii/ Gradient-Vector-Flow (GVF-Snake), for spot boundary delineation. Microarray images used in this study comprised a publicly available dataset obtained from the database of the MicroArray Genome Imaging & Clustering Tool website. The proposed method performed better than the GVF-Snake algorithm (Kullback-Liebler metric: 0.0305 bits against 0.0194 bits) and the SPOT commercial software (pairwise mean absolute error between replicates: 0.234 against 0.303). Application of efficient adaptive spot-image restoration on cDNA microarray images improves spot segmentation and subsequent gene quantification.
1 Introduction Complementary DNA (cDNA) microarray imaging is considered as an important tool for large-scale gene sequence and gene expression analysis [1]. Molecular biologists and bioinformaticians are using microarray technology, not only for identifying a gene in a biological sequence but also for predicting the function of the identified gene within larger systems, such as the human organism. Three basic stages are involved in microarray analysis namely experimental design, image processing, and gene quantification [2]. Initially, the DNA obtained from the genes of interest (targets) is printed on a glass microscope slide by a robotic arrayer, thus, forming circular spots of known diameter. Each spot serves as a highly specific and sensitive detector (probe) of the corresponding gene [3]. In order to create a genome expression profile of a biological system with microarrays, the messenger RNA (mRNA) from a particular sample is isolated, it is labeled using Cy3 (green) and Cy5 (red) fluorescent dyes, and it is J. Martí et al. (Eds.): IbPRIA 2007, Part I, LNCS 4477, pp. 410–417, 2007. © Springer-Verlag Berlin Heidelberg 2007
Development of a Cascade Processing Method for Microarray Spot Segmentation
411
hybridized on the microarray. Following hybridization, the arrays are scanned by activation using lasers that excite each dye on the appropriate wavelength. The relative fluorescence between each dye on each spot is then recorded using methods contingent upon the nature of the labeling reaction i.e. confocal laser scanners, and Charged Couple Devices. The output of such systems is two 16-bit TIFF images, one for each fluorescent channel. The relative intensities of each channel represent the relative abundance of the DNA or RNA product in each of the two DNA or RNA samples and are extracted via image analysis techniques, namely griding, spot segmentation, and intensity extraction [2]. Griding is the process of assigning coordinates to each cell; the latter is a square ROI containing the pixels of both the spot and its background. Segmentation, classifies cell-pixels as foreground (spot-pixels) or background. Intensity extraction calculates ratios of red to green fluorescence intensities for the foreground and background respectively. Finally, molecular biologists translate the extracted expression levels to a biological conclusion (i.e. clustering genes with similar expression level, identifying differentially expressed genes etc.) using data mining techniques. Extraction of gene expression levels is confounded by a number of technical factors, which operate during the fabrication, target labeling, and hybridization stages. Microarray images are corrupted by spatially inhomogeneous noise and by irregularities in the shape, size, and position of the spot [4]. Another source of degradation is due to noise and characteristics (Modulation Transfer Function) of the confocal laser scanner, employed as “reading” method. These sources of error, lead to inaccurate segmentation of spots (i.e. the boundaries of spots are erroneously estimated), which, as a direct effect, it evokes wrong estimation of the genes expression levels. Consequently, the precision of the extracted microarray intensities is affected causing inaccurate biological inferences [5]. Despite the potential importance of image pre-processing in correcting these error sources, existing software tools pay little attention to pre-processing and focus mainly on spot localization and microarray image segmentation. Additionally, only a few studies [6-10], most using wavelet transform methods, have examined the impact of image pre-processing upon spot enhancement, without however investigating the impact on segmentation. Latest research on general image enhancement has shown that α-rooting based techniques may be of value, since they perform better than wavelet based methods [11, 12]. Nevertheless, image enhancement focuses on modifying selectively the frequency content of images rather than removing the usual sources of spot-image degradation, i.e. biological and electronic noise as well as blurring due to the MTF of the confocal laser scanner. These sources of error may be alleviated by modeling the image degradation functions to design efficient image restoration algorithms that would render the distinction between spot and background more evident, thus, making the segmentation stage more accurate. This has led us to construct a cascade processing segmentation (CPS) method for microarray spot boundary delineation, which incorporates the benefits of image restoration into the spot segmentation procedure. Consequently, the aim of the present study is to propose a new method, which combines 1/the Fuzzy C-means clustering algorithm, for automatically locating spot background area and assessing local noise, 2/the power spectrum filter (PS-filter), designed using background noise information, for
412
A. Daskalakis et al.
enhancing individual cell images, and 3/the GVF-Snake boundary detection algorithm, for spot segmentation and gene quantification.
2 Material and Methods Material consisted of 7 microarray images downloaded from a publicly available database of the MicroArray Genome Imaging & Clustering Tool (MAGIC) website [13]. Each image contained 6400 spots investigating the diauxic shift of Saccharomyces cerevisiae. In the particular dataset the authors [14] used a common reference messenger RNA pool (green, Cy-3) to control for biological variability. Such a design provides an adequate degree of replication, required for the quantitative assessment of image segmentation and subsequent gene quantification. The proposed CPS method comprised clustering-restoration-segmentation stages that were sequentially applied on each cell image. 2.1 Clustering Prior to spot segmentation, a griding procedure was applied on the images, following the method proposed in a previous study [15] for locating spot sites (cell images). Following griding, individual spots were segmented from surrounding background by unsupervised segmentation, using the Fuzzy C-Means algorithm [16]. The latter is an iterative clustering algorithm, which finds cluster centers (centroids) that minimize the dissimilarity function c
J (U , c1 , c2 ,..., cc ) =
c
n
i =1
j =1
∑ J = ∑∑ u i
i =1
m ij
d ij
2
(1)
where ci is the centroid of cluster i , d is the Euclidean distance between i-th centroid ij
(ci) and j-th data point and m ∈ [1, ∞ ] is a weighting exponent. During iteration the algorithm modifies the cluster centers and changes the data memberships (in our case spots or background) until the dissimilarity function is locally minimized. Subsequently, from each segmented cell-image, local noise (2 × σ 2 ) [17] was assessed from the spot’s background. This parameter was used to restore each cell image of the microarray image by employing the power spectrum image deconvolution technique. 2.2 Cell Image Restoration Power spectrum image deconvolution incorporates both the degradation function and statistical characteristics of noise into the deconvolution process as in (2): Fˆ (u , υ ) =
⎡ ⎢ ⎣
Fh(u , υ )
2
Fh (u , υ ) + 2 × σ 2
2
⎤ ⎥ ⎦
G (u , υ ) Fh (u , υ )
(2)
Development of a Cascade Processing Method for Microarray Spot Segmentation
413
where Fh is the Fourier transform of the degradation function, considered constant across the image, and G is the Fourier transform of the degraded cell image. Subsequently, the restored cell image in the spatial domain is obtained by the inverse Fourier transform of (2). The Fourier transform of the degradation function Fh in (2) was modeled as a low pass Butterworth filter: Fh
LP
2 n ⎛ ⎛ ν ⎞ (ν ) = ⎜ 1 + 0 . 4 1 4 ⎜ ⎟ ⎜ ⎝ f co ⎠ ⎝
⎞ ⎟ ⎟ ⎠
−1
(3)
where n is the degree of the filter, v is the frequency, and f co the cut-off frequency [17]. The 2-dimensional Fh was then obtained by (4)
Fh(u , v ) = Fh
LP
(
u +ν 2
2
),
u +ν 2
2
≤N
(4)
where, N is the maximum dimension of the cell-image (which is zero-padded in the case of non-square cell image), and u,v are spatial frequencies. All algorithms were implemented using Matlab custom-made code. 2.3 Cell Image Segmentation Following restoration, the GVF-Snake boundary detection algorithm [18] was applied on each cell image. Since intensities in the processed cell images were altered by the deconvolution process, all spot boundary points were referred to the original cellimages. Additionally, the GVF-Snake algorithm was applied on the original images alone and segmentation results, obtained by both methods, were evaluated by applying the Kullback-Liebler (K-L) measure of divergence [19], as described below. 2.4 Benefit Quantification Foreground (spot) and background intensity values for the common reference channel (green, Cy-3) were extracted. Those values were used to form two density distributions employing a non- parametric kernel density estimation method [20]. The distance between those two distributions was determined employing the KullbackLiebler (K-L) measure of divergence, shown in (6): KL( P || Q ) = ∑ P (i ) log i
P (i ) Q (i )
(5)
where P and Q,i are the spot and background density distributions respectively. Higher values of divergence, correspond to well separable distributions of signal and background and, consequently, to more accurate segmentation results [19]. Additionally, in order to quantify the efficiency and robustness of the proposed CPS-Method, we calculated the pairwise mean absolute error (MAE) between the
414
A. Daskalakis et al.
replicates (altogether 21 pairwise MAE values) for the common reference channel. Extracted intensities, for the same series of microarray images, were comparatively evaluated against the intensities obtained from SPOT [21], a publicly available software package, utilizing the Seeded Region Growing segmentation technique.
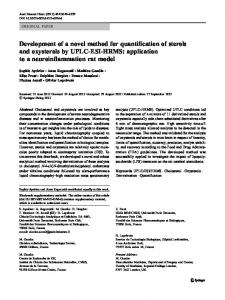
3 Results Forty randomly selected cell-images from a microarray image were separately segmented by both the proposed CPS method and the GVF-Snake algorithm. In the CPS method, the image degradation function was optimally designed by a first degree (n=1) low-pass Butterworth filter using fco=0.3xN, with N being the dimension of the square cell image. Figure 1, shows the result of the cell restoration step.
Fig. 1. Original and image restored sections of microarray images for the optimally designed degradation function
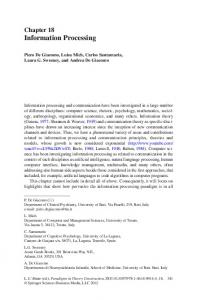
Figure 2 shows the segmentation for five spots (top row) by the GFV-snake algorithm (middle row) and the CPS-method (bottom row).
Fig. 2. Segmentation comparison of GVF-Snake algorithm (second row) and the proposed CPS method (third row)
Table 1 shows the Kullback-Liebler (K-L) divergence values obtained by the proposed CPS method and the GVF-Snake algorithm for five different microarray cell images. K-L values were obtained by referring segmented boundary points onto the original cell images.
Development of a Cascade Processing Method for Microarray Spot Segmentation
415
Table 1. Kullback-Liebler measure of divergence for GVF-Snake and CPS methods: Divergence values (measured in bits) between segmented spot’s signal and background intensities, calculated on the original image for both methods
Spot 1 Spot 2 Spot 3 Spot 4 Spot 5
GVF-Snake 0.0449 0.0182 0.0217 0.0126 0.0194
CPS 0.0510 0.0278 0.0270 0.0150 0.0305
Figure 3 shows the calculated pairwise MAEs between the expression ratios of all possible pairs of the common reference channel for the dataset of the 7 replicated real images.
Fig. 3. Boxplots for CPS-Method (Mean Value: 0.234) and SPOT (Mean Value: 0.303)
4 Discussion In the present study a CPS method was designed that suitably combined 1/the Fuzzy C-means clustering algorithm, for automatically locating spot background area and assessing local noise, 2/the power spectrum filter (PS-filter), designed using background noise information, for enhancing individual cell images, and 3/the GVFSnake boundary detection algorithm, for spot segmentation and gene quantification. The success of the proposed CPS method is mostly due to the automatic restoration of the cell image, which took into account background noise information of the cell image. This may be observed in the restored image of Figure 1, where edges appear sharp and with well defined outline. The segmentation results of both methods were evaluated by the Kullback-Liebler divergence metric (Table 1). Accordingly, it was found that the proposed CPS method performed better by increasing the divergence (K-L) between the distributions of signal and background intensity distributions, as compared to the GVF-Snake method. Results were obtained by superimposing
416
A. Daskalakis et al.
boundary points on the original cell images. In this way, higher divergence was attributed to better segmentation of the actual spot image from its surrounding background. Exploiting the benefits of the provided replication in the real images, we explored the efficiency and robustness of the extracted gene expression levels by measuring the ‘sameness’ of replicates using their pairwise MAE (totally 21 pairwise MAE values). Figure 3 illustrates the boxplots of MAE as they were calculated for the common reference channel of the 7 replicated microarray images. Lower MAE is indicative of higher segmentation performance and, thus, of more accurate (valid) extraction of gene expression levels. The proposed method achieved better results (0.234) than the publicly available software (0.303). This may be due to the employment by the proposed CPS-method of the automatic local restoration step. Regarding processing time, it was estimated that it took about half a second for the CPS method to delineate the boundary of a cell spot. This may seem computationally intensive and time consuming as compared to commercial software. However, the proposed method may be beneficial when accuracy is of importance and this is the case of primary concern in microarrays. Optimization of the developed Matlab code is a future concern that will minimize processing time, and subsequently will provide a fast and accurate way to determine gene expression levels in microarray images. Acknowledgments. This work was supported by a grant form the General Secretariat for Research and Technology, Ministry of Development of Greece (136/PENED03) to B.A.
References 1. Alizadeh, A., Eisen, M., Botstein, D., Brown, P.O.: Staudt, L.M.: Probing lymphocyte biology by genomic-scale gene expression analysis. J. Clin. Immunol. 18, 373–379 (1998) 2. Angulo, J., Serra, J.: Automatic analysis of DNA microarray images using mathematical morphology. Bioinformatics. 19, 553–562 (2003) 3. Schena, M.: Microarray biochip technology. 1st edn. Eaton Publishing Company (2000) 4. Balagurunathan, Y., Wang, N., Dougherty, E.R., Nguyen, D., Chen, Y., Bittner, M.L., Trent, J., Carroll, R.: Noise factor analysis for cdna microarrays. J. Biomed Opt. 9, 663–678 (2004) 5. Ahmed, A.A., Vias, M., Iyer, N.G., Caldas, C., Brenton, J.D.: Microarray segmentation methods significantly influence data precision. Nucleic Acids Res. 32, 50 (2004) 6. Wang, X.H., Istepanian, R.S., Song, Y.H.: Microarray image enhancement by denoising using stationary wavelet transform. IEEE Trans Nanobioscience 2, 184–189 (2003) 7. Lukac, R., K.N., P., B., S., Venetsanopoulos, A.N.: Cdna microarray image processing using fuzzy vector filtering framework. Journal of Fuzzy Sets and Systems: Special Issue on Fuzzy Sets and Systems in Bioinformatics (2005) 8. Mastriani, M., Giraldez, A.E.: Microarrays denoising via smoothing of coefficients in wavelet domain. International Journal of Biomedical Sciences 1, 1306–1316 (2006) 9. Lukac, R., Smolka, B.: Application of the adaptive center-weighted vector median framework for the enhancement of cdna microarray. Int. J. Appl. Math. Comput. Sci. 13, 369–383 (2003)
Development of a Cascade Processing Method for Microarray Spot Segmentation
417
10. Daskalakis, A., Cavouras, D., Bougioukos, P., Kostopoulos, S., Argyropoulos, C., Nikiforidis, G.C.: Improving microarray spots segmentation by k-means driven adaptive image restoration. In: Proceedings of the ITAB Ioannina, Greece (2006) 11. Arslan, F.T., Grigoryan, A.M.: Alpha-rooting image enhancement by paired splittingsignals. In: Proceedings of the 3rd IEEE International Symposium on Biomedical Imaging: from Macro to Nano,ISBI, Arlington, VA, pp. 968–971 (2006) 12. Arslan, F.T., Moreno, J.M., Grigoryan, A.M.: New methods of image enhancement. In: Proceedings of the SPIE, the International Conference of SPIE Defense and Security Symposium, Orlando, FL, pp. 225–236 (2005) 13. http://www.bio.davidson.edu/projects/MAGIC/MAGIC.html. Available: via the INTERNET. Accessed 14. DeRisi, J.L., Iyer, V.R., Brown, P.O.: Exploring the metabolic and genetic control of gene expression on a genomic scale. Science 278, 680–686 (1997) 15. Blekas, K., Galatsanos, N., Likas, A., Lagaris, I.: Mixture model analysis of DNA microarray images. IEEE Trans. Med. Imaging 24, 901–909 (2005) 16. Bezdec, J.C: Pattern recognition with fuzzy objective function algorithms. ed. Plenum Press, New York (1981) 17. Gonzalez, R.C., Woods, R.E.: Digital image processing 1st edn. (1992) 18. http://iacl.ece.jhu.edu/projects/gvf/. Gradient flow vector active contours. Available: via the INTERNET. Last accessed: 02/02/2007 19. Kullback, S.: Information theory and statistics, 2nd edn. Dover Publications, Mineola, NY (1968) 20. Bowman, A.W., Azzalini, A.: Applied smoothing techniques for data analysis. Oxford University Press, Oxford (1997) 21. Yang, Y.H., Buckley, M., Dudoit, S., Speed, T.: Comparison of methods for image analysis on cdna microarray data. J.Comput.Graph Stat. 11, 108–136 (2002)