A1.1 CVs of (a) oxygen saturated 0.1M TBATFSI in DME on a GC working electrode at ... A1.4 Reaction scheme for the Oxygen reduction reaction on a Li-O2.
INVESTIGATION OF THE OXYGEN REDUCTION REACTION AT THE LITHIUMOXYGEN CELL CATHODE
BY SHRIHARI SANKARASUBRAMANIAN
DEPARTMENT OF CHEMICAL AND BIOLOGICAL ENGINEERING
Submitted in partial fulfillment of the requirements for the degree of Doctor of Philosophy in Chemical Engineering in the Graduate College of the Illinois Institute of Technology
Chicago, Illinois December 2016
© Copyright Shrihari Sankarasubramanian December 2016
ACKNOWLEDGEMENT
This thesis document is the culmination of an eight-year journey, a journey in embryo even as I stepped into my undergraduate university, that progressed in steps big and small, that saw me confidently tell my sophomore year Chemical process calculations professor that I would have a PhD by the time I was 25 and which truly came into its own as I stepped into Prof. Prakash’s lab at Illinois Tech in the Fall of 2012. As I look back at the four year of undergrad and further four years of grad school, I see all my mentors, friends and well-wishers with nostalgia and profound gratitude. Prof. Jai Prakash, my research advisor, guide and guru melds the rigorous electrochemical investigative traditions exemplified by him and his PhD advisor, Prof. Ernest Yeager, with a flair for bringing out the innate curiosity and instilling a can-do attitude in his students. The wide latitude he gave me to explore my interests and lead investigations into my research problem as I thought best along with his steadfast support and knack for stepping in with sage advice as I got stuck, is a cherished memory from my time as a PhD student. I owe him my profoundest gratitude. I thank my PhD committee members, Profs. Vijay Ramani, Victor Perez-Luna, Krishna Pagilla, Adam Hock and Sohail Murad for their incisive questioning and excellent advice over the course of my PhD studies. Toyota Research Institute of North America (TRINA) supported most of my PhD work. The discussions and insight I gained from interactions with Drs. Fuminori Mizuno, Nikhilendra Singh, Kensuke Takechi of TRINA guided and shaped my thinking on
iii
Lithium-air cells. Their friendly spirit of collaboration along with a rigorous eye for the science have shaped my own scientific outlook and method. Along the way, numerous graduate students, postdocs, professors and friends have influenced my journey. Drs. Mayandi Ramanathan and Aadil Benmayza initially mentored and trained me in the use of all the lab equipment and introduced me to the culture of our lab. They, along with Drs. Seonbaek Ha and Jeong-Wook Seo shared the many trials, tribulations and triumphs of our shared research enterprise at the Center for Electrochemical Science and Engineering (CESE) at Illinois Tech and provided me with scientific support and friendly camaraderie. Dr. Javier Parrondo has always been a fount of sane advice on both research and life. My other labmates and colleagues, in no particular order, Minsuk Jung, Sukhwan Yun, Amod Kumar, Venkateshkumar Prabakaran, Yue Li, Lihui Wang, Yunzhu Zhang, Zhongyang Wang, Guanxiong Wang, Cheng He, Yang Liu, Anchal Jain, Yanxin Li all deserve my deepest thanks. This journey would not have been possible without the help of Dr. Karthick Gourishakar of GE global research. He has been my mentor since my undergraduate studies and continues to be a source of sincere advice. Finally, I owe a lifelong debt of love and gratitude to my parents, Venkatachalam Sankarasubramanian and Alamelu Govindan and my sister, Subashri. They have always been behind me in all my endeavors as my biggest cheerleaders, bulwarks of support and finally, source of unconditional love. Thank you.
iv
TABLE OF CONTENTS
Page ACKNOWLEDGEMENT LIST OF TABLES LIST OF FIGURES
iii
...................................................................................................
vii
................................................................................................. viii
LIST OF SYMBOLS ABSTRACT
.......................................................................................
...............................................................................................
xi
............................................................................................................. xiii
CHAPTER 1. INTRODUCTION ..........................................................................................1 2. DENSITY FUNCTIONAL THEORY (DFT) MODELLING OF THE OXYGEN REDUCTION REACTION ON NOBLE METAL (Pt, Au, Pd), Pt3M (M=Fe, Co, Ni, Cu) AND Pd3M (M=Fe, Co, Ni, Cu) ALLOY SURFACES, FOR Li-O2 CELLS ..................................................................3 2.1 Introduction .........................................................................................3 2.2 The oxygen reduction reaction (ORR) mechanism ............................7 2.3 Density functional theory (DFT) calculations ....................................9 2.4 Results and discussion ......................................................................17 2.5 Conclusions .......................................................................................29 3. KINETIC INVESTIGATION OF THE APROTIC SUPEROXIDE RADICAL ELECTROCHEMISTRY ON MULTI-CRYSTALLINE SURFACES AND CORRELATION WITH DENSITY FUNCTIONAL THEORY MODELING ................................................................................31 3.1 3.2 3.3 3.4
Introduction ......................................................................................31 Experimental methods .....................................................................34 Results and Discussion ....................................................................36 Conclusions ......................................................................................55
4. KINETIC INVESTIGATION OF THE OXYGEN REDUCTION REACTION AT THE LITHIUM-AIR CELL CATHODE –
v
UNDERSTANDING THE REACTION MECHANISM AS A GUIDE TO RATIONAL BATTERY DESIGN ...............................................
56
4.1 Introduction .......................................................................................57 4.2 Materials and methods ......................................................................59 4.3 Results and discussion ......................................................................60 4.4 Conclusions .......................................................................................79 5. EFFECT OF WATER ON THE OXYGEN REDUCTION REACTION IN AN OXIDATIVELY STABLE, ETHER BASED IONIC LIQUID ELECTROLYTE FOR LITHIUM OXYGEN CELLS.................................81 5.1 Introduction .......................................................................................81 5.2 Materials and methods ......................................................................82 5.3 Results and discussion ......................................................................83 5.4 Conclusions .......................................................................................89
APPENDIX A. DIFFUSION COEFFICIENT MEASUREMENT AND KINETIC MODEL DEVELOPMENT ..........................................................................91 BIBLIOGRAPHY .........................................................................................................
vi
96
LIST OF TABLES
Table
Page
2.1 Optimized lattice constants of the various surfaces and reaction intermediate binding energies. The binding energies tabulated are for the strongest binding site and orientation. The lower the value of the binding energy, the stronger is its adsorption .....................................14 2.2 Reaction free energies for the first and second lithiation steps used to calculate the surface activity. The larger of the two reaction free energies is taken to be the activation energy on that substrate and used to calculate activity ............................................................................... 15 2.3 Parameters used in the calculation of the pre-factor (Af). ............................ 17 4.1 Effect of the solvent basicity on the oxygen reduction reaction kinetics. The relation between the Gutmann donor number, transfer coefficient, solvent reorganization energy and reduction peak potential is examined ............................................................................ 78
vii
LIST OF FIGURES
Figure
Page
2.1 (a) The postulated mechanism of Li-O2 ORR, including the effect of surface binding energies on reaction routes. (b) schematic of the possible adsorption orientations considered – (i) Pauling (end-on), (ii) Yeager (bridge), (iii) Griffith (side-on)..................................................... 6 2.2 (a) Molecular structures used in the calculations; (b) Structure of various surfaces used for calculation; (iii) Typical FCC(111) unit cell for noble metals and alloys, (iv) Various adsorption sites and adsorbed species orientation (EO:=End-on, SO:=Side-on) .......................... 11 2.3 Volcano plots of 2-electron ORR Catalytic activity calculated from DFT modelled free energy of reaction – (a) Noble metals (Pt, Pd, Au) and carbon basal plane, (b) Skin alloys of Pt, (c) Skin alloys of Pd. ..................................................................................................19 2.4 Screening of high activity substrates for the 1-electron ORR mechanism. Weaker binding (higher binding energy) is preferred .............. 22 2.5 Screening of high activity substrates for the 2-electron and 4electron ORR mechanism – (a) Activity vs. Relative Binding Energy of LiO2, (b) Activity vs. Relative Binding Energy of Li2O2, (c) Activity vs. Relative Binding Energy of Li2O. .......................... 23 2.6 EBinding (Li2O2) on - (a) Preferential binding sites, (b) correlation between site size and binding energy. ........................................ 27 2.7 Influence of the dopant on EBinding (Li2O2). ............................................. 28 3.1 Reaction scheme for the Oxygen reduction reaction in a Li-air cell. ....................................................................................................................... 35 3.2 Cyclic Voltammograms of O2 saturated 0.1M TEAClO4 in DMSO on Glassy Carbon (GC), Pt and Au working electrodes. The scan rates are: 50mVs-1 (dashed line), 100mVs-1 (dotted line), 500mVs-1 (solid line). ......................................................................... 38 3.3 Glassy carbon Disk currents recorded at a scan rate of 5mVs-1 in O2 saturated 0.1M TEAClO4 in DMSO. Ring currents recorded with the Pt ring held at 3.35V vs Li/Li+ ....................................................... 41
viii
3.4 Pt Disk currents recorded at a scan rate of 5mVs-1 in O2 saturated 0.1M TEAClO4 in DMSO. Ring currents recorded with the Pt ring held at 3.35V vs Li/Li+ ................................................................................. 42 3.5 Au Disk currents recorded at a scan rate of 5mVs-1 in O2 saturated 0.1M TEAClO4 in DMSO. Ring currents recorded with the Pt ring held at 3.35V vs Li/Li+. ................................................................................ 43 3.6 (i) Koutecky-Levich plots for oxygen reduction on (a) glassy carbon, (b) Pt, (c) Au in O2 saturated 0.1M TEAClO4 / DMSO solution (ii) Representative Tafel plots for oxygen reduction at 900 RPM on (a) glassy carbon, (b) Pt, (c) Au in O2 saturated 0.1M TEAClO4 / DMSO solution.......................................................................... 44 3.7 N(iD/iR) vs ω-1/2 plots for oxygen reduction on (i) glassy carbon, (ii) Pt, (iii) Au in O2 saturated 0.1M TEAClO4 / DMSO solution .............. 49 3.8 iL/(iL-iD) vs. ω-1/2 plots for oxygen reduction on (i) glassy carbon, (ii) Pt, (iii) Au in O2 saturated 0.1M TEAClO4 / DMSO solution.......................................................................................................... 50 3.9 Rate constants for the one electron oxygen reduction reaction to form the superoxide radical in the kinetic controlled region ........................ 52 3.10 (i) ORR polarization curves on GC, Pt and Au in O2 saturated 0.1M TEAClO4 in DMSO at a scan rate of 5mVs-1and RDE rotation rate of 1600 RPM; (ii) Surface activity vs. percentages of superoxide radicals detected at ring and (iii) ORR onset potential vs. percentages of superoxide radicals detected at ring ................................ 54 4.1 (a) CVs of 0.1M LiTFSI in DME on a Glassy Carbon (GC) working electrode (i) Scans in an O2 saturated and Ar saturated electrolyte solutions; (ii) Scans in an O2 saturated electrolyte solution over various voltage windows. (b) LSVs on a rotating ring-disk electrode with a GC disk and Pt ring in an oxygen saturated solution of 0.1M LiTFSI in DME.................................................. 61 4.2 Proposed reaction scheme for the Oxygen reduction reaction on a Li-O2 cell cathode and schematic of its elucidation using a Rotating ring-disk electrode (RRDE). .......................................................... 64 4.3 ORR on glassy carbon disk in an oxygen saturated 0.1M LiTFSI in DME solution (a) Koutecky-Levich plots; (b) (iD/iR)N vs. ω1/2 plots; (c) J vs. S plot ;(d) Plots of iL/(iL-iD) vs. ω-1 .............................. 66 ix
4.4 Elementary reaction rate constants as a function of potential....................... 71 4.5 (a) Tafel plots from potentiostatic, point-by-point measurements showing anomalous Tafel behavior. (b) Scan rate independent cyclic voltammograms of oxygen saturated 0.1M LiTFSI in DME on a GC working electrode; (c) Arrhenius plot of rate constants from polarization curves at 25ᵒC, 40ᵒC, 50ᵒC ............................................... 75 5.1(a) CV of O2 saturated anhydrous DEMETFSI on GC working electrode at a scan rate of 50mVs-1; (b) CV of O2 saturated, water saturated DEMETFSI on GC working electrode at a scan rate of 50mVs-1; (c) LSVs on GC disk recorded at a scan rate of 10mVs1 in O2 saturated anhydrous DEMETFSI (d) LSVs on GC disk recorded at a scan rate of 10mVs-1 in O2 saturated, water saturated DEMETFSI ...................................................................................................85 5.2(a) Koutecky-Levich plots for oxygen reduction on GC in O2 saturated anhydrous DEMETFSI.; (b) Koutecky-Levich plots for oxygen reduction on GC in O2 saturated, water saturated DEMETFSI.; (c) Rate constants for the oxygen reduction reaction in the kinetic controlled region. ....................................................................88 A1.1 CVs of (a) oxygen saturated 0.1M TBATFSI in DME on a GC working electrode at various scan rates; (b) oxygen saaturated 0.1M LiTFSI in DME on a GC working electrode at various scan rates ........................................................................................................... 91 A1.2 LSVs of (a) oxygen saturated 0.1M TBATFSI in DME on a GC working electrode at various scan rates; (b) oxygen saaturated 0.1M LiTFSI in DME on a GC working electrode at various scan rates ............................................................................................................ 92 A1.3 Nicholson-Shain plots for the oxygen saturated 0.1M TBATFSI in DME and oxygen saaturated 0.1M LiTFSI in DME ............................. 93 A1.4 Reaction scheme for the Oxygen reduction reaction on a Li-O2 cell cathode ................................................................................................ 94
x
LIST OF SYMBOLS
Symbol
Definition
𝜙𝑟
Potential at the reaction plane, V
A
Activity, eV Area, m2
Af
Arrhenius type pre-factor, s-1
C
Concentration, mol m-3
D
Diffusion coefficient, m2 s-1
DN
Gutmann donor number, KJ mol-1
E
Potential, V
E0
Equilibrium potential, V
EBinding
Binding energy, eV
F
Faraday’s constant, c mol-1
GC
Glassy carbon
i
Current, A
i0
Exchange current, A
j
Current density, A m-2
k
Rate constant, (mol m-3)1-n s-1
kB
Boltzmann constant, eV K-1
ML
Monolayer
N
RRDE collection efficiency
OER
Oxygen evolution reaction
ORR
Oxygen reduction reaction
R
Ideal gas constant, J (mol k)-1
RDE
Rotating disk electrode
RRDE
Rotating ring-disk electrode
T
Temperature, K
TE
Total energy, eV xi
ZPE
Zero-point energy, eV
ΔE
Energy change, eV
ΔG
Free energy change, eV
ΔS
Entropy change, eV K-1
𝛼
Transfer coefficient
𝛽
Symmetry factor
𝜆
Solvent reorganization energy, KJ mol-1
𝜇
Reduced mass
𝜈
Kinematic viscosity, m2 s-1
𝜎
Collision cross section, m2
𝜔
RDE/RRDE rotation rate, RPM
xii
ABSTRACT
Development of Li-O2 cells, which could possibly provide ~3 times the capacity of conventional Li-ion cells, depends on a fundamental understanding the oxygen reduction reaction (ORR) at the cathode. This abstract summarizes the application of ab initio density functional theory (DFT) calculations and electrochemical measurements in conjunction with kinetic modeling to elucidate the mechanism of the ORR in the Li-O2 cell. First principles, density functional theory (DFT) modeling of the ORR on noble metal (Pt, Au, Pd), Pt3M (M=Fe, Co, Ni, Cu) and Pd3M (M=Fe, Co, Ni, Cu) alloy surfaces, was carried out. Periodic models of close-packed (111) surfaces were constructed, their geometry was optimized and the most stable geometric surface configuration was identified. The correlation between the intermediate species binding energy and the favored reaction pathway from amongst 1e-, 2e-, and 4e- mechanisms was studied by calculating the binding energies of a 1/4 monolayer of O, O2, LiO, LiO2, Li2O2, and Li2O on various sites and orientations. The reaction free energies (ΔGrxn) were calculated and used to compute the catalytic activity of the surfaces using molecular kinetics theory. Plots of the catalytic activity vs. Oxygen binding energy (EBinding
(O))
showed a typical “volcano”
profile. The insights gained from this study can be used to guide the choice of cathode catalysts in Li-O2 cells. The mechanism and kinetics of the ORR was investigated in 0.1M LiTFSI/DME on a glassy carbon (GC) electrode in an oxygen saturated solution of 0.1M Lithium bistrifluoromethanesulfonimidate (LiTFSI) in Dimethoxyethane (DME) using cyclic voltammetery (CV) and the rotating ring-disk electrode (RRDE) technique. A xiii
comprehensive reaction scheme considering disproportionation both on the cathode surface and the electrolyte bulk to form Li2O2 was proposed and the data from the RRDE measurements was used along with an electrochemical kinetics model to evaluate the corresponding rate constants. The surface disproportionation reaction was found to dominate the kinetics of the ORR and the model was found to be able to explain experimental observations regarding the cell discharge products. Further, the widely reported anomalous Tafel behavior was observed over the course of these studies. Highly accurate, potentiostatic, point-by-point measurements of the kinetic current were carried out and a scan rate independent evaluation of the corresponding transfer coefficient from a calculated, dimensionless CV was made. The measured transfer coefficient was explained invoking the Marcus-Hush-Levich quadratic model rather than the linearized ButlerVolmer empirical law. Thus, these studies provides a comprehensive account of the ORR mechanism, direct evidence of the surface disproportionation reaction being dominant and explain the widely reported (and previously unexplained) anomalous Tafel behavior in LiO2 cells.
xiv
1 CHAPTER 1 INTRODUCTION
Renewable energy is the future. Scientific consensus on long-term anthropogenic climate change and its immediate manifestation as extreme weather events, which are increasing in number and scale, calls for reducing and eventually eliminating the emission of greenhouse gases. Reconciling this with the societal ideal of improving the human condition, which is most easily achieved by sustained and equitable economic growth, calls for a radical shift in the energy production, usage and distribution paradigm. The economic health of a nation has been shown to be directly correlated to its level of energy consumption [Kra78]. Thus the developed nations of the world, concentrated mostly in Europe and North America have the largest carbon dioxide emissions. Also, it is no coincidence that greenhouse gas emissions from large and rapidly developing countries such as China and India have increased in line with their economic growth. And, given the vast size of the African continent, its rate of population growth and the needed corresponding increase in economic growth and opportunities, the emission of greenhouse gases will increase under the current energy paradigm. Thus the rapid development and deployment of Solar, wind, tidal and other renewable energy sources is the major engineering goal facing humanity. One key challenge in the deployment of most renewable energy sources is their intermittent nature. This calls for energy storage technologies such as chemical batteries or mechanical contraptions such as flywheels, pumped storage hydro stations and so forth. In terms of size and hence energy density chemical batteries are far and away the best choice
2 for energy storage and hence a tremendous amount of research effort has been expended on developing and refining electrochemical energy storage technologies. Amongst electrochemical storage technologies Lithium batteries hold a special place. Lithium, with an atomic number of 3 and atomic weight of 6.94 is the lightest metal. This light weight means that batteries that operate by cycling lithium achieve very high energy densities. The “Rocking Chair Technology”, intercalation based lithium ion batteries first commercialized by Sony in 1991 have achieved ubiquity in consumer electronics, and increasing in automobiles and stationary storage applications. Technologies such as Lithium-Sulfur and Lithium-Oxygen cells have been demonstrated to achieve practical specific energy of 400 Wh Kg-1 and 500 Wh Kg-1 respectively [Bru11]. Theoretically, the Lithium-Oxygen cell which incorporates the lightest possible with an external “fuel” such as oxygen has the highest possible specific energy of 3500 Wh Kg-1. Even accounting for the weight of O2 storage tanks or possible air filtration systems its practical specific energy is estimated to be between 500-1000 Wh Kg-1 [Chr12]. This tremendous potential has led to keen interest in developing a practical Lithium-Oxygen and eventually a true Lithium-Air cell. The present thesis examines the oxygen reduction reaction (ORR) at the Lithium-Oxygen cell cathode in various electrolytes, uses Density functional theory to predict catalyst candidate for the ORR, correlates the calculated surface
binding
energies
to
the
experimental
superoxide
electrochemistry,
comprehensively examines the kinetics of the ORR in a Lithium containing electrolyte and finally, examines the ORR in the an oxidatively stable ionic liquid in the presence of water. The various techniques used are examined in detail in the corresponding chapters.
3 CHAPTER 2 DENSITY FUNCTIONAL THEORY (DFT) MODELLING OF THE OXYGEN REDUCTION REACTION ON NOBLE METAL (Pt, Au, Pd), Pt3M (M=Fe, Co, Ni, Cu) AND Pd3M (M=Fe, Co, Ni, Cu) ALLOY SURFACES, FOR Li-O2 CELLS
First principles, density functional theory (DFT) modeling of the oxygen reduction reaction (ORR) on noble metal (Pt, Au, Pd), Pt3M (M=Fe, Co, Ni, Cu) and Pd3M (M=Fe, Co, Ni, Cu) alloy surfaces, was carried out. Periodic models of close-packed (111) surfaces were constructed, their geometry was optimized and the most stable geometric surface configuration was identified. The correlation between the intermediate species binding energy and the favored reaction pathway from amongst 1e-, 2e-, and 4e- mechanisms were studied by calculating the binding energies of a 1/4 monolayer of O, O2, LiO, LiO2, Li2O2, and Li2O on various sites and orientations. The reaction free energies (ΔGrxn) were calculated and used to compute the catalytic activity of the surfaces using molecular kinetics theory. Plots of the catalytic activity vs. Oxygen binding energy (EBinding (O)) showed a typical “volcano” profile. The insights gained from this study can be used to guide the choice of cathode catalysts in Li-O2 cells.
2.1
Introduction The rechargeable Li-O2 cell presents great potential as a high energy
electrochemical energy storage system due to a high theoretical specific energy of 3505 Wh Kg-1 which is significantly higher than current lithium-ion cells [Bru11]. In the context of transportation, of particular interest is the fact that, with the specific energy of today’s automotive Li-ion cells at 105 Wh kg-1 at the pack level, driving range is limited to about 70 miles for a 200 kg pack [Chr12]. On the other hand, the Li-O2 cells with an estimated
4 practical specific energy in the range of ~500-900 Wh kg-1 can potentially lead to electric vehicles with a driving range approaching ~550 km (340 miles) between charging sessions [Bru11]. To achieve practical application as a replacement for Li-ion cells, current Li-O2 cells must overcome the problems of (i) poor cycle life, (ii) high charge and discharge overpotentials which result in low coloumbic efficiency and low power density [Lu10]. The poor cycle life reported in many studies can be traced to the oxidative instability of the electrolyte [Lu10, Fre11a, Fre11b] in conjunction with electrode passivation due to irreversible product deposits and the difficulty in decomposing Li2O2. The high overpotentials are also a consequence of the stability of the peroxide product. The early theoretical picture of the oxygen reduction reaction (ORR) at the cathode envisioned a Li2O2 covered surface after the initial cycle, and further ORR as occurring on the deposited Li2O2 [Hum10]. Density functional theory (DFT) studies suggesting such mechanisms have predicted large overpotentials in accordance with the experimental observations [Vis13]. However, the issue of electron transfer across the poorly conducting peroxide layer despite low conductivity had to be explained using mechanisms such as dband bending [Hum10] and poloron hopping [Gar13]. This picture of an electrode surface which does not influence the ORR, was at odds with experimental evidence which suggested that the surface played a crucial role in the ORR. ORR on noble metals [Lu10], metal oxide [Deb07], graphene [Deb07] and metal alloys [Par13] has been reported to occur with reduced overpotential and longer cycle life. Further, studies of the cathode surface have shown that the Li2O2 nucleates in various 3D morphologies [Nak12a, Nak12b] and, even after multiple cycles, a significant portion of
5 the cathode surface was found to be bare [Nak12a, Nak12b]. In turn, the pristine surface retention is expected to have a significant role in the ORR kinetics. The use of rotating disk electrode (RDE) and rotating ring-disk electrode (RRDE) experiments to study the kinetics and catalytic activity of various surfaces has been a standard in the aqueous ORR literature [Mit13, Pra99, Mus06]. The application of these techniques to study Li-O2 ORR is beset with technical challenges, such as surface changes due to the peroxide deposition, previously reported anomalous Tafel behavior [Mus07], and extreme sensitivity to experimental conditions [Lao10]. The use of DFT models to screen potential catalytic surfaces overcomes these challenges and serves as a guide for future experimental studies.
6
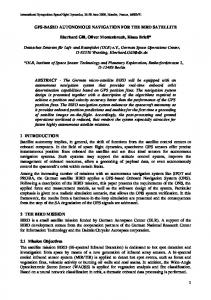
Figure 2.1. (a) The postulated mechanism of Li-O2 ORR, including the effect of surface binding energies on reaction routes. (b) schematic of the possible adsorption orientations considered – (i) Pauling (end-on), (ii) Yeager (bridge), (iii) Griffith (side-on). The adsorbed intermediates are shown on surface sites denoted by “S”.
7 2.2
The oxygen reduction reaction (ORR) mechanism A generalized mechanism for the oxygen reduction reaction on the cathode of a Li-
O2 cell is depicted in Figure 1(a). The mechanism postulated that oxygen from the electrolyte bulk approaches the surface by diffusive transport. The adsorption of oxygen was followed by electron transfer to produce the superoxide radical which subsequently gained a Li+ ion to form LiO2 on the surface. The possibility of outer sphere electron transfer [Mur81, Egd83] to form O2- and subsequent adsorption of the superoxide radical was also considered. This mechanism for forming the superoxide is a possibility in light of the degradation of the electrolyte observed but was not a major factor in screening various potential catalysts surfaces for electrochemical activity. Further, the half-life of O2- is generally quite short [Saw81] and hence the depiction of the first electron transfer as formation of LiO2 from O2 was deemed accurate. Analogous to ORR in aqueous systems, the type of chemisorption on the surface was expected to influence the reaction pathway. The proposed mechanism considered Yeager and Pauling type adsorption while discounting Griffith type adsorption due to the high bond strain involved. These adsorption models are depicted in Figure 1(b). The Yeager type adoption was found to require a favorable arrangement of proximal sites and hence was thought to be less likely compared to the end-on Pauling adsorption. Further, in the case of formation of the O2- species by outer sphere electron transfer, the Pauling model of adsorption was considered most likely to occur. The proposed mechanism envisioned three pathways consisting of 1-electron transfer, 2-electron transfer, and 4-electron transfer respectively. Following the adsorption of oxygen, the first lithiation step was common to all three mechanisms:
8 O2 + * → O2*
(1)
O2* + (Li+ + e-) → LiO2*
(2)
Depending on the donor number of the solvent and the consequent stabilization, it was expected that the superoxide radical may have a sufficiently high half-life to allow for the experimental observation of the formation of the superoxide radical on the surface preceding the lithiation. In the case of surfaces with the strong binding of LiO2, the mechanism proposed was the 2-electron process (indicated in Figure 1(a) with a solid line) that proceeded electrochemically with a second lithiation step to form Lithium Peroxide: LiO2* + (Li+ + e-) → Li2O2*
(3)
Desorption of the LiO2 intermediate was proposed to occur on surfaces with weak binding of the intermediate, which led to the 1-electron process (indicated in Figure 1(a) with a dashed line). The LiO2 was then postulated to undergo chemical disproportionation to yield Lithium Peroxide as the product: LiO2* → LiO2 + *
(4)
2LiO2 → Li2O2 + O2
(5)
Electrochemical surface reactions with the O2 adsorbed in a side-on configuration (Yeager model) may also involve further lithiation following the formation of Li2O2 by the 2-electron process. This adsorption configuration could possibly occur in the case of Pt3M and Pd3M alloys where creation of sufficiently close adjacent sites on the surface was thought be possible by controlling the size of the dopant. The highly electropositive Li + ions could weaken the O-O bond, which may lead to its cleavage and the formation of adsorbed LiO species. The proposed mechanism envisioned the possible further lithiation
9 of the LiO species to form Li2O. This constituted the 4-electron process (indicated in Figure 1(a) with a dash-dot line).
2.3
Li2O2* → 2LiO*
(6)
2LiO* + 2(Li+ + e-) → 2Li2O*
(7)
Density functional theory (DFT) calculations method The FCC (111) skin alloy structure used to model the Pd3M and Pt3M alloys for the
calculations is shown in Figure 2(b)(iii). Initially, the unit cell parameters for the noble metals and the alloys were calculated. A Monkhorst-Pack 10x10x10 k-point mesh was chosen for the lattice constant optimization in the bulk unit cell. For the total energy calculations of the (111) planar slabs, a four-layer slab as shown in Figures 2(b)(i) and 2(b)(ii) was used with six equivalent vacuum layers between each slab. These were periodically repeated. The stable skin4 configuration reported previously by us in Li et al. [Li09] was used for all the binding energy calculations. The unit cell geometry was optimized by performing total energy calculations at various lattice constant values and the lattice constant corresponding to the energy minima was chosen for further study. As a means of evaluating the accuracy of these calculations, the calculated lattice constants for Au and Pt were compared to reported experimental values. The calculated lattice constants for Au and Pt were found to be 4.15Å and 3.95Å respectively in this study. This was in very close agreement with values of 4.08Å and 3.92Å reported experimentally [Ash76] and thus served as an indicator of the ability of these calculations to predict experimental results. The oxygen atom was attached to different binding sites on the geometrically optimized slabs at ¼ ML coverage. This coverage was chosen to be representative of
10 surface coverage in typical Li-O2 cells with electrolytes that display relatively low oxygen solubility [Mus07]. The DACAPO code, which uses planewave pseudopotential implementation, employing the ultra-soft pseudopotentials [Ham99] of Vanderbilt to represent the ionic cores, was used for all total energy calculations in this study [Gre09]. Adsorption was allowed on only one of the two exposed surfaces of the metal slabs, and the associated electrostatic potential was adjusted accordingly. DFT calculation parameters such as ionic core description, kinetic energy of the plane wave basis and density cutoff are similar to those described elsewhere [Ham99]. The plane wave cutoff was 340 eV, and the density was treated on a grid corresponding to a plane wave cutoff at 500 eV. The surface Brillouin zone was sampled with an 18(1×1) Chadi-Cohen k point grid. In all of the cases, convergence of the total energy with respect to the cutoff energies and the k point set was confirmed. The exchange-correlation energy and potential were described by the Revised Perdew-Burke-Ernzerhof generalized gradient approximation (RPBE- GGA) [Gre09].
11
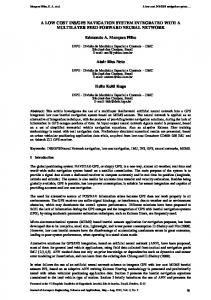
Figure 2.2. (a) Molecular structures used in the calculations (i) O2, (ii) LiO2, (iii) Li2O2, (iv) Li2O, (v) LiO; (b) Structure of various surfaces used for calculation - (i) Pt slab (top view), (ii) Pt slab (side view), (iii) Typical FCC (111) unit cell for noble metals and alloys, (iv) Various adsorption sites and adsorbed species orientation (EO:= End-on, SO:= Side-on).
12 In the skin4 type FCC (111) slab shown in Figure 2(b)(iii), the alloying elements were placed at alternate positions compared to the other skin type configurations where the alloying elements are placed in adjacent positions within the second layer. The binding energy of oxygen, for ¼ ML oxygen coverage at the most stable site was calculated using equation (1): EBinding (*O) = min (TEO* - TE* - EO (g))
(8)
where TEO* is the total surface energy of the alloy surface including the adsorbed oxygen, TE* is the total surface energy of the geometrically optimized alloy surface, and EO(g) is the energy of the oxygen atom in the gaseous phase. Similarly, the binding energy of other ORR intermediates—LiO2*, Li2O2*, and Li2O*—was also calculated on various types of surfaces and are listed in Table 1. Earlier publications [Li09] indicated that the preferred adsorption sites for atomic oxygen on FCC (111) surfaces were generally the octahedral (fcc) and tetrahedral (hcp) hollow sites. In this work, for ¼ ML coverage, oxygen was preferentially adsorbed at fcc and hcp sites. Nomenclature of various adsorption sites are illustrated in Figure 2(b)(iv). The inclination angle of adsorption of intermediates at every site was changed to identify stronger binding energies. Having obtained the binding energies of O*, LiO2*, Li2O2*, and Li2O* above, the ORR free energy was calculated using equation (9). The structures used to calculate the energies of these molecules in vacuum and later adsorbed on the slab surface are shown in Figures 2(a)(i)-(v). After taking into account the zero-point energy correction and the inclusion of entropic contribution, the free energy (ΔG) of any of the above steps can be written, in general, as given in the equation (11):
13 ΔG = ΔE –TΔS + Δ(ZPE) - neU
(9)
where Δ(ZPE) is the zero-point energy correction and eU is the free energy corresponding to cell potential. Following the literature [Lam06], the equilibrium potential for the 1-electron and 2-electron processes are taken to be 3.1V while that of the 4-electron process is taken to be 2.9V. The applied potential is 2.5V. For each elementary reaction step, ΔE values were evaluated from the energy difference between the products and the reactants for each reaction step, which was calculated from the binding energy of the intermediates involved. For example, ΔELiO2 = TE*LiO2-TE*-ELiO2. The calculated free energy involving the zero point energy corrections and entropic contributions to the free energies for the radicals and molecules involved in the reaction mechanism for each corresponding reaction step is given in Table 2.
14 Table 2.1. Optimized lattice constants of the various surfaces and reaction intermediate binding energies. The binding energies tabulated are for the strongest binding site and orientation. The lower the value of the binding energy, the stronger is its adsorption. Optimized
Binding energy (EBinding) (eV)
Lattice Constant (A)
O2*
LiO2*
Li2O2*
O*
LiO*
Li2O*
Au
4.15
0.23
0.77
-3.17
-1.96
-1.8
-2.36
Pt
3.95
-0.09
0.17
-3.61
-3.25
-2.38
-2.49
Pt3Fe
3.91
0.32
0.86
-2.55
2.49
-2.35
-2.74
Pt3Co
3.89
0.27
0.20
-2.83
-2.68
-1.85
-2.83
Pt3Cu
3.90
0.17
0.30
-3.06
-2.73
-2.03
-2.85
Pt3Ni
3.87
0.26
0.86
-2.79
-2.73
-1.93
-2.79
Pd
4.01
-0.61
0.18
-3.96
-3.49
-3.13
-0.77
Pd3Fe
3.96
0.41
0.27
-3.29
-3.09
-2.92
-2.65
Pd3Co
3.93
-0.01
0.40
-0.91
-3.12
-2.54
-2.83
Pd3Cu
3.95
-0.82
0.49
-3.61
-3.12
-2.54
-2.85
Pd3Ni
3.93
-0.03
0.61
-3.11
-2.95
-2.6
-2.88
15 Table 2.2. Reaction free energies for the first and second lithiation steps used to calculate the surface activity. The larger of the two reaction free energies is taken to be the activation energy on that substrate and used to calculate activity. ΔG1 (eV)
ΔG2 (eV)
Activity (eV)
Pt
-0.75
-0.15
0.253
Au
-0.47
-0.32
-0.027
Pd
-0.04
-0.69
0.203
Pt3Fe
-0.88
0.04
1.077
Pt3Co
-1.49
0.42
0.894
Pt3Cu
-1.29
0.08
1.232
Pt3Ni
-0.82
-0.20
0.324
Pd3Fe
-1.89
-0.43
1.397
Pd3Co
-1.43
-0.47
-0.018
Pd3Cu
-0.28
-0.81
0.327
Pd3Ni
-2.27
0.44
-0.499
The detailed kinetics of the reactions could not be deduced form the model described above, as the data was essentially thermodynamic. The assumption that the activation barrier for the rate limiting step was the larger of the free energy differences between the various lithiation steps allowed us to develop a kinetic model to calculate the catalytic activity of the various surfaces considered here for the 2-electron process. Following Norskov et al [Nor04], we defined maximal surface activity A as: 𝑘𝑖 𝐴 = 𝑘𝐵 𝑇 𝑚𝑖𝑛𝑖 (𝑙𝑛 ( )) 𝑘0
(10)
16 The value of k0 was calculated from the exchange current density reported in Viswanathan et al. [Vis13]. The standard formula 𝑖0 = 𝑛𝐹𝐴𝑘0 𝐶 was used where the concentration was that of oxygen saturation in the electrolyte system used in the experiment reported. The value of ki was calculated based on an Arrhenius type equation with the frequency factor calculated from collision theory. The value of ki was calculated from: 𝑘𝑖 = 𝐴𝑓 𝑒
−𝐸𝑎 ⁄𝑘 𝑇 𝐵
(11)
The pre-factor Af was calculated using a collision theoretic model: 8𝑘𝑇 1/2 𝐴𝑓 = 𝜎 ( ) 𝑁𝐴 𝜋𝜇
(12)
The reduced mass (μ) of the various species and the collision cross-section (σ) was calculated as follows: 1 1 1 = + 𝜇 𝑚𝐴 𝑚𝐵
(13)
𝜎 = 𝜋(𝑅𝐴 + 𝑅𝐵 )2
(14)
The parameters used in the calculation of reduced mass and the collision crosssection is tabulated in Table 3. The collision cross-section was calculated based on the Van der Waal radii (represented by RA, RB) of the respective reactants while the reduced mass used the molecular weights of the respective reactants. The calculated pre-factor was used in eqn. (11) to calculate ki and substituting this value along with the k0 value in eqn. (10) yielded the activities tabulated in Table 2.
17 Table 2.3. Parameters used in the calculation of the pre-factor (Af). *
+
O2 + Li + e- → LiO2 Reduced mass 𝜇
5.70
+
-
LiO2* + Li + e → Li2O2* 5.89
Collision cross-section 2 𝜎 (m )
4.75 X 10
Arrhenius type pre-factor 𝐴𝑓 (s-1)
1.23 X 10
2.4
*
-20
-06
-20
7.16 X 10
-06
1.83 X 10
Results and discussion The reaction free energy change values presented in Table 2 were calculated using
equation 9 as described in the previous section. The reaction free energy for the first lithiation step was found to be negative and hence the reaction was concluded to be facile. The second lithiation step showed a positive value of reaction free energy for some substrates indicating that it is not the preferred reaction pathway. Since the formation of LiO2 was predicted to be facile, this along with the poor binding of that intermediate to the surface, as reported in Table 1, would serve to explain experimental observations of the subsequent disproportionation reaction to form Li2O2 occurring in the electrolyte [Lu11, All12, Tra13] or through a hybrid surface-electrolyte mechanism [Joh14]. An electrolyte based disproportionation mechanism could also explain the prior lack of experimental observation of LiO2 as the final product despite theoretical prediction of that possibility [Das14]. Previous studies have reported on voltage window controlled closed cells with Li2O2 co-doped with Li2O [Oku14] and, most recently, an open cell configuration with Iridium nanoparticles supported on reduced graphene oxide cathode that produces stable LiO2 as the end product. Our prior studies have shown that the adsorption of LiO2 on
18 graphite is strong and also reported the enhancement in bond strength when adsorbed at a defect site [Nak12a]. Thus, we speculate that the edge and defect sites on graphene oxide could be one of the reasons for such a stabilizing effect. Further, it is possible that a cathode consisting of a combination of a suitable Pt or Pd alloy supported on graphene oxide could display the same effect.
19
Figure 2.3. Volcano plots of 2-electron ORR Catalytic activity calculated from DFT modelled free energy of reaction – (a) Noble metals (Pt, Pd, Au) and carbon basal plane, (b) Skin alloys of Pt, (c) Skin alloys of Pd. The binding energies on the abscissa are calculated w.r.t the binding energy of oxygen on Pt.
20 The surface catalytic activity results from the electrode kinetic model detailed in the previous section is presented in Figure 3. The activities were calculated form the reaction free energy change values presented in Table 2. The activity was plotted as a function of the oxygen binding energy, which was noted to be a key descriptor of the oxygen reduction activity [Gre09, Pad11]. The trends in Figure 3(a) matched prior experimental observations with porous Au/C, Pt/C and Pd/C electrodes [Ram12] and thus lent confidence to the modelling methodology. The carbon basal plane was used as a comparison and was found to show lower ORR activity as compared to the noble metals. Experimentally, it was expected that carbon would show strong binding with oxygen due to the presence of defect sites as DFT calculations showing stronger binding of Li-O2 ORR intermediates on defect sites on graphitic carbon has been previously presented by us elsewhere [Nak12a]. Prior experimental studies of H+ ORR on Pt alloys [Nor04] and Pd Alloys [Muk93] led us to expect higher ORR activity on these alloys as compared to the pure metals themselves. The reason for this was twofold. Firstly, the presence of the dopants on the surface was expected to provide closer or more favorable binding sites. Hence, side-on binding configurations such as Yeager or Griffith type binding could become more favorable, and thus the likelihood of O-O bond breaking as well as subsequent 4-electron transfer was considered to be higher. Even if 4-electron transfer was not achieved, the stronger binding of intermediates led to the expectation that surface electrochemical reactions increase in likelihood and consequently that there was a possibility of 2-electron transfer mechanisms being favored. Secondly, the dopants present in the sub-layers could lead to the so-called “Ligand Effect”. The d-bands of the atoms in the alloy overlap, and the addition of dopants was previously shown to lead to the electron
21 density in those bands changing [Saw81]. This change was hypothesized to result in stronger binding of intermediates and possibly facile electron transfer to the adsorbed species. These arguments were initially advanced to explain the catalytic activity of these surfaces toward H+ ORR and were found to be equally applicable to the case of Li+ ORR [Ham99]. Therefore, the higher activities of the alloys shown in Figures 3(b) and 3(c) were expected and in accord with extrapolations from experiments in aqueous systems [Muk93]. The relative activities of the various alloys could be a function of the d-electron interactions between the host and dopant atoms. The activities of the Pt alloys shown in Figure 3(b) showed a linear relationship where the atomic radii of the dopant atoms with Pt3Co showing the highest activity. From Figure 3(c) it was seen that—in the case of the Palladium alloys—the dopant atomic number increase corresponded to a decrease in activity, with the exception of copper. Further work is needed to elucidate the precise mechanism involved.
22
Figure 2.4. Comparative screening of high activity substrates for the 1-electron ORR mechanism. Weaker binding (higher binding energy) is preferred.
23
Figure 2.5. Comparative screening of high activity substrates for the 2-electron and 4electron ORR mechanism – (a) Activity vs. Relative Binding Energy of LiO2, (b) Activity vs. Relative Binding Energy of Li2O2, (c) Activity vs. Relative Binding Energy of Li2O. Stronger binding (lower binding energy) is preferred.
24 The catalytic activity in conjunction with the binding energy of the intermediates could be a valuable guide to the possible ORR mechanisms on a given surface. The comprehensive ORR mechanism detailed above suggested that the LiO2 binding was the key to the ORR occurring either on the surface or in the electrolyte bulk. The prerequisite for a 1-electron mechanism was found to be the weak binding of LiO2. Figure 4 compares the activities of the surfaces with the weakest binding of LiO2 from amongst the noble metals as well as the Pt and Pd alloys. Pt3Ni showed the highest activity amongst various substrates. Hence, it was reasonable to expect that this substrate will show the least amount of surface electrochemical reactions and accordingly the least amount of deposited Li 2O2. This could lead to longer cycle life, since the surface passivation phenomenon has been noted to be a major impediment toward this. The high ORR activity also suggested that conditions such as a high oxygen overpressure could ensure that 2-electron ORR occurs on Pt3Ni. The requirement for the 2-electron and 4-electron processes was found to be the strong adsorption of LiO2 to the substrate. Pt, Pt3Co and Pd3Fe were found to have the strongest binding with LiO2 and as a result were evaluated for the occurrence of 2-electron transfers as shown in Figure 5. Pt3Co showed weaker binding with LiO2 with a difference of only 0.03 eV compared to Platinum, which had an activity that was 0.64 units higher than Pt. Desorption of the lithium peroxide product, or its nucleation on specific sites rather than uniform surface growth, would be preferable so that more surface area would be available for reaction. Pt3Co showed weaker binding with Li2O2 with a difference of ~0.8 eV compared to platinum. While Pt was found to be superior for adsorbing LiO2, the small 0.03 eV difference with Pt3Co suggested that the best candidate for a 2-electron process would be the platinum-cobalt alloy. The same reasoning suggested that 4-electron transfer
25 was unlikely to be observed in the case of the Pt3Co substrate. The strong binding of Li2O2 on Pt and Pd3Fe raised the possibility that these surfaces may theoretically exhibit 4electron transfer. The possible occurrence of surface sites favorable to side-on binding in Pd3Fe could be an indication that this substrate was the best candidate for a hypothetical 4electron transfer mechanism. Another mechanism for 4-electron transfer involving initial dissociation of adsorbed oxygen was considered to be unlikely based on prior work showing that dissociation adsorption energy is lowered and dissociation itself is made exothermic in some cases with transition metal doped alloys [Saw81]. The occurrence of surface passivation by deposition of Li2O2 is a major problem in Li-O2 systems. Toroidal nucleates [Nak12b] and planar layers [Nak12a] are both experimentally observed morphologies for the Li2O2 product and it has been previously suggested that modelling the nucleation of the Li2O2 would provide valuable insight into the reaction mechanism [Vis13] and could also provide insight into the lack of experimental observation of 4-electron transfer mechanisms. Figure 6 shows the variation of Li2O2 binding energy with the binding site and the lattice constant on Pt, Au, and Pd. The alloys were not considered because their lattice constants were almost identical within experimental error and thus were unlikely to offer much insight. Following previous work showing the effect of the bonding and coordination number on catalytic activity [Kit04], the two major factors considered were the reaction site and the size of the site in the case of the interstitial sites. Figure 6(a) shows that Li2O2 binds relatively strongly to the FCC and HCP interstitial sites as compared to the bridge and top sites. The FCC and HCP sites served as voids, and the interactions with electron clouds of the four immediate neighbor atoms could be the cause of the strong adsorption predicted. The adsorption initiated with
26 the O2 species and then further reaction occurred to produce Li2O2 and so the possible cause of the strong adsorption could be the preference for end-on adsorption for a polar molecule like oxygen. This would be especially likely if outer sphere electron transfer occurred and the adsorbing species was O2-. Figure 6(b) shows that while the binding energy at the interstitial sites appeared to correlate to the lattice constant and hence the size of the site, the lattice constant appeared to have minimal effect on the bridge and top sites. The occurrence of stronger binding on FCC and HCP sites on Pd (a = 4.01Å) as compared to Pt and Au, which have lower and higher lattice constants respectively, suggested that there was an optimum interstitial site size for the strong adsorption of Li2O2.
27
Figure 2.6. EBinding (Li2O2) on - (a) Preferential binding sites, (b) correlation between site size and binding energy.
28
Figure 2.7. Influence of the dopant on EBinding (Li2O2).
29 Since the adsorption site and the corresponding electron distribution appeared to correlate to the strength of adsorption of the product, the variation of the binding energy of Li2O2 with the addition of dopants was considered in Figure 7. A clear correlation between the binding energy and the atomic radii of the dopants was seen in the case of the Pt alloys. This was a clear demonstration of the “Ligand Effect” and further investigation of the structure of the d-band in these alloys similar to previous work in aqueous systems [Ram12] along with models of the nucleation free energy from the reaction free energy values calculated here could offer insight into the nucleation and growth of Li2O2. The future investigation of the d-bands could also offer insight into the trends seen in case of Pd alloys.
2.5
Conclusion The present study evaluated Pt and Pd skin alloys as possible catalysts for the
oxygen reduction reaction on Li-O2 cell cathodes using ab initio DFT modelling and an electrode kinetic model based on collision theory. The issue of surface passivation by the nucleation and growth of peroxide layers was also addressed. The model successfully replicated experimental activity data [Ram12] for noble metals and carbon and also predicted activities for the Pt and Pd alloys that would be expected from our previous work with these alloys in aqueous systems. Pt3Co and Pd3Fe are found to show the highest activity and could be possible candidates for use as ORR catalysts. The evaluation of Pt3Co and Pd3Fe binding energies, with respect to the proposed requirements for 2-electron transfer, showed that these surfaces may preferentially follow the 2-electron ORR mechanism. Furthermore, the nucleation of Li2O2 appears to preferentially occur at
30 interstitial FCC and HCP sites, so decoration of these sites with surface groups may offer an avenue for facile oxygen evolution reactions. The use of Pt and Pd skin alloys appears to be a promising avenue for the realization of high cycle life and high capacity Li-O2 cells.
31 CHAPTER 3 KINETIC INVESTIGATION OF THE APROTIC SUPEROXIDE RADICAL ELECTROCHEMISTRY ON MULTI-CRYSTALLINE SURFACES AND CORRELATION WITH DENSITY FUNCTIONAL THEORY MODELING
The realization of a practical Lithium-air cell depends on understanding the oxygen reduction reaction (ORR), identifying a stable electrolyte and finding a suitable cathode. This study investigates the superoxide radical, its side reactions and correlates density functional theory (DFT) predictions of the surface activity to the experimental kinetics. The ORR on glassy carbon (GC), multi-crystalline Pt and multi-crystalline Au substrates in oxygen saturated 0.1M Tetraethylammonium Perchlorate (TEAClO4) in Dimethyl Sulfoxide (DMSO) was studied using cyclic voltammetery and the rotating ring-disk electrode (RRDE) technique. The RRDE data was analyzed using kinetic models to understand the electrochemistry of the superoxide radical and calculate the surface reaction rate constants. The percentage of the superoxide radicals desorbing from GC, Pt and Au surfaces correlated linearly to the modeled surface activities of the substrates. Further, the modeled surface activity trend was found to correlate strongly with the ORR onset potential. This study validates the DFT catalyst screening approach and the use of binding energies of the intermediates as a predictor of ORR activity. It also shows that side reactions involving the superoxide radical occurs in fresh, anhydrous DMSO based electrolytes.
3.1
Introduction The Lithium-air cell is an attractive technology for beyond Li-ion applications due
to its high theoretical energy density (gravimetric energy density of anode = 13,000Wh kg-
32 1
) which is close to that of internal combustion engines. To achieve practical application as
a replacement for Li-ion cells, current Li-air cells must overcome problems of (i) poor cycle life; (ii) high charge and discharge overpotentials resulting in low columbic efficiency and low power density [Lu10]; (iii) eventual ambient air operation. The poor cycle life reported in many articles can be traced to the oxidative instability of the electrolyte [Fre11a, Fre11b, Che12] in conjunction with electrode passivation due to irreversible product deposits and high overpotentials for decomposing Li2O2 [Nak12, Mit13]. The issue of electrolyte instability has been extensively reported since the early attempts to fabricate a secondary lithium-air cell adopting typical lithium-ion cell electrolytes. Alkyl carbonate based electrolytes were found to undergo nucleophilic attack, form passivating films and consume the electrolyte [Fre11a]. Extensive studies on a wide variety of electrolytes such as acetonitrile [Pen11], ethers [Fre11b], dimethylformamide [Che12], dimethylsulfoxide (DMSO) [Tra13], and various ionic liquids [Hig13, Miz13] have been carried out and relatively stable electrolytes were identified [Her12]. Further, the donor number of the electrolyte solvent was found to be critical to the mechanism of the oxygen reduction reaction (ORR) [Lao10]. Thus 1,2 dimethoxyethane (DME) and dimethylsulfoxide (DMSO) were extensively adopted for further study due to their high donor numbers and relative stability. Ionic liquids were also studied due to similarly favorable properties and their inherently good conductivity [Hig13, Miz13, All12, Mon12]. Nevertheless, oxidative stability continues to be of concern. Recently, the stability of DMSO has been called into question. Sharon et al. proposed multiple schemes for the reaction of DMSO with reactive oxygen species and Li2O2 [Sha13]. Similar reactivity of
33 DMSO with Li2O2 resulting in LiOH formation has also been reported taking electrolyte aging into account [Kwa14] and by direct exposure of Li2O2 to DMSO and its subsequent characterization by x-ray photo-adsorption spectroscopy (XPS) [You14]. While the evidence strongly suggests that DMSO is indeed oxidatively unstable, water contamination could also be a factor due to the well-known solubility of water in DMSO [Van05]. This would be especially pertinent as the scanning electron microscope (SEM) images of Li2O2 reported in Kwabi et al. [Kwa14] showed nucleation and particle structure whose occurrence has been shown to require the presence of water [Aet15] and due to the electrolyte aging involved. Further, the presence of water has been shown to result in LiOH being the reduction product [Liu15]. The present study sought to examine the oxygen reduction reaction (ORR) and identify any side reactions on glassy carbon (GC), multi-crystalline Pt and multi-crystalline Au electrodes in anhydrous 0.1M TEAClO4 in DMSO using the Rotating Ring-Disk Electrode (RRDE) technique. The absence of lithium ensured that the electrode surface was pristine and allowed for the application of well-established kinetic models [Hsu83, Wro76] to calculate the rate constants for reactions and to identify possible side and parallel reactions [Dam66]. These techniques have been previously used by us for kinetic investigations of the H+ ORR on various surfaces such as Lead Ruthenate pyroclores [Pra99], Ruthenium [Pra00], and Cobalt-Palladium [Mus07]. The measurement of the ratio of desorbed superoxide species is challenging in the Li salt containing electrolyte due to the short half-life of the radical [Saw81] and the change in the electrode surface due to product deposition. But these constraints were overcome in the present study by the use of an unreactive TEA+ cation. This also allowed for the measurement of the degree of side
34 reactions between the superoxide radical and the electrolyte and show that pristine, fresh DMSO also undergoes reactions with the superoxide radical. The ratio of superoxide radicals that desorb into the electrolyte was calculated and correlated with the density functional theory (DFT) modeling based activity of the substrates. The use of DFT for catalysts screening is well established [Gre09] but is also beset with challenges in the Liair system due to the requirement to model the solvent effect and the changing substrate. Herein, we correlated the DFT predictions reported by us previously [San16] to the first electron transfer reaction resulting in the formation of superoxide radical, which subsequently reacts to form the peroxide product in the presence of Li+ via a variety of routes. Similar to our work on the ORR in polymer electrolyte membrane fuel cells (PEMFCs) [Ram10], we found that relatively simple DFT models showed a remarkable degree of correlation with experimental data.
3.2
Experimental methods The 0.1M solution of Tetraethylammonium perchlorate (TEAClO4) (Alfa Aesar) in
Dimethylsulfoxide (DMSO) (>99.9%, Fisher) was prepared in a MBraun argon filled glove box with H2O and O2 levels