Techniques
Development of a High-Throughput Method for Quantification of Plasmopara viticola DNA in Grapevine Leaves by Means of Quantitative Real-Time Polymerase Chain Reaction G. Valsesia, D. Gobbin, A. Patocchi, A. Vecchione, I. Pertot, and C. Gessler First, second, third, and sixth authors: Plant Pathology Group, Institute of Plant Sciences, Swiss Federal Institute of Technology, 8092 Zürich, Switzerland; fourth author: Plant Protection Operative Unit, Istituto Agrario di S. Michele all’Adige, via E. Mach 1, 38010 S. Michele all’Adige (TN), Italy; and fifth author: SafeCrop Centre, Istituto Agrario di San Michele all’Adige, via E. Mach 1, 38010 S. Michele all’Adige (TN), Italy. Accepted for publication 13 February 2005.
ABSTRACT Valsesia, G., Gobbin, D., Patocchi, A., Vecchione, A., Pertot, I., and Gessler, C. 2005. Development of a high-throughput method for quantification of Plasmopara viticola DNA in grapevine leaves by means of quantitative real-time polymerase chain reaction. Phytopathology 95:672678. Plasmopara viticola is a strictly biotrophic oomycete that causes downy mildew, which is one of the most important grapevine diseases. Control of the disease is most often achieved by fungicide applications, which may have severe environmental consequences. Therefore, alternative control strategies based on biocontrol agents (BCAs) are currently in development. Thousands of potential BCAs have to be screened for their antagonist efficacy against Plasmopara viticola. Evaluation of their effect on the pathogen can be achieved by detecting the amount of P. viticola DNA in leaves treated with potential antagonists and infected with the pathogen. In this study, a rapid high-throughput method was developed for relative quantification of P. viticola DNA directly from Vitis vinifera
Downy mildew, caused by the obligate biotrophic oomycete Plasmopara viticola (Berk. & Curt.) Berl. & de Toni, is one of the most important grapevine diseases worldwide (17). All European grape species (Vitis vinifera) are susceptible or highly susceptible, whereas American species (V. labrusca, V. riparia, and V. rupestris) are more resistant, most likely because of coevolution (2) with the pathogen of American origin. Disease symptoms initially appear as yellowish green spots (oil spots) on the upper leaf surface. Under optimal conditions, i.e., saturating humidity, darkness, and mild temperatures, sporulation is observed on the lower leaf and young grapes. When older grapevines are attacked, they become blue and dry. At later stages of the disease, leaf necrosis and defoliation are observed. Infections of young inflorescences and berries cause the most disease losses (3). During years with extremely favorable environmental conditions, yield reduction as much as 80% may be observed in vineyards if control procedures are not implemented (5). Disease control is mainly achieved by the application of fungicides, which creates concern about the potentially negative biological and ecological impact. Therefore, alternative disease control strategies that focus on using a biocontrol agent (BCA) are currently being evaluated. A BCA is a microorganism that an-
Corresponding author: A. Patocchi; E-mail address:
[email protected] DOI: 10.1094 / PHYTO-95-0672 © 2005 The American Phytopathological Society
672
PHYTOPATHOLOGY
leaves by means of multiplex real-time quantitative polymerase chain reaction (PCR) with TaqMan chemistry. This method allows simultaneous amplification, but independent detection, of pathogen and host DNA by using species-specific primers and TaqMan probes that are labeled with different fluorescent dyes. Including detection of V. vinifera DNA in the tests is fundamental because it provides an endogenous reference and allows normalization for variations caused by sample-to-sample differences in DNA extraction, PCR efficiencies, and pipetting volumes. The developed method allows highly sensitive and specific detection of P. viticola DNA (minimal detectable quantity of 0.1 pg). Moreover, high precision and reproducibility of TaqMan assays were observed over a linear range of four orders of magnitude, confirming the reliability of the developed PCR assay. Potential applications range from screening for BCA efficiency to evaluation of fungicide efficacy, or assessment of host resistance. Additional keywords: biocontrol agents, downy mildew, TaqMan.
tagonizes the target pathogen, reducing its fitness. Mass screening of microorganisms is necessary to identify BCAs that are effective against a specific pathogen. The usual way to identify BCAs against nonbiotrophic pathogens is to perform an in vitro screening. Unfortunately, in vitro screening is not possible in the case of P. viticola, since it is a strictly biotrophic organism. Consequently, an alternative screening method is needed. The aim of this study was the development of an innovative, quick, and cost effective in vivo high-throughput assay system to identify microorganisms showing inhibitory activity against P. viticola. The approach chosen to verify the effect of potential antagonists on P. viticola is based on artificial treatment of V. vinifera leaves with potential antagonists, followed by infection with P. viticola in the greenhouse, and on subsequent quantification of P. viticola DNA in the pretreated, infected V. vinifera leaves by means of real-time quantitative polymerase chain reaction (PCR). This technique allows for DNA quantification even at very low concentrations (picograms per microliter). In real-time quantitative PCR, unlike end-point quantitative PCR, amplicons are monitored as they accumulate in the exponential phase, where limiting conditions are not yet present (16). Each real-time PCR reaction is characterized by a specific cycle number, the threshold cycle (CT), at which a statistically significant increase in fluorescence over the baseline can be detected. The CT is inversely proportional to the log of target sequence concentration. This means that the more template that is present in a PCR sample, the lower the number of amplification cycles needed to reach the point where fluorescence is detectable above the baseline (6,10). TaqMan
chemistry was chosen in many other studies to specifically detect pathogen DNA and it permitted the development of accurate assays to detect and quantify bacterial (9,13), fungal (1,10,14,16), and viral plant pathogens (8,11). In this study, we report the development and optimization of a reliable multiplexed real-time PCR assay for simultaneous quantification of P. viticola and V. vinifera DNA to perform a normalized measurement of pathogen infection. This method represents a solution for quantifying the relative amount of P. viticola mycelium in V. vinifera leaves. Possible applications include screening of potential antagonist microorganisms for BCA development, evaluation of fungicide efficacy (12), assessment of degree of plant resistance, and investigation of ontogenic resistance. MATERIALS AND METHODS Fungal and plant materials. In this study, three kinds of tissues were used as starting material for DNA extraction; P. viticola lesions on the host (V. vinifera leaves and leaf discs), P. viticola microsporangia, and V. vinifera leaves. Artificial P. viticola infections were performed on V. vinifera leaves and 1-cm diameter V. vinifera leaf discs. Infections were performed by immersing the abaxial surface of host tissues in a solution of P. viticola conidia (2 × 10⁵ conidia/ml) for 12 h at 20°C. P. viticola microsporangia were harvested by suction from sporulating lesions with a disposable pipette tip (with filter) attached to a vacuum device. Microsporangia that remained on the surface of the filter were transferred to a 1.5-ml Eppendorf tube, freeze dried, and stored at –20°C. DNA extracted from P. viticola microsporangia was used as pure P. viticola DNA in standard curves and for positive controls. DNA extraction. Sporangia and leaf samples were transferred, one per well, to deep well blocks (Qiagen, Hilden, Germany) containing a 3-mm diameter carbide bead (Qiagen) per well. The samples were ground for 30 s at a frequency of 30 s–1 in a MM 300 homogenisator (Retsch, Haan, Germany). High-throughput DNA extraction of leaf samples and sporangia was performed in a semiautomatic process with NucleoSpin Multi-96 Plant Kit (Macherey-Nagel, Düren, Germany) with the Genesis RSP 150 Robot (Tecan, Männedorf, Switzerland) following an adapted MN protocol (3). Instead of one final elution step of 180 µl, three elutions of 60 µl were performed. The three elutions were kept separate, so that for every sample, three DNA aliquots were obtained. It was found that PCR inhibitors accumulated in the first elution, but not in the second or third elutions. Therefore, the second elution was used undiluted in subsequent analysis. Quantification of DNA from leaf and leaf disc samples was not performed. V. vinifera DNA was extracted as described by Lodhi et al. (7). Concentrations of pure V. vinifera DNA and pure DNA from P. viticola microsporangia were measured with the PicoGreen technique in a SPECTRAFLUOR PLUS (Tecan), following the manufacturer’s protocol. Standard curves. P. viticola DNA (1 ng/µl) was serially diluted (1:2, 1:4, 1:10, 1:102, 1:103, 1:104, 1:105, and 1:106) in V. vinifera DNA (1 ng/µl). In a second assay, P. viticola DNA (1 ng/µl) was serially diluted (1:2, 1:4, 1:10, 1:102, 1:103, 1:104, 1:105, and 1:106) in distilled water to investigate any possible influence of host DNA on amplification of pathogen DNA. Six replicates of the dilution series were analyzed by real-time quantitative PCR. Standard regression curves for P. viticola were generated by plotting the known DNA amounts against the CTs (threshold values) measured by the SDS 7700 software (Applied Biosystems, Foster City, CA). Standard regression curves for host DNA were generated in the same way. Pure host DNA, however, was serially diluted in sterile water because of the negligible quantity of pathogen DNA, compared with host DNA, present in the leaf tissue. One of the standard regression curves for P. viti-
cola and one for V. vinifera were chosen as reference curves, which allow for transformation of experimental CT values into amounts of DNA (nanograms). Normalized P. viticola infection values of V. vinifera leaf tissue were obtained by dividing CT values for V. vinifera by CT values for P. viticola. Their ratio was defined as the infection coefficient (IC) (IC = CT V. vinifera/CT P. viticola). Comparison between standard deviations of ICs of replicates was possible because of the reliable linear relationship that exists among ICs. Calibrator DNA. To enable comparisons among results of different tests, one assay calibrator (calibrator DNA) containing 0.1 ng/µl of P. viticola and 1 ng/µl of V. vinifera DNA was added to each assay. This DNA corresponds to the 1:10 dilution used for generating the standard curve for P. viticola. This DNA was applied as a dual-species quantification standard by loading it in triplicate in every assay. Aliquots of the calibrator DNA were stored at –20°C. Calibration of IC values was performed as follows: The average IC value of calibrator DNA calculated in the standard curve (ICSt) was set as reference value. For every assay, the difference between the average IC value of calibrator DNA calculated in the standard curve (ICSt) and the average IC value of calibrator DNA of the assay (ICA) was calculated (∆IC = ICSt – ICA). IC of unknown samples analyzed in each assay (ICX) were then correspondingly corrected by adding the ∆IC (ICX, corrected = ICX, measured + ∆IC). Primers and TaqMan probes. Plasmopara viticola. To design primers to amplify sequencing template for P. viticola DNA, the internal transcribed spacer 1 (ITS 1) -5.8S rDNA sequences for 30 Oomycetes (Phytophthora sp., Pythium sp., Halophytophthora batemanensis, and Pseudoperonospora humuli) were obtained from GenBank (AF087474, AF403504, AF279125, AJ299733, AJ007370, AB043506, AJ233458, AF271227, AJ233460, AF403501, AF139370, AF228101, AF403503, AF403500, AF228102, AJ131988, L76545, AJ131987, AJ131989, AJ233457, AJ233459, AY039713, AF271222, AF271225, AF271226, AF385834, AF271223, AF271224, AF448225, and AJ233456) and aligned with CLUSTALW (15). PCR primers were designed on the basis of Phytophthora sp. KACC40449 sequence (Accession No. AF087474) with the forward primer within the ITS1 rDNA sequence (ITS1: CCACACCTAAAAAACTTTCCACGTGAAG), and the reverse primer within the 5.8S rDNA sequence (5.8S: CCTACAGATCCGAGCGTGTAG). The ITS1/5.8S primer pair was tested for specificity on pure P. viticola and V. vinifera DNA and on DNA extracted directly from infected leaves. PCR was performed with ITS1/5.8S primer pair in 25-µl reactions, which were composed of 1× PCR buffer, 0.1 mM dNTPs, 0.2 µM ITS1 and 5.8S primers, 1.75 units of Taq DNA polymerase (Amersham Biosciences, Little Chalfont, UK), and 5 ng of DNA. Reaction conditions were 45 cycles of 94°C for 30 s (denaturing), 60.5°C for 60 s (annealing), and 72°C for 30 s (extension). After amplification, PCR products were purified with a QIAquick PCR purification kit (QIAGEN) following the manufacturer’s protocol. Both strands of the PCR product were sequenced with primers ITS1 and 5.8S with the ABI PRISM BigDye Terminator v 3.0 Ready Reaction Cycle Sequencing kit on an ABI PRISM 377 DNA Sequencer (Applied Biosystems). Forward and reverse sequences were assembled and aligned with the Phytophthora sp. KACC40449 sequence. The primer/TaqMan probe set was designed on the Plasmopara sp. sequence on the sites of maximum mismatch with Phytophthora sp. sequence using Primer Express 1.5 software (Applied Biosystems). The best P. viticola PCR primer set (Giop set), including a reverse primer (Giop R: GGTTGCAGCTAATGGATTCCTA), a forward primer (Giop F: TCCTGCAATTCGCATTACGT), and a TaqMan probe (Giop P-VIC: TCGCAGTTCGCAGCGTTCTTCA) was chosen following the criteria in the Primer Express User manual. The Vol. 95, No. 6, 2005
673
P. viticola probe was labeled at the 5′-end with VIC reporter dye, and the 3′-end was labeled with TAMRA quencher dye (Applied Biosystems). Amplification with the Giop primer set generated a 208 bp long PCR product. Primers test. To define the optimal annealing temperature and test the specificity of the pathogen primers, gradient PCR was performed in a TGradient Thermoblock (Biometra, Göttingen, Germany). Five DNA samples extracted directly from infected leaves, one pure P. viticola DNA sample (positive control), one pure V. vinifera DNA sample, and a no DNA template control (negative control) were amplified. Ten microliter PCR reactions containing 0.1 mM dNTPs, 0.2 µM Primer Giop F, 0.2 µM Primer Giop R, 1× PCR Buffer, and 0.70 U Taq DNA Polymerase (Amersham Biosciences) were performed. Cycling conditions were 94°C for 2.5 min followed by 45 cycles of 94°C for 30 s, varying annealing temperatures (from 55 to 65°C) for 1 min, 72°C for 30 s, and a final extension of 72°C for 10 min. V. vinifera. Primers and TaqMan probe for V. vinifera (Res set) were designed on the resveratrol synthase I mRNA sequence obtained from GenBank Accession No. AF274281 using the Primer Express 1.5 software. The Res set included a reverse primer (Res R: GCTGTGCCAATGGCTAGGA), a forward primer (Res F: CGAGGAATTTAGAAACGCTCAAC), and a probe (Res PFAM: TGCCAAGGGTCCGGCCACC). PCR generated a 63 bp long product. The Res probe was labeled with, at the 5′-end, 6FAM reporter dye and at the 3′ end it was labeled with the TAMRA quencher dye (Applied Biosystems). Primers test. Optimal annealing temperature and specificity of the host primers set were studied by gradient PCR as described for P. viticola. Amplification was performed for five lesion DNAs (extracted from infected leaves), purified V. vinifera DNA (positive control), purified P. viticola DNA, and with no DNA template control (negative controls).
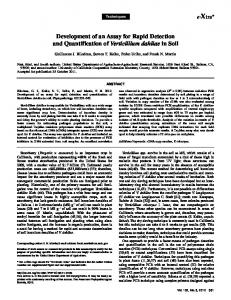
Fig. 1. Standard curves of A, Plasmopara viticola DNA diluted in V. vinifera DNA and B, Vitis vinifera DNA diluted in water. Threshold cycles (CT) were plotted against the log of genomic DNA standards of known concentrations. Each data point represents the mean of six replications. Bars represent the standard deviation values. 674
PHYTOPATHOLOGY
Real-time quantitative PCR optimization. Optimization of real-time quantitative PCR was performed for each probe/primer set individually and then in multiplex amplification. The sensitivity of the assay was optimized for ranges of host and pathogen DNA amounts that are supposed to be present in infected leaves or leaf discs (nanogram/picogram range). Real-time quantitative PCR calibration experiments were performed with DNAs of known concentrations in a 7700 Sequence Detector System (SDS) (Applied Biosystems) in 96-well optical reaction plates with barcodes and sealed with optical adhesive covers (Applied Biosystems). Each PCR assay included a negative control, without template DNA, a positive control for both species, and one calibrator DNA (described previously). Controls were run in triplicate in each assay. In the initial stages of optimization of the real-time PCR assay, standard cycling conditions modified for the TaqMan Universal PCR Master Mix (Applied Biosystems) were used (50°C for 2 min and 95°C for 10 min and 40 cycles of 95°C for 30 s, 60°C for 1 min, and 72°C for 30 s). Real-time quantitative PCR was performed for the P. viticola (Giop) primer set with different combinations of forward and reverse primer concentrations (from 50 to 900 nM) with the probe concentration fixed at 250 nM. To determine the limiting primer concentrations for detection of V. vinifera, Res primer concentrations were varied from 20 to 300 nM and the probe concentration was fixed at 250 nM. Optimization of multiplex reactions was performed with different concentrations of Giop primer (700 to 1,500 nM) combined with the limiting primer concentration of Res primers and tested using template DNA from five samples, purified DNAs of both pathogens, and host and negative controls. Probes concentrations were fixed at 250 nM. Finally, to determine the optimal probe concentration for P. viticola, real-time quantitative PCR experiments were run with limiting Res primer concentrations and optimal Giop primer concentrations. Giop probe concentrations ranged from 125 to 500 nM, whereas Res probe concentrations were maintained at 250 nM. The reaction volume optimization was performed in multiplex real-time quantitative PCR assays, in which reaction volumes varied from 15 to 50 µl. After optimization of primer concentrations, probe concentrations, and reaction volume, the short cycling protocol (no extension at 72°C) was evaluated. Reproducibility of TaqMan assays. The precision of TaqMan assays is influenced by intra-assay precision, inter-assay variability, and inter-sample reproducibility, which were evaluated in this experimental system with DNA extracted from artificially infected V. vinifera leaves and leaf discs. To evaluate intra-assay precision, DNAs of four samples were analyzed in eight replicates in a single assay. To evaluate inter-assay variability, DNAs of these same four samples were analyzed in triplicate over five separate assays. For inter-sample reproducibility, a more complex route was followed: five 1-cm diameter leaf discs (“replication samples”) per leaf were collected from four V. vinifera leaves (Pinot gris) of different ages. The 20 leaf discs were immersed with the abaxial surface in a solution of P. viticola conidia (2 × 10⁵ conidia/ml) and incubated at 20°C for 12 h. Later, the leaf discs were placed in a humid chamber in contact with sterile water for 4 days at 20°C to allow for sporulation, and then they were freeze dried. DNAs of the “replication samples” were separately extracted and analyzed in triplicate in a single real-time multiplex PCR assay. Statistical analysis, i.e., analysis of variance, was conducted using SYSTAT 10.0 (Systat for windows statistics, Version 10; Systat Software UK Ltd., London, UK). Method sensitivity test: Resistance of three Vitis spp. against P. viticola. Three different Vitis spp. (V. riparia, V. vinifera cv. Teroldego, and V. vinifera cv. Moscato giallo) were sprayed with a suspension of P. viticola conidia (105 conidia/ml), and then left over night in a phytotron (18°C, 100% humidity). The next day, plants were transferred to a greenhouse (25°C, 100% humidity).
After 4 days, nonsporulating oil spots appeared, and samples were collected from plants of every variety. The plants remained in the greenhouse and 6 days after the beginning of the experiment, sporulating oil spots were collected. Necrotic lesions were collected 15 days after inoculation. After sampling, lesions were handled and analyzed as described in this study. RESULTS Primers and probe design. The alignment of the 30 oomycete ITS1/5.8S sequences allowed us to find conserved regions where design of primer for P. viticola was possible. The ITS1-5.8S primer set showed high specificity for pathogen DNA and no host DNA was amplified. The sequence of ITS1/5.8S permitted the design of the TaqMan probe/primer (Giop) set for P. viticola, whereas TaqMan probe/ primer (Res) set for V. vinifera was designed from the resveratrol synthase I mRNA sequence obtained from GenBank accessions. The Giop probe/primer set did not amplify DNA extracted from uninfected V. vinifera leaves, and the Res set did not amplify pure P. viticola DNA (data not shown). The specificity of the two probe/primer sets was tested in single and multiplex real-time quantitative PCR assays and found to be the same (data not shown). The Res set detected DNA in infected and uninfected V. vinifera, therefore, amplification of part of resveratrol synthase I gene could be used as a normalizing marker and as an internal positive control (IPC). Sensitivity of the two TaqMan probe/ primer sets was the same in single and multiplex real-time quantitative PCR assays (data not shown). Furthermore, a high precision of probe/primer sets was displayed over a linear range of four orders of magnitude (Fig. 1). Standard curves. Linear relationships between CTs and log of known DNA quantities were found for P. viticola DNA (R2 = 0.9981) and V. vinifera DNA (R2 = 0.9949); P. viticola DNA was quantifiable from 0.1 pg to 1 ng (Fig. 1A), whereas V. vinifera DNA was quantifiable from 0.01 ng to 100 ng (Fig. 1B). When the amount of P. viticola DNA was lower than 1 pg, standard deviations of replicates increased (Fig. 1B). Standard curves for P. viticola DNA diluted in water or in V. vinifera DNA were identical, since no significant differences (P = 0.05) between corresponding water and V. vinifera DNA dilution classes were shown (Fig. 2). Real-time quantitative PCR optimization. Optimization of real-time quantitative PCR involved step-by-step fine tuning of
Fig. 2. Plasmopara viticola threshold cycle (CT) values of a double dilution series of a P. viticola DNA from 100 ng/µl (1) to 0.1 ng/µl (1:10,000). In the first series, P. viticola DNA was diluted in water (light gray bars) while in the second series, P. viticola DNA was diluted in Vitis vinifera DNA (1.1 ng/ml; dark gray bars). Each data point represents the mean of three intra-assay replications. Bars represent the standard deviation values. After t-tests (P = 0.05), no significant differences between corresponding water and V. vinifera DNA dilution classes were shown.
PCR parameters, including optimizing primer concentrations, probe concentration, and reaction volume with standard cycling conditions. Following optimization, the short cycling protocol recommended by Applied Biosystems could be successfully applied. An optimized concentration of the Giop primers (700 nm) was determined by single real-time quantitative PCR. This result enabled us to restrict the range of Giop primer concentrations that had to be tested for optimization of the multiplex real-time quantitative PCR, where pathogen and host DNA are simultaneously amplified. In multiplexed PCR reactions, competition between the two DNA species should be avoided. This was performed by limiting amplification of host (V. vinifera) DNA, which was the most abundant species in the samples, and by optimizing amplification of pathogen (P. viticola) DNA that represented the minority species. The limiting primer concentration is defined as the concentration that shows reduction in fluorescence difference (∆Rn) but little effect on CT. The limiting concentration for the Res primer pair (120 nM) was determined by performing a single realtime quantitative PCR assay. In the multiplex real-time quantitative PCR assay, optimal Giop primer concentration (900 nM) was determined following the criterion that optimal primer concentration yields the lowest CT and the maximum fluorescence difference (∆Rn). Tests to evaluate the optimum concentration of the Giop probe, which is the concentration that guarantees highest sensitivity, were conducted by using a dilution series of the probe. Increasing the Giop probe concentration did not bring advantages in its amplification, therefore, Giop and Res probe concentrations were chosen as suggested by the SDS 7700 user manual, e.g., 250 nM. After optimizing all reaction conditions, reaction volume optimization was performed in an attempt to reduce materials used in high-throughput screening system. It was observed that a reduction in the standard reaction volume of 50 to 30 µl had no effect on the accuracy of the assay. Bringing individual results together, optimal multiplex realtime quantitative PCR conditions were found to be as follows: 30 µl reaction volume with 1× TaqMan Universal Master Mix (Applied Biosystems), 250 nM P. viticola VIC-labeled probe (Giop P), 250 nM V. vinifera FAM-labeled probe (Res P), 900 nM P. viticola forward and reverse primers (Giop F, R), 120 nM V. vinifera forward and reverse primers (Res F, R), and 5-µl template DNA (undiluted). Amplifications were performed with the standard short cycling parameters (50°C for 2 min and 95°C for 10 min and 40 cycles of 95°C for 15 s and 60°C for 1 min). Reproducibility of TaqMan assays. TaqMan assay reproducibility was confirmed after testing their components, i.e., intraassay precision, inter-assay variability, and inter-sample reproducibility for their legitimacy (Figs. 3, 4, and 5). The intra-assay
Fig. 3. Intra-assay precision of TaqMan assays. DNAs of four unknown samples (A, B, C, and D) were analyzed in eight replicates in the same assay. IC = Plasmopara viticola infection coefficient (ratio between threshold values of host and pathogen). A high ratio corresponds to a high infection degree. Each data point represents the mean of eight replications. Bars represent the standard deviation values. Vol. 95, No. 6, 2005
675
precision test was performed to reduce to a minimum the number of replicates of each sample that should be run in each assay. Tests of eight replicates resulted in very low standard deviations within the four samples tested (ICDNA A = 0.80 (average) ± 0.03 (standard deviation), ICDNA B = 0.87 ± 0.006, ICDNA C = 0.94 ± 0.02, and ICDNA D = 0.95 ± 0.02) (Fig. 3). To assess the minimum number of replications required, subsets of 7, 5, and 3 ICs in every possible combination (8, 56, and 56 subsets, respectively) were picked among the 8 ICs obtained. The averages of ICs from all subset were never significantly different (P > 0.05) from the average of all eight ICs measured (after t-test at a 95% confidence level). Considering such a low standard deviation and nonsignificant differences, intra-assay replicates are not strictly necessary because any single value obtained is very close to the average. Nevertheless, to exclude any possible false measurement, DNAs were always analyzed in triplicate.
Fig. 4. Inter-assay variability of TaqMan assays. DNAs extracted from artificially inoculated leaf discs (A, B, C, and D) were amplified in triplicate over five separate assays. IC = Plasmopara viticola infection coefficient (ratio between threshold values of host and pathogen). A high ratio corresponds to a high infection degree. Each data point represents the mean of three replications. Bars represent the standard deviation values.
Fig. 5. Inter-sample reproducibility of TaqMan assays. Four infected leaves were analyzed. For each leaf, five repetition samples (leaf discs) were used as putative identical replicates. The box plots show the distribution of the ICs of the five repetition samples. Replicate sample DNAs were analyzed in triplicate and data points used to construct the box plots are averages of those three replications. Bars represent upper and lower adjacent values. Outside values are shown by circles. IC = Plasmopara viticola infection coefficient (ratio between threshold values of host and pathogen). A high ratio corresponds to a high infection degree. 676
PHYTOPATHOLOGY
In a method for high-throughput analysis, in which a high number of samples are considered, comparison among results within the same assay performed in distinct moments must be possible. Therefore, inter-assay precision had to be assessed. High intraassay precision of CT values of DNAs (analyzed in triplicate) was shown for each of the five assays (Fig. 4). Taking DNA from sample A for example, average ICs obtained in the five assays were 0.810 ± 0.009, 0.813 ± 0.008, 0.801 ± 0.005, 0.820 ± 0.006, and 0.825 ± 0.008. To allow comparison of IC values obtained in different assays, the calibrator DNA was added in each assay. The measured ICs were subsequently corrected. Following with the example of DNA from sample A, the ∆ICs were –0.002, –0.004, –0.003, –0.004, and –0.014 for assays 1, 2, 3, 4, and 5, respectively. Therefore, as ICX, corrected = ICX, measured + ∆IC, ICX, corrected for assays 1, 2, 3, 4, and 5, respectively, were 0.808 ± 0.009, 0.809 ± 0.008, 0.804 ± 0.005, 0.816 ± 0.006, and 0.811 ± 0.008. Inter-sample reproducibility was tested to determine significance of repetitions of one test, performed to obtain reliable results. As in the previous experiments, intra-assay variation was low (see example below). Nevertheless, the five IC values of replicate samples collected from the same leaf were shown to have significant differences (P < 0.05 after t-tests) (Fig. 5). For instance, the five average ICs of the samples collected from the second leaf were 0.926 ± 0.015, 0.907 ± 0.011, 0.772 ± 0.002, 0.904 ± 0.005, and 0.881 ± 0.003. Therefore, inter-sample reproducibility is the main variability source of the method. Test: Resistance of three Vitis spp. against P. viticola. To test the method described in this publication, infections of V. riparia, V. vinifera cv. Teroldego, and V. vinifera cv. Moscato giallo at three different stages were analyzed. V. riparia has a good resistance degree (almost no sporulation) (2; I. Pertot, personal communication), V. vinifera cv. Moscato giallo is a very sensitive variety, and V. vinifera cv. Teroldego has a middle resistance to P. viticola (I. Pertot, personal communication). Samples were collected during early infection, as the symptoms appeared as oil spots, at sporulation, and at necrosis. IC values of the most resistant variety (V. riparia) were always the lowest and, with the exception of samples from a sporulating lesion, the highest IC values were shown in the case of V. vinifera cv. Moscato giallo (Fig. 6). A clear differentiation between IC values of the sensitive variety and IC values of the middle-tolerant one (V. vinifera cv. Teroldego) could not be achieved by testing samples from sporulating lesion. This may be a consequence of nonhomogeneous sporulation.
Fig. 6. Resistance of three Vitis vinifera cultivars against Plasmopara viticola. Cultivars of V. vinifera with different resistance degrees were infected with P. viticola conidia. V. riparia is a resistant cultivar, V. vinifera cv. Moscato giallo is sensitive, and V. vinifera cv. Teroldego is a medium-tolerant cultivar. Samples were collected at different infection stages; as symptoms arose (oil spots), at sporulation, and at necrosis. IC = P. viticola infection coefficient (ratio between threshold values of host and pathogen). A high ratio corresponds to a high infection degree. Each data point represents the mean of three replications. Bars represent the standard deviation values.
DISCUSSION The method developed in this study was initially conceived as an alternative to traditional quantitative tests for BCAs screening, which rely on in vitro growth inhibition tests or visual quantification of the disease severity on leaves (in the greenhouse). Neither approach is suited to identifying BCAs effectiveness against a strictly biotrophic pathogen like P. viticola. The described real-time quantitative PCR-based method has great advantages over time-consuming traditional visual and in vitro assays by allowing a quick, high-throughput, and normalized measurement of the level of pathogen infection in host leaves. Moreover, results from this study suggest that this technique may be applicable for evaluation of plant resistance to a pathogen, fungicide efficacy, and to investigate the ecology and epidemiology of plant pathogens. The V. vinifera probe/primer set was designed on resveratrol synthase I (RS I), which is responsible for phytoalexin production (4). This marker served as a normalizer between samples and an internal positive control (IPC). The presence of a normalizer is fundamental in assays in which the objective is quantification of a pathogen, and in which the amount of pathogen DNA and the amount of host DNA are estimated simultaneously from the total extracted genomic DNA of infected leaves. Assuming that a standardized sampling procedure (see below) is available, it is reasonable to consider the amount of host DNA as mostly constant, whereas the amount of pathogen DNA is a variable, depending on infection incidence. Variability among samples can be also introduced by differences in DNA extraction efficiency, PCR efficiency, and pipetting volumes. In our study, these problems are solved by performing multiplex PCR reactions with speciesspecific primers and fluorogenic TaqMan probes labeled with different dyes, thereby enabling simultaneous one-tube quantification of pathogen and host PCR products. By adopting this strategy, reliable pathogen quantity estimates can be obtained. Since the aim of this project was the development of a method that would enable quantification of pathogen DNA in host tissue, standard curve development with known amounts of target DNA was needed to relate threshold cycles (CTs) to the initial quantity of the template present in the samples (nanograms). Results of multiplex real-time quantitative PCR are shown as infection coefficient (IC) or ratio of CT V. vinifera over CT P. viticola. The greater this ratio, the greater the quantity of pathogen DNA in the sample; and therefore, the greater the host infection level (Fig. 6). Quantification of samples, whose averages of CT of replicates show small standard deviations, is possible and can be performed by interpolation of the average CT values with the regression equation. Normalized estimates of P. viticola colonization of V. vinifera leaves are expressed as the estimated amount of P. viticola DNA divided by the estimated amount of V. vinifera DNA in picograms of pathogen DNA per nanogram of host DNA. The technique assumes that all field isolates of P. viticola have the same number of rDNA repeats. Since no literature is available on this topic, the same mix of P. viticola strains should always be used to perform inoculations to avoid any influence of possible variability of rDNA copy number on quantification results. Standard curves show that DNAs differing in starting quantities over four orders of magnitude can be reliably detected in the linear dynamic range of the TaqMan system. This enables accurate quantification of P. viticola in leaf tissues at every infection stage. Hence, noninfected, low infected, and highly infected leaves all are quantifiable in the same assay, without performing further dilutions of the most concentrated samples. That is confirmed by the results of the method sensitivity test, which show that our method allows for differentiation between infections in Vitis spp., with different degrees of resistance. Moreover, this test demonstrated that our method can be also applied to necrotic lesions (Fig. 6).
High reliability of the TaqMan assay developed in this study is confirmed by the results of analyses of the three components that influence TaqMan assay consistency. The first component, namely intra-assay precision, is affected by reaction-to-reaction differences in PCR efficiencies, pipetting volumes, and measurements among wells (16). Intra-assay precision is high; in fact low standard deviation values were obtained for DNA from infected plant material (Fig. 3), for pure P. viticola DNA, and pure V. vinifera DNA (data not shown). Hence, the number of replicates of each sample that should be run for each assay can be reduced to a minimum of three. The second component influencing TaqMan assay reproducibility is inter-assay variability, which is also influenced by differences in reaction components (16). Data normalization by using calibrator DNA plays a key role in correcting inter-assay variability, and therefore, permits more reliable inter-assay comparison. Inter-sample reproducibility, a third component influencing TaqMan assay consistency, mainly depends on sample selection (16). Reproducibility of the TaqMan assay critically decreases with respect to this third component. Inter-sample reproducibility can be guaranteed only by performing optimal sample preparation and selection. To overcome the problem of high standard deviations (Fig. 5), the following improvements in the sampling strategy are suggested: i) the same plant variety must be used; and ii) leaf discs of the same area must be cut off from leaves of the same age and equivalent leaf zones to ensure as much similarity and homogeneity as possible among test replicates. As suggested by the results obtained when quantifying pathogen levels in cultivars with different levels of host resistance (Fig. 6), sporulation levels in different samples can impact the accuracy of the results obtained. For this reason, iii) leaf samples should be washed to remove adhering sporangia prior to DNA extraction or iv) sporulation should be avoided by incubating the infected leaf discs less than 4 days (the quickest and most cost effective way to solve this problem) with a relative humidity of