Plant Disease • 2017 • 101:2079-2087 • https://doi.org/10.1094/PDIS-04-17-0468-RE
Development and Validation of KASP-SNP Markers for QTL Underlying Resistance to Stripe Rust in Common Wheat Cultivar P10057 Jianhui Wu, Qilin Wang, and Zhensheng Kang,† State Key Laboratory of Crop Stress Biology for Arid Areas, College of Plant Protection, Northwest A&F University, Yangling, Shaanxi 712100, P. R. China; Shengjie Liu, Haiyang Li, Jingmei Mu, Miaofei Dai, and Dejun Han,† State Key Laboratory of Crop Stress Biology for Arid Areas, College of Agronomy, Northwest A&F University, Yangling, Shaanxi 712100, P. R. China; Qingdong Zeng, State Key Laboratory of Crop Stress Biology for Arid Areas, College of Life Science, Northwest A&F University, Yangling, Shaanxi 712100, P. R. China; Xianming Chen, Wheat Health, Genetics, and Quality Research Unit, Agricultural Research Service, United States Department of Agriculture, and Department of Plant Pathology, Washington State University, Pullman, WA
Abstract Stripe rust (Puccinia striiformis f. sp. tritici) is among the most important diseases of wheat (Triticum aestivum L.) globally. Utilization of adult plant resistance (APR) constitutes a key tool for maintaining protection against this disease. The CIMMYT wheat cultivar P10057 displayed a high level of APR to stripe rust in germplasm evaluation in field environments. To clarify the genetic basis and identify quantitative trait loci (QTLs) involved in stripe rust resistance in P10057, three wheat populations were used: 150 F5:6 recombinant inbred lines (RILs) derived from the cross Mingxian 169 × P10057, and 161 and 140 F2:3 lines from Avocet S × P10057 and Zhengmai 9023 × P10057, respectively. These three populations were evaluated for infection type (IT) and disease severity (DS) in Shaanxi, Gansu, and Sichuan during the 2014–15 and 2015–16 cropping seasons. Genotyping was performed with Kompetitive Allelic Specific PCR (KASP) and simple sequence repeat (SSR)
markers linked to the resistance loci. Using QTL analysis, two genomic regions associated with resistance were found on chromosome arms 2BS and 3BS, respectively. These two stable QTLs, designated Qyrlov. nwafu-2BS and Qyrlov.nwafu-3BS, were detected across all environments and explained average 22.6 to 31.6% and 21.3 to 32.3% of stripe rust severity phenotypic variation, respectively. Qyrlov.nwafu-2BS may be the resistance allele derived from CIMMYT germplasm and Qyrlov. nwafu-3BS likely corresponds to the locus Sr2/Lr27/Yr30/Pbc. The KASP markers IWA5377, IWA2674, and IWA5830 linked to QYrlov. nwafu-2BS and IWB57990 and IWB6491 linked to Qyrlov.nwafu-3BS were reliable for marker-assisted selection (MAS) in the Zhengmai 9023 × P10057 population. These QTLs with KASP markers are expected to contribute in developing wheat cultivars with improved stripe rust resistance.
Stripe rust or yellow rust (YR) disease, caused by Puccinia striiformis f. sp. tritici (Pst), occurs on wheat (Triticum aestivum L.) throughout the world (Beddow et al. 2015; Hovmøller et al. 2010; McIntosh et al. 1995). In China, the disease occurs periodically in almost all winter wheat-growing regions (Chen et al. 2014; Li and Zeng 2002; Wan et al. 2007). Susceptible wheat cultivars regularly suffer yield reductions of 5 to 25% (Chen 2005; Wellings 2011). Moreover, stripe rust can significantly reduce wheat grain quality and also increases the cost of production due to the use of chemical control (Chen 2014). Growing wheat cultivars with diverse resistance is conducive to enhancing wheat production in a more economic, effective, and environmentally friendly manner (Li and Zeng 2002; McIntosh et al. 1995; Wiesnerhanks and Nelson 2016). Virulence evolution of rust pathogens influence deployment of resistance genes, where such variants enable new races to overcome widely applied race-specific resistance genes, making them ineffective (Niks et al. 2015). In China, much of the research indicates that virulence variations and diversification in races and their frequencies have corresponded to stripe rust epidemics, which in turn led to changes in wheat cultivars (Chen et al. 2009, 2014; Duan et al. 2010; Han et al. 2015; Liu et al. 2010; Wan et al. 2004, 2007). For example, race CYR29, first detected in 1985, caused epidemics on cultivars carrying Yr9 in the 1990s, and races CYR31 and CYR32, virulent to wheat
cultivars with Yr3b and Yr4b (such as Hybrid 46, Fan 6, and its derivatives), resulted in yield losses of 1.3 million tonnes in 2002 (Wan et al. 2004). Race CYR33, with virulence on cv. Suwon 11, was first detected in 1997 and has become one of the most predominant races since 2008 (Chen et al. 2009). The emerging races CYR34 (Yr26-virulent) are becoming prevalent and threatening many cultivars with Yr26 (Han et al. 2015). Many researchers are devoted to mining for stripe rust resistance globally. To date, approximately 80 Yr genes have been officially designated and most of them have been widely used in many countries (McIntosh et al. 2016, 2017). However, the vast majority of genes are no longer effective in China owing to their race specificity (Han et al. 2015; Sharma-Poudyal et al. 2013; Zeng et al. 2014). Of these race-specific resistance genes, most confer all stage resistance (ASR) as they express during whole growth stages of plant. These ASR genes are vulnerable to the newly evolving virulent races and they are generally considered to have a limited life span (Johnson 1981). In contrast, adult plant resistance (APR) or race nonspecific resistance is often controlled by quantitatively inherited loci (Chen 2013). Consequently, APR is often considered as one of the key components of durable resistance. More than 200 Pst resistance quantitative trait loci (QTLs) on 21 wheat chromosomes have been reported and summarized in other publications (Maccaferri et al. 2015; McIntosh et al. 2016, 2017; Rosewarne et al. 2013). These QTLs illustrate genetic diversity and contribute to pyramiding different QTLs to accomplish adequate levels of resistance. However, marker-assisted selection (MAS) was always limited to the lack of efficient molecular markers as these early markers are sometimes ineffective for mapping genes in chromosomal regions with low gene density (St. Clair 2010; Yang et al. 2015). The advent of next generation sequencing and high-throughput SNP-based genotyping technologies has revolutionized wheat research, facilitating faster development of markers linked to traits of interest for use in breeding (Wang et al. 2015). Current SNP assay platforms, including Illumina Bead Array, Affymetrix Gene Chip, and Kompetitive Allele Specific PCR (KASP, http://www.Lgcgenomics.com), have been rapidly adopted in mapping
†
Corresponding authors: D. J. Han; E-mail:
[email protected]; and Z. S. Kang; E-mail:
[email protected]
J. H. Wu and Q. L. Wang contributed equally to this work. *The e-Xtra logo stands for “electronic extra” and indicates that three supplementary tables are published online. Accepted for publication 14 July 2017. © 2017 The American Phytopathological Society
Plant Disease / December 2017
2079
and MAS studies (Allen et al. 2017; Cavanagh et al. 2013; Rasheed et al. 2016; Wang et al. 2014). KASP has become a marker system of choice in wheat due to its low cost, locus specificity, and efficiency (Semagn et al. 2014). P10057 with the pedigree Lov23-Bjy“S”/Bb-Nor67 × Cno67“S” is a wheat cultivar produced by the International Maize and Wheat Improvement Center (CIMMYT 1983). We have tested P10057 with stripe rust in field nurseries located in Shaanxi and Gansu since 2008 and found that P10057 consistently displays resistance against prevalent Chinese Pst races at the adult plant stage, despite having intermediate reactions to Pst at seedling stage (Han et al. 2012).The goals of this study were to (i) detect APR QTLs for stripe rust using molecular markers across multiple environments, (ii) validate QTLs in different genetic backgrounds and assess additive effects of QTLs for reducing stripe rust severity, and (iii) test the applicability of linked KASP markers for marker-based selection.
Materials and Methods Plant materials and population establishment. Two wheat populations were used to identify and validate APR QTLs, i.e., 150 F5:6 recombinant inbred lines (RILs) developed by single-seed descent from the cross Mingxian 169 × P10057 and 161 F2:3 lines were obtained from 168 F2 plants by the cross of Avocet S × P10057. P10057, provided by Prof. Wanquan Ji (Northwest A&F University, Yangling, Shaanxi, China) displays high levels of APR in field despite intermediate reactions to Chinese Pst races at the seedling stage in the greenhouse. Mingxian 169 is an old Chinese winter wheat landrace displaying susceptibility to all Pst races in China and Avocet S is a highly susceptible spring wheat selection from Australia. A third wheat population comprising 140 F2:3 lines from 148 F2 plants by the cross of Zhengmai 9023 × P10057 was established for examining the adaptability of the linked markers for marker-based selection. Zhengmai 9023 is a leading wheat cultivar in China, but it is susceptible to the current prevalent Pst races. Wheat cultivars IDO444, Kariega, Kenya Kudu, Louise, Luke, and Opata 85 were included in QTL comparisons by marker analysis. The wheat cultivars (or lines) Avocet S (AvS), Zhengmai 9023 (ZM9023), Mingxian 169 (MX169), and Xiaoyan 22 (XY22) were used as susceptible controls throughout the study. Field tests. The 150 F5:6 RIL population from MX169 × P10057 and parents were evaluated in the field experiment farm at Yangling, Shaanxi Province (34°17¢N, 108°04¢E, altitude 519 m); Tianshui, Gansu Province (34°27¢N, 105°56¢E, altitude 1,697 m); and Jiangyou, Sichuan Province (31°53¢N, 104°47¢E, altitude 571 m) during 2015–16. The 161 F2:3 lines from AvS × P10057 were tested at Yangling and Tianshui during 2014–15 and the 140 F2:3 lines from ZM9023 × P10057
were tested at Yangling during 2015–16. An individual trial with each year location was considered a single environment. Tianshui and Jiangyou are considered hotspot regions for stripe rust in China with ideal conditions for this disease natural occurrence, the experiments were conducted under naturally infected conditions. Plants at Yangling were inoculated with urediniospores of prevalent race CYR32 suspended in liquid paraffin (1:300) sprayed onto MX169 plants in the spreader rows at flag leaf emergence. All F5:6 trials were arranged in a randomized complete block design with three replicates, while F2:3 trials with two replicates. An individual plot consisted of a single 100-cm row with 30 cm between adjacent rows. Each plot was sown with approximately 30 seeds of each progeny line or parent. The parents and susceptible variety XY22 were planted every 20 rows throughout the field. Susceptible control MX169 was planted in 5-row blocks after every 50 rows and around the field area. XY22 and MX169 served as inoculum spreaders to ensure uniform stripe rust development throughout the field. Infection type (IT) and disease severity (DS) were scored 18 to 20 days postflowering, when stripe rust severity levels on MX169, AvS, and XY22 reached their maxima around 15 to 20 May at Yangling, 10 to 15 June at Tianshui, and 10 to 15 April at Jiangyou. Infection type (IT) data were recorded for each line based on the 0 to 9 scale as described by Line and Qayoum (1992). Disease severity was assessed visually using percentage diseased leaf area based on the modified Cobb scale (Peterson et al. 1948). For homozygous lines, IT and DS were recorded as single values; and for segregating lines, IT and DS were recorded as two or more values, but later analyzed as a mean value for each line. Bulk segregant analysis. DNA samples were extracted from fresh leaves of parents, F2 plants, and F5:6 RILs at the jointing stage in field following Song et al. (1994). Based on stripe rust response phenotypes of F2:3 lines from AvS × P10057 at both sites in 2015, an equivalence mixture of five homozygous highly resistant (IT 1 to 2, DS # 10) F2 DNA was formed as the resistant bulk, the other equivalence mixture of five homozygous highly susceptible (IT 8 to 9, DS $ 85) F2 DNA was formed as the susceptible DNA bulk (Michelmore et al. 1991). A set of 1,375 microsatellite (SSR) markers (Somers et al. 2004) selected for high genome coverage were used to screen polymorphic markers between the resistant parent P10057 and susceptible parents AvS, and between the resistant DNA (R-bulk) and susceptible DNA (S-bulk) bulks. The sequence of SSR primers were acquired in the website of GrainGenes (https://wheat.pw.usda.gov/GG3/). To develop KASP-SNP markers, 90K iSelect SNP array was performed to genotype the bulks that along with the parents in CapitalBio Corporation (Beijing, China; http://www.capitalbio.com). SNP genotype calling and clustering was processed with the polyploidy version of GenomeStudio software (Illumina, http://www.illumina.com).
Table 1. Adult plant disease responses to stripe rust were evaluated in parents Mingxian 169 (MX169), Avocet S (AvS), Zhengmai 9023 (ZM9023), P10057, and their progenies, across different environments and years Environment
No. of population
Infection type (IT) YL2014–15b TS2014–15 YL2015–16c TS2015–16 JY2015–16 YL2015–16d Disease severity (DS) YL2014–15 TS2014–15 YL2015–16 TS2015–16 JY2015–16 YL2015–16d a
MX169
AvS
ZM9023
P10057
Mean
Range
160 161 150 150 150 140
9 9 9 -
8.5 9 -
8 8
0.5 1 1 1 1.5 1
4.5 5.1 4.8 4.7 4.4 3.9
0–8.5 1–9 1–6 0.5–8.5 1–9 1–8.5
160 161 150 150 150 140
90 90 95 -
35.1 43.5 30.9 31.3 30.1 27.5
0–87.5 5–100 1–90 0.5–90 1–95 0–80
85 95 -
75 75
1 5 10 5 10 2
SD
P-valuea
2.8 3.1 6.5 5.8 6.3 3.7
1.6 1.8 2.6 2.4 2.5 1.9
0.0459 0.0002 0.0001 0.0006 0.0004 0.0032
352.6 347.8 622.3 523.9 633.6 368.6
18.8 18.6 24.9 22.9 25.2 19.2
0.0008 0.0087 0.0001 0.0001 0.0003 0.0004
Variance
SD, standard deviation.
b YL, TS, and JY are short for Yangling, Tianshui, and Jiangyou, respectively; 2014–15 represents the 161 F 2:3 lines from AvS/P10057 grown during the 2014–15
cropping season. 2015–16 represents the 150 F5:6 RILs from MX169/P10057 grown during the 2015–16 cropping season. d 2015–16 represents the 140 F 2:3 lines from ZM9023/P10057 grown during the 2015–16 cropping season. c
2080
Plant Disease / Vol. 101 No. 12
SNP filtering criteria are followed: polymorphism, good quality showing less than 10% missing values, distinct in calling or with major allele frequencies above 95%. The polymorphic SNPs associated with resistance in BSA contained homozygous and heterozygous genotypes. Only homozygous genotype differences were localized to chromosomes based on the high-density 90K map (Wang et al. 2014). Molecular marker assays and genotyping. The wheat SSR and KASP primer synthesis was carried out by Invitrogen Trading Co., Ltd (Shanghai, China). SSR markers showing associations with stripe rust response in the BSA were used to genotype the genetic populations. The SSR assays were implemented in a S1000 thermal cycler (BIO-RAD) with reaction mixtures (15 ml) containing 50 to 100 ng of template DNA, 1.0 U of Taq DNA polymerase, 1.5 ml of 10× buffer (50 mM KCl, 10 mM of Tris-HCl, pH 8.3), 2.0 mM of MgCl2, 200 mM of dNTPs, and 1.0 mM of the forward and reverse primers. The PCR program was the following: hotstart at 94°C for 4 min, 15 touchdown cycles (94°C for 30 s; touchdown 65°C, –1°C per cycle, 45 s; 72°C for 1 min), followed by 20 cycles of amplification (94°C for 30 s, 50°C for 45 s, 72°C for 1 min), and a final extension for 10 min at 72°C. PCR products were distinguished in 6% denaturing polyacrylamide gels, visualized using silver staining for polyacrylamide gels, and photographed. Based on the consensus genetic map, KASP markers were developed for polymorphic SNPs with PolyMarker (Ramirez-Gonzalez et al. 2015). The specific-chromosome KASP markers were used to screen the parents and bulks to confirm their polymorphisms before genotyping the entire population. KASP assays were performed in 384 well plate format following the protocol of LGC Genomics. Reaction mixtures consisted of final volumes of 5 ml containing 2.5 ml of genomic DNA (50 to 100 ng), 2.5 ml of 2× KASP master mix (V4.0, LGC Genomics), and 0.014 ml of primer mix (12 mM of each allele-specific primer and 30 mM of common primer). A Veriti 384-well thermal cycler (Applied Biosystems) was used with
cycling conditions: denaturation at 95°C for 15 min, nine cycles of 95°C for 20 s, touchdown starting at 65°C for 60 s (decreasing 0.8°C per cycle), finally followed by 30 to 40 cycles of amplification (95°C for 20 s; 57°C for 60 s). End-point fluorescence data were Table 2. Variance components of infection type (IT) and disease severity (DS) scores for F2:3 lines derived from AvS × P10057, F2:3 lines derived from ZM9023 × P10057, and F5:6 recombinant inbred line (RIL) population derived from MX169 × P10057a IT
DS
Source of variation
Df
Mean square
Df
Mean square
F2:3 lines Replicates Environment Line × environment Error s2g b h2b c F2:3 Lines Replicates Error s2g h2b F5:6 RILs Replicates Environment Line × environment Error s2g h2b
160 2 1 159 317 2.39 0.90 139 1 139 2.60 0.80 149 6 2 298 891 5.03 0.89
10.16*** 18.21*** 19.27*** 0.51* 0.64
160 6 2 159 317 315.16 0.86 139 1 139 108.5 0.75 149 6 2 298 891 505.31 0.80
1,301.71** 2,812.19** 3,686.37** 45.27*** 48.88
a
17.60*** 7.66***
45.68*** 12.04* 61.86*** 5.17*** 0.55
302.7*** 163.56*
4,573.94*** 2,141.50*** 11,622.74*** 376.32*** 36.26
*, **, and *** indicate significance at P < 0.05, 0.01, and 0.001, respectively. means genetic variance. means broad-sense heritability.
b s2 g c h2 b
Fig. 1. Phenotypes of MX169, AvS, ZM9023, P10057, and their progenies across all environments and data collected 18 to 20 days postflowering. A and B, Frequency distribution of mean infection types (IT) and disease severity (DS) for the 161 F2:3 lines from AvS × P10057 at Yangling and Tianshui in 2014–15; C and D, 140 F2:3 lines from ZM9023 × P10057 at Yangling in 2015–16; E and F, frequency distribution of mean IT and DS for 154 F5:6 RILs from MX169 × P10057 at Yangling, Jiangyou, and Tianshui in 2015–16. Black arrows indicate the values of the parental lines. Plant Disease / December 2017
2081
visualized with a microplate reader (FLUOstar Omega, BMG LABTECH, Germany) and analyzed using Klustering Caller software (LGC, Middlesex, U.K.). Construction of genetic map and QTL analysis. Genotypic data from our populations were used to construct genetic linkage maps with the regression function in the software JoinMap version 4.0 (Van Ooijen 2006) and maps were drawn by Mapchart V2.3 (Voorrips 2002). Genetic distances were calculated as centiMorgans (cM) using the Kosambi mapping function (Kosambi 1943) and a logarithm of odds (LOD) score of 3.0 was used as a threshold. On the basis of wheat deletion maps published by Sourdille et al. (2004) and the GrainGenes database (http://wheat.pw.usda.gov/GG3/), the SSR markers of each linkage group were assigned to wheat chromosome bins. QTL mapping was conducted with the software QTL IciMapping V4.1 (Meng et al. 2015; Wang 2009; http://www.isbreeding.net) using an inclusive composite interval mapping (ICIM) analysis. The significant LOD threshold of 2.5 was set to declare a significant QTL. The mean IT and DS score for each F2:3 line and F5:6 RIL at each environment were used in the respective QTL analysis. The phenotypic variances explained (PVE) by individual QTLs were also obtained using ICIM. Statistical analysis of phenotypic data. Mean IT and DS of each F2:3 line and F5:6 RIL were used in analyses of variance (ANOVA). Analyses of variance and Pearson’s correlation coefficients were implemented with AOV functionality in the QTL IciMapping Table 3. Correlation coefficients (r) of mean disease severity (DS) and infection type (IT) of the AvS × P10057-derived F2:3 lines across two environments and F5:6 RIL population from MX169 × P10057 in the three environments Environment
YL2014–15
TS2014–15
YL2015–16
TS2015–16
JY2015–16
YL2014–15a TS2014–15 YL2015–16c TS2015–16 JY2015–16
1 0.84 (0.79)b -
1 -
1 0.79 (0.68) 0.85 (0.76)
1 0.82 (0.73)
1
a
YL, TS, and JY are short for Yangling, Tianshui, and Jiangyou, respectively; 2014–15 represents the 161 F2:3 lines from AvS/P10057 grown during the 2014–15 cropping season. b r values based on IT data are given in parentheses. All r values were significant at P < 0.001. c 2015–16 represents the 150 F 5:6 lines from MX169/P10057 grown during the 2015–16 cropping season.
V 4.1 software package. Broad-sense heritability (h2b ) of stripe rust resistance was calculated by h2b = s2g =ðs2g + s2ge =e + s2« =reÞ, where s2g is (MSf – MSfe)/re, s2ge is (MSfe – MSe)/r, and s2« is MSe; in this formula, s2g = genetic variance, s2ge = genotype × environment interaction variance, s2« = error variance, MSf = mean square of genotypes, MS fe = mean square of genotype × environment interaction, MS e = mean square of error, and e and r represent the numbers of environments and replicates, respectively.
Results Phenotypic evaluation. In all field experiments, P10057 was consistently resistant (IT 1 to 2, DS < 10%), while MX169 (IT 9, DS > 90%), AvS (IT 9, DS > 85%), and ZM9023 (IT 8, DS > 75%) were susceptible (Table 1 and Fig. 1C and D). Mean IT and DS on 161 F2:3 lines from AvS × P10057 ranged between 4.5 and 5.1, and between 35.1 and 43.5% in Yangling and Tianshui during 2014–15, respectively; mean IT and DS for 150 F5:6 RILs from MX169 × P10057 ranged between 4.4 and 4.8, and 30.1% and 31.3% in three locations during 2015–16, respectively; mean IT and DS on 140 F2:3 lines from ZM9023 × P10057 were 3.9 and 27.5 Yangling during 2015–16, respectively (Table 1). The frequency distribution of F2:3 lines and F5:6 RILs in the experiments showed a continuous variation and approximately normal distributions over the six environments (Fig. 1), suggesting the quantitative inheritance of APR to stripe rust. ANOVA was performed based on all data sets for IT and DS of F2:3 lines and F5:6 RILs, respectively. For F2:3 lines from AvS × P10057, the broad-sense heritability values were estimated at 0.90 and 0.86 for IT and DS (Table 2), with correlation coefficients of 0.79 and 0.84, respectively (P < 0.001) (Table 3). For F2:3 lines from ZM9023 × P10057, the heritability values were estimated at 0.80 and 0.75 for IT and DS (Table 2). For F5:6 RILs from MX169 × P10057, the heritability was 0.89 and 0.80 for IT and DS, respectively (Table 2), with corresponding correlation coefficients ranging from 0.68 to 0.85 (P < 0.001) (Table 3). ANOVA revealed significant differences in IT and DS among lines, environments, replicates within environments, and line × environment interactions in the field experiments (Table 2). Linkage maps and QTL analysis in F2:3 population. The population from the AvS × P10057 cross was firstly used for detecting stripe rust QTL. Eleven SSR markers out of 1,375 showed polymorphism between the parents and between the bulks. Based on the wheat SSR maps of Somers et al. (2004) and Sourdille et al. (2004), these 11 SSRs
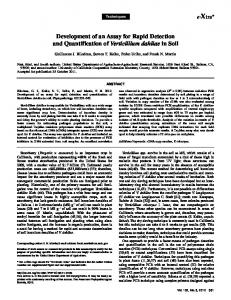
Fig. 2. Distribution of the polymorphic SNPs from the 90K SNP array in each chromosome (A) and its corresponding percentage (B). The genotypic data were produced from the bulks that along with the parents AvS and P10057. 2082
Plant Disease / Vol. 101 No. 12
are assigned on chromosome arms 2BS and 3BS. A total of 739 SNPs showed polymorphisms between the DNA bulks after genotyping by the 90K SNP array; 225 and 121 of these SNPs were located on chromosome 2B and 3B, respectively, while the others were distributed across other chromosomes (Fig. 2A). Moreover, the proportion of SNPs overlap between bulks and parents is highest on chromosomes 2B and 3B (Fig. 2B). The results accorded with the SSR indicating the SNPs in 2B and 3B were extremely likely associated with the resistance loci. Based on the consensus genetic map (Maccaferri et al. 2015), 42 chromosome-specific SNPs selected for conversion to KASP markers were screened in the parents and bulks to confirm their polymorphisms and 24 out of 42 markers failed to distinguish the parents and bulks. The sequences of the polymorphic KASP markers are listed in Supplementary Table S1.
Two linkage maps were constructed using the 17 KASP and 11 SSR markers with the 161 F2:3 lines (Fig. 3A and B). Using both IT and DS data in each of the two environments, two QTLs underpinning resistance to stripe rust were detected on chromosome arms 2BS and 3BS with the ICIM analysis. The QTL on 2BS, designated QYrlov.nwafu-2BS, was significant at the threshold LOD of 2.5 with the average peak LOD values being 17.5 to 19.4 (Fig. 3A; Table 4), and explained 23.1 to 31.6% of the phenotypic variation (Table 4). The other QTL on 3BS, designated Qyrlov.nwafu-3BS, was also significant with the average peak LOD values being 27.3 to 30.1 (Fig. 3B; Table 4), and explained 32.3 to 43.2% of the phenotypic variation (Table 4). The resistance alleles at QYrlov.nwafu-2BS and Qyrlov.nwafu-3BS were all contributed by P10057.
Fig. 3. Linkage maps and LOD scores obtained by inclusive composite interval mapping (ICIM) of QTLs for stripe rust response. Linkage maps of stripe rust resistance loci QYrlov. nwafu-2BS and Qyrlov.nwafu-3BS by using F2:3 lines (A and B) and F5:6 RILs (D and F). C, Deletion bin locations of QYrlov.nwafu-2BS in 2BS and E, Qyrlov.nwafu-3BS in 3BS indicated by SSR markers. Plant Disease / December 2017
2083
Validation of the QTLs using F 5:6 RILs and effect of QTL combinations. The F5:6 RIL population (MX169 × P10057) as a different genetic background was used for validating QYrlov.nwafu-2BS and Qyrlov.nwafu-3BS. SSR and KASP markers on chromosomes 2B and 3B were used for reevaluating their polymorphisms in MX169, P10057, and bulks before genotyping the entire population. A second set of genetic maps were constructed using 30 markers and the orders of the markers for these maps were similar to those for the F2:3 population (Fig. 3). The two major QTL for stripe rust resistance were also detected by ICIM analysis using mean IT and DS data across environments (Fig. 3D and F). QYrlov.nwafu-2BS and Qyrlov.nwafu-3BS exhibited their average peak LOD scores of 9.6 to 9.7 and 8.8 to 9.2, and explained 22.6 to 23.2% and 20.6 to 21.3% of the phenotypic variation, respectively (Table 4). The peak of QYrlov.nwafu-2BS was in the marker interval between IWA2674 (wsnp_Ex_c22018_31193171) and IWA5830 (wsnp_JD_c13359_13373795) spanning 2.5 cM and Qyrlov.nwafu3BS was between IWB57990 (RAC875_c43871_478) and IWB6491 (BS00011904_51) spanning 3.3 cM. According to the published deletion maps of Sourdille et al. (2004) and the consensus genetic map in Maccaferri et al. (2015), QYrlov.nwafu-2BS and Qyrlov.nwafu-3BS were very likely located in the region 2BS-1-0.36 and 3BS-8-0.78, respectively (Fig. 3C and E). An additive effect with significance for stripe rust resistance was found in RILs. When these two QTLs were combined, the disease
severity values in such lines ranged from 8.9 to 12.4% across three environments, lower than those with only one QTL, but similar to the resistant parent (Fig. 4A; Supplementary Table S2). The result was obtained using the BIP functionality of the QTL IciMapping V 4.1 software by the significant additive effects (P < 0.01). QTL comparisons on 2BS by KASP markers. The CIMMYTderived wheat cultivars IDO444, Kariega, Kenya Kudu, Louise, Luke, and Opata 85 were collected for molecular analysis as they have been reported to carry an APR gene or QTL on 2BS in a previous study (Rosewarne et al. 2013). KASP markers IWA2674, IWA5830, IWA4472, and IWA5377 linked to the 2BS QTL were used for evaluation and the same alleles of KASP markers were found in the above cultivars (Table 5). IDO444 and the susceptible germplasms did not have common alleles with P10057. Selection for QYrlov.nwafu-2BS and QYrlov.nwafu-3BS by the linked markers. In order to ascertain the adaptability of KASP markers to selection for QYrlov.nwafu-2BS and Qyrlov.nwafu-3BS, the 140 F2:3 population from the cross ZM9023 × P10057 was genotyped and phenotyped. According to the presence/absence of homozygous flanking markers to surmise one or both QTLs, a total of four genotype categories were identified. Figure 4B and Supplementary Table S3 show the temporal progress of stripe rust and the differences in the mean DS values of the four groups. Lines with two QTLs had lower DS values than those with one QTL (P < 0.01) and lines without any of the QTLs were similar to the susceptible parent (P < 0.01),
Table 4. Summary of stripe rust resistance QTLs detected by ICIM in the AvS × P10057 F2:3 population across two environments and in the MX169 × P10057 F5:6 population across three environments Infection type (IT) Population Qyrlov.nwafu-2BS AvS/P10057
MX169/P10057
Qyrlov.nwafu-3BS AvS/P10057
MX169/P10057
a
Disease severity (DS)
Marker interval
LODa
Addb
PVEc
LOD
Add
PVE
YL2014–15 TS2014–15 Average YL2015–16 TS2015–16 JY2015–16 Average
IWA2674—IWA5830 IWA5377—IWA5830 IWA5377—IWA5830 IWA2674—IWA5830 IWA2674—IWA5830 IWA2674—IWA5830 IWA2674—IWA5830
19.3 15.8 17.5 4.8 6.7 10.7 9.6
–1.1 –1.1 –1.1 –0.8 –0.9 –1.3 –1.0
23.8 22.2 23.1 12.4 17.5 27.3 23.2
28.4 21.1 19.3 6.3 7.6 10.4 9.7
–12.9 –14.9 –13.5 –9.2 –9.4 –12.1 –10.2
29.3 32.7 31.6 15.2 18.9 25.9 22.6
YL2014–15 TS2014–15 Average YL2015–16 TS2015–16 JY2015–16 Average
Xwmc430—IWB6491 IWB57990—IWB6491 Xwmc430—IWB6491 IWB57990—IWB6491 IWB57990—IWB6491 IWB57990—IWB6491 IWB57990—IWB6491
29.9 23.5 27.3 7.4 6.9 5.7 8.8
–1.5 –1.5 –1.5 –1.1 –0.9 –0.9 –1.0
46.4 29.8 43.2 20.4 18.0 12.7 20.6
22.3 16.7 30.1 9.0 7.7 6.2 9.2
–18.4 –12.9 –16.7 –11.1 –9.3 –8.9 –9.8
36.3 26.3 32.3 22.8 19.2 14.6 21.3
Environment
LOD, logarithm of odds score. additive effect of resistance allele. PVE, percentages of the phenotypic variance explained by individual QTLs.
b Add, c
Fig. 4. The effects of QTL combinations on stripe rust scores among different classes. A, Comparison of mean disease severity (DS) among the parents and F5:6 RILs derived from MX169 × P10057 with both-, single-, and no QTL. Numbers in the brackets indicate the number of RILs in each class. Different letters on bar charts of different groups indicate significant differences. B, Comparison between the selection for QYrlov.nwafu-2BS and Qyrlov.nwafu-3BS based on their linked KASP markers with their effect on stripe rust progress as observed 7, 14, and 20 days postflowering (3 May, 10 May, 16 May) in the field. The assessment was performed on the ZM9023 × P10057 population. 2084
Plant Disease / Vol. 101 No. 12
indicating that the flanking KASP markers linked to the QTL were reliable for marker assisted selection.
Discussion In a previous study, wheat line P10057 was identified to confer APR to stripe rust in field environment despite intermediate reactions to Chinese Pst races at the seedling stage in the greenhouse (Han et al. 2012). Here, using phenotypic data and molecular markers, the resistance to stripe rust in P10057 was characterized as quantitative inheritance and two QTLs with additive effects were consistently identified by ICIM analysis across the different genetic backgrounds and environments. The QTLs controlling APR possessed very large effects on the reduction of stripe rust severity. QTLs on chromosome arm 2BS. QYrlov.nwafu-2BS was located on chromosome arm 2BS flanked by KASP markers IWA2674 and IWA5830. There are many genes (Yr27, Yr31, Yr41, YrC51, YrF, YrH9014, YrKK, YrP81, YrSP, and YrTp1) reported previously in resistance gene-rich chromosome arm 2BS region and all confer allstage or race-specific resistance (Maccaferri et al. 2015). Most of these genes have been ineffective to Chinese Pst races (Zeng et al. 2015; Zheng et al. 2014), whereas YrKK possesses complete resistance in adult plants despite having slight reduction in seedlings. YrKK is derived from CIMMYT common wheat cultivar Kenya Kudu (Li et al. 2013) and was mapped in the intervals between Xgwm148 and Xwmc474, containing the region of QYrlov.nwafu2BS. In addition, several stripe rust QTLs with major APR effects on chromosome arm 2BS have been reported and located in a similar region (Rosewarne et al. 2013), i.e., QYrlu.cau-2BS1 and QYrlu.cau2BS2 in Luke, QYrid.ui-2B.1 and QYrid.ui-2B.2 in IDO444, QYr.sgi2B.1 in Kariega, QYrlo.wpg-2BS in Louise, QYr-2B in Opata 85, and QYr.inra-2B.1 in Camp Remy (Boukhatem et al. 2002; Carter et al. 2009; Chen et al. 2012; Guo et al. 2008; Mallard et al. 2005; Prins et al. 2011). Pedigree analyses indicated that Luke, Kariega, and Opata 85 were derived from CIMMYT germplasm. Louise has a relationship with Luke through the common parent Brevor. Moreover, Kariega, Kenya Kudu, Louise, Luke, and Opata 85 shared the alleles of KASP markers in P10057 in our study. Based on the origins and molecular detection assays, this indicates that at least some of the resistance loci may be same alleles, but allelism tests need to be undertaken further to confirm it. QTLs on chromosome arm 3BS. Chromosome arm 3BS is also a resistance gene-rich region including many genes or QTL for stripe rust resistance (Rosewarne et al. 2013). Based on the consensus genetic map (Maccaferri et al. 2015), most of these QTL are probably in the same region spanning 0 to 16.5 cM. Yr30 (Singh et al. 2000), Sr2 (Spielmeyer et al. 2003), Lr27 (Mago et al. 2011) and pseudo-black chaff (PBC) (Hare and McIntosh 1979) were all closely linked to Table 5. Alleles of KASP markers flanking Qyrlov.nwafu-2BS in P10057, Avocet S (AvS), Mingxian 169 (MX169), Zhengmai 9023 (ZM9023), susceptible checks, and six wheat cultivars Phenotype in field
Qyrlov.nwafu-2BS markers
Wheat line
Yangling
Tianshui
IWA2674
IWA5830
IWA4472
IWA5377
P10057 AvS MX169 ZM9023 XY22 IDO444 Kariega Kenya Kudu Luke Louise Opata 85
1Ra 100S 100S 85S 95S 10R 10R 5R 10R 10R 5R
5R 100S 100S 95S 100S 5R -c 10R
CCb TT TT TT TT TT CC CC CC CC CC
AA GG GG GG GG GG AA AA AA AA AA
AA GG GG GG GG GG AA AA AA AA AA
CC TT TT TT TT TT CC CC CC CC CC
a
A field response was a combination of disease severity recorded as a single value for each accession at each site from 0 to 100% of the foliage infected using the Peterson et al. (1948) scale, and R = resistant, MR = moderately resistant, M = moderately resistant to moderately susceptible, MS = moderately susceptible, and S = susceptible. b CC means the SNP genotype. c No data.
Xgwm533. PBC can be used as a morphological marker since the glumes and nodes gradually darken in late-filling stage of wheat growth. This locus, designated Sr2/Lr27/Yr30/Pbc conferring resistance against multiple pathogens, and the QTL associated with Yr30 have been previously identified in this region in several studies (Dedryver et al. 2009; Rosewarne et al. 2012; William et al. 2006; Yang et al. 2013). In the present study, the KASP markers IWB57990 and IWB6491 linked to Qyrlov.nwafu-3BS were close to Xgwm389 and Xgwm533, respectively (Fig. 3B and F). Moreover, P10057 showed dark glumes during the wheat late-filling stage and the glumes colors of progenies were basically corresponding to the haplotypes of KASP markers. Qyrlov.nwafu-3BS, corresponding to Sr2/Lr27/Yr30/Pbc, had an effect on APR resistance as seen by IT scores and DS values in P10057, which were significantly lower than those of the susceptible parent. Effectiveness of QTLs and combination of QTLs for MAS in wheat breeding. Qyrlov.nwafu-2BS and Qyrlov.nwafu-3BS stably expressed in three populations of AvS × P10057, MX169 × P10057, and ZM9023 × P10057. AvS, MX169, and ZM9023 have different genetic backgrounds as they do not have common ancestors. Qyrlov.nwafu-2BS and Qyrlov.nwafu-3BS were significant in all environments (Yangling 2014 to 2016, Tianshui 2014 to 2016, Jiangyou 2015 to 2016), with the overall average PVE value range of 22.6 to 31.6% and 21.3 to 32.3% of stripe rust severity phenotypic variation, respectively. The QTLs with large effects should be useful for marker-assisted selection (MAS), especially those that are consistently detected across diverse environments (Chen 2013). In the present study, selection for Qyrlov.nwafu-2BS was based on the KASP markers IWA2674, IWA5830, and IWA5377, and selection for Qyrlov.nwafu-3BS was based on IWB57990 and IWB6491 using the ZM9023 × P10057 population. ZM9023, developed by Prof. Weigang Xu (Henan Academy of Agricultural Science, Zhengzhou, China), has been an elite wheat cultivar commercially planted over one million hectares annually on average in China since 2003, but the cultivar is susceptible to the current prevalent Chinese Pst races. Choosing ZM9023 as a receptor parent is in conformity with the practical situation because transferring a resistance gene or QTL into a leading material is one of optimal selections for stripe rust resistant breeding. Based on our results, the KASP markers linked to these two QTLs were reliable for MAS and the lines with the combination of the two QTLs demonstrated an adequate level of resistance. Additionally, these closely linked markers enable breeders to effectively select or identify the presence of the resistance QTLs.
Acknowledgments This study was financially supported by the National Basic Research Program of China (no. 2013CB127700), the National Key Research and Development Program of China (grant no. 2016YFE0108600), the earmarked fund for Modern Agro-industry Technology Research System (no. CARS-3-1-11), and the National Natural Science Foundation of China (31371924).
Literature Cited Allen, A. M., Winfield, M. O., Burridge, A. J., Downie, R. C., Benbow, H. R., Barker, G. L. A., Wilkinson, P. A., Coghill, J., Waterfall, C., Davassi, A., Scopes, G., Pirani, A., Webster, T., Brew, F., Bloor, C., Griffiths, S., Bentley, A. R., Alda, M., Jack, P., Phillips, A. L., and Edwards, K. J. 2017. Characterization of a wheat breeders’ array suitable for high-throughput SNP genotyping of global accessions of hexaploid bread wheat (Triticum aestivum). Plant Biotechnol. J. 15:390-401. Beddow, J. M., Pardey, P. G., Chai, Y., Hurley, T. M., Kriticos, D. J., Braun, H., Park, R. F., Cuddy, W. S., and Yonow, T. 2015. Research investment implications of shifts in the global geography of wheat stripe rust. Nat. Plants 1:1-5. Boukhatem, N., Baret, P. V., Mingeot, D., and Jacquemin, J. M. 2002. Quantitative trait loci for resistance against Yellow rust in two wheat-derived recombinant inbred line populations. Theor. Appl. Genet. 104:111-118. Carter, A. H., Chen, X. M., Garland-Campbell, K., and Kidwell, K. K. 2009. Identifying QTL for high-temperature adult-plant resistance to stripe rust (Puccinia striiformis f. sp tritici) in the spring wheat (Triticum aestivum L.) cultivar ‘Louise’. Theor. Appl. Genet. 119:1119-1128. Cavanagh, C. R., Chao, S., Wang, S., Huang, B. E., Stephen, S., Kiani, S., Forrest, K., Saintenac, C., Brown-Guedira, G. L., Akhunova, A., See, D., Bai, G., Pumphrey, M., Tomar, L., Wong, D., Kong, S., Reynolds, M., Da Silva, M. L., Bockelman, H., Talbert, L., Anderson, J. A., Dreisigacker, S., Baenziger,
Plant Disease / December 2017
2085
S., Carter, A., Korzun, V., Morrell, P. L., Dubcovsky, J., Morell, M. K., Sorrells, M. E., Hayden, M. J., and Akhunov, E. 2013. Genome-wide comparative diversity uncovers multiple targets of selection for improvement in hexaploid wheat landraces and cultivars. Proc. Nat. Acad. Sci. 110:8057-8062. Chen, J., Chu, C., Souza, E. J., Guttieri, M. J., Chen, X., Xu, S., Hole, D., and Zemetra, R. 2012. Genome-wide identification of QTL conferring hightemperature adult-plant (HTAP) resistance to stripe rust (Puccinia striiformis f. sp. tritici) in wheat. Mol. Breed. 29:791-800. Chen, W. Q., Wellings, C., Chen, X. M., Kang, Z. S., and Liu, T. G. 2014. Wheat stripe (yellow) rust caused by Puccinia striiformis f. sp. tritici. Mol. Plant Pathol. 15:433-446. Chen, W. Q., Wu, L. R., Liu, T. G., Xu, S. C., Jin, S. L., Peng, Y. L., and Wang, B. T. 2009. Race dynamics, diversity, and virulence evolution in Puccinia striiformis f. sp. tritici, the causal agent of wheat stripe rust in China from 2003 to 2007. Plant Dis. 93:1093-1101. Chen, X. M. 2005. Epidemiology and control of stripe rust [Puccinia striiformis f. sp. tritici] on wheat. Can. J. Plant Pathol. 27:314-337. Chen, X. M. 2013. High-temperature adult-plant resistance, key for sustainable control of stripe rust. Am. J. Plant Sci. 4:608-627. Chen, X. M. 2014. Integration of cultivar resistance and fungicide application for control of wheat stripe rust. Can. J. Plant Pathol. 36:311-326. CIMMYT. 1983. Page 167 in: Report on Wheat Improvement. International Maize and Wheat Improvement Center, Mexico. Dedryver, F., Paillard, S., Mallard, S., Robert, O., Trottet, M., Negre, S., Verplancke, G., and Jahier, J. 2009. Characterization of genetic components involved in durable resistance to stripe rust in the bread wheat ‘Renan’. Phytopathology 99: 968-973. Duan, X., Tellier, A., Wan, A., Leconte, M., de Vallavieille-Pope, C., and Enjalbert, J. 2010. Puccinia striiformis f. sp. tritici presents high diversity and recombination in the over-summering zone of Gansu, China. Mycologia 102:44-53. Guo, Q., Zhang, Z. J., Xu, Y. B., Li, G. H., Feng, J., and Zhou, Y. 2008. Quantitative trait loci for high-temperature adult-plant and slow-rusting resistance to Puccinia striiformis f. sp. tritici in wheat cultivars. Phytopathology 98:803-809. Han, D. J., Wang, Q. L., Chen, X. M., Zeng, Q. D., Wu, J. H., Xue, W. B., Zhan, G. M., Huang, L. L., and Kang, Z. S. 2015. Emerging Yr26-virulent races of Puccinia striiformis f. sp. tritici are threatening wheat production in the Sichuan Basin, China. Plant Dis. 99:754-760. Han, D. J., Zhang, P. Y., Wang, Q. L., Zeng, Q. D., Wu, J. H., Zhou, X. L., Wang, X. J., Huang, L. L., and Kang, Z. S. 2012. Identification and evaluation of resistance to stripe rust in 1980 wheat landraces and abroad germplasm. Sci Agric Sin. 45:5013-5023. Hare, R. A., and McIntosh, R. A. 1979. Genetic and cytogenetic studies of durable adult-plant resistances in Hope and related cultivars to wheat rusts. 83:350-367. Hovmøller, M. S., Walter, S., and Justesen, A. F. 2010. Escalating threat of wheat rusts. Science 329:369. Johnson, R. 1981. Durable resistance, definition of genetic control, and attainment in plant breeding. Phytopathology 71:567-568. Kosambi, D. D. 1943. The estimation of map distances from recombination values. Ann. Eugen. 12:172-175. Li, Z., Singh, S., Singh, R. P., L´opez-Vera, E. E., and Huerta-Espino, J. 2013. Genetics of resistance to yellow rust in PBW343 × Kenya Kudu recombinant inbred line population and mapping of a new resistance gene YrKK. Mol. Breed. 32:821-829. Li, Z. Q., and Zeng, S. M., eds. 2002. Wheat Rust in China. China Agriculture Press, Beijing. Line, R. F., and Qayoum, A. 1992. Virulence, aggressiveness, evolution, and distribution of races of Puccinia striiformis (the cause of stripe rust of wheat) in North America 1968-1987. US Department of Agriculture Technical Bulletin No. 1788, Washington, DC. Liu, T. G., Peng, Y. L., Chen, W. Q., and Zhang, Z. Y. 2010. First detection of virulence in Puccinia striiformis f. sp. tritici in China to resistance genes Yr24 (= Yr26) present in wheat cultivar Chuanmai 42. Plant Dis. 94:1163. Maccaferri, M., Zhang, J., Bulli, P., Abate, Z., Chao, S., Cantu, D., Bossolini, E., Chen, X., Pumphrey, M., and Dubcovsky, J. 2015. A genome-wide association study of resistance to stripe rust (Puccinia striiformis f. sp. tritici) in a worldwide collection of hexaploid spring wheat (Triticum aestivum L.). G3 (Bethesda) 5:449-465. Mago, R., Brown-Guedira, G., Dreisigacker, S., Breen, J., Jin, Y., Singh, R., Appels, R., Lagudah, E. S., Ellis, J., and Spielmeyer, W. 2011. An accurate DNA marker assay for stem rust resistance gene Sr2 in wheat. Theor. Appl. Genet. 122:735-744. Mallard, S., Gaudet, D., Aldeia, A., Abelard, C., Besnard, A. L., Sourdille, P., and Dedryver, F. 2005. Genetic analysis of durable resistance to yellow rust in bread wheat. Theor. Appl. Genet. 110:1401-1409. McIntosh, R. A., Dubcovsky, J., Rogers, J., Morris, C., Appels, R., and Xia, X. C. 2016. Catalogue of gene symbols for wheat: 2015-2016 Supplement. https:// shigen.nig.ac.jp/wheat/komugi/genes/macgene/supplement2015.pdf McIntosh, R. A., Dubcovsky, J., Rogers, W. J., Morris, C., and Xia, X. C. 2017. Catalogue of gene symbols for wheat: 2017 Supplement. https://shigen.nig. ac.jp/wheat/komugi/genes/macgene/supplement2017.pdf McIntosh, R. A., Wellings, C. R., and Park, R. F. 1995. Pages 20-26 in: Wheat Rusts: An Atlas of Resistance Genes. CSIRO Publications, East Melbourne, VIC, Australia.
2086
Plant Disease / Vol. 101 No. 12
Meng, L., Li, H. H., Zhang, L. Y., and Wang, J. K. 2015. QTL IciMapping: Consensus software for genetic linkage map construction and quantitative trait locus mapping in biparental populations. Crop J. 3:269-283. Michelmore, R. W., Paran, I., and Kesseli, R. V. 1991. Identification of markers linked to disease-resistance genes by bulked segregant analysis: a rapid method to detect markers in specific genomic regions by using segregating populations. Proc. Natl. Acad. Sci. USA 88:9828-9832. Niks, R. E., Qi, X., and Marcel, T. C. 2015. Quantitative resistance to biotrophic filamentous plant pathogens: concepts, misconceptions, and mechanisms. Annu. Rev. Phytopathol. 53:445-470. Peterson, R. F., Campbell, A. B., and Hannah, A. E. 1948. A diagrammatic scale for estimating rust intensity on leaves and stems of cereals. Can. J. Res. 26c:496-500. Prins, R., Pretorius, Z. A., Bender, C. M., and Lehmensiek, A. 2011. QTL mapping of stripe, leaf and stem rust resistance genes in a Kariega × Avocet S doubled haploid wheat population. Mol. Breed. 27:259-270. Ramirez-Gonzalez, R. H., Uauy, C., and Caccamo, M. 2015. PolyMarker: A fast polyploid primer design pipeline. Bioinformatics 31:2038-2039. Rasheed, A., Wen, W., Gao, F., Zhai, S., Jin, H., Liu, J., Guo, Q., Zhang, Y., Dreisigacker, S., Xia, X., and He, Z. 2016. Development and validation of KASP assays for genes underpinning key economic traits in bread wheat. Theor. Appl. Genet. 129:1843-1860. Rosewarne, G. M., Herrera-Foessel, S. A., Singh, R. P., Huerta-Espino, J., Lan, C. X., and He, Z. H. 2013. Quantitative trait loci of stripe rust resistance in wheat. Theor. Appl. Genet. 126:2427-2449. Rosewarne, G. M., Singh, R. P., Huerta-Espino, J., Herrera-Foessel, S. A., Forrest, K. L., Hayden, M. J., and Rebetzke, G. J. 2012. Analysis of leaf and stripe rust severities reveals pathotype changes and multiple minor QTL associated with resistance in an Avocet × Pastor wheat population. Theor. Appl. Genet. 124: 1283-1294. Semagn, K., Babu, R., Hearne, S., and Olsen, M. 2014. Single nucleotide polymorphism genotyping using Kompetitive Allele Specific PCR (KASP): overview of the technology and its application in crop improvement. Mol. Breed. 33:1-14. Sharma-Poudyal, D., Chen, X. M., Wan, A. M., Zhan, G. M., Kang, Z. S., Cao, S. Q., Jin, S. L., Morgounov, A., Akin, B., Mert, Z., Shah, S. J. A., Bux, H., Ashraf, M., Sharma, R. C., Madariaga, R., Puri, K. D., Wellings, C., Xi, K. Q., Wanyera, R., Manninger, K., Ganzalez, M. I., Koyda, M., Sanin, S., and Patzek, L. J. 2013. Virulence characterization of international collections of the wheat stripe rust pathogen, Puccinia striiformis f. sp. tritici. Plant Dis. 97:379-386. Singh, R. P., Nelson, J. C., and Sorrells, M. E. 2000. Mapping Yr28 and other genes for resistance to stripe rust in wheat. Crop Sci. 40:1148-1155. Somers, D. J., Isaac, P., and Edwards, K. 2004. A high-density microsatellite consensus map for bread wheat (Triticum aestivum L.). Theor. Appl. Genet. 109:1105-1114. Song, W. N., Ko, L., and Henry, R. J. 1994. Polymorphisms in the a-amy1 gene of wild and cultivated barley revealed by the polymerase chain reaction. Theor. Appl. Genet. 89:509-513. Sourdille, P., Singh, S., Cadalen, T., Brown-Guedira, G. L., Gay, G., Qi, L., Gill, B. S., Dufour, P., Murigneux, A., and Bernard, M. 2004. Microsatellite-based deletion bin system for the establishment of genetic-physical map relationships in wheat (Triticum aestivum L.). Funct. Integr. Genomics 4:12-25. Spielmeyer, W., Sharp, P. J., and Lagudah, E. S. 2003. Identification and validation of markers linked to broad-spectrum stem rust resistance gene Sr2 in wheat (Triticum aestivum L.). Crop Sci. 43:333-336. St. Clair, D. A. 2010. Quantitative Disease Resistance and Quantitative Resistance Loci in Breeding. Annu. Rev. Phytopathol. 48:247-268. Van Ooijen, J. W. 2006. JoinMap4, software for the calculation of genetic linkage maps in experimental populations. Kyazma BV, Wageningen, The Netherlands. Voorrips, R. E. 2002. MapChart: Software for the graphical presentation of linkage maps and QTL. J. Hered. 93:77-78. Wan, A. M., Chen, X. M., and He, Z. H. 2007. Wheat stripe rust in China. Crop Pasture Sci. 58:605-619. Wan, A. M., Zhao, Z. H., Chen, X. M., He, Z. H., Jin, S. L., Jia, Q. Z., Yao, G., Yang, J. X., Wang, B. T., Li, G. B., Bi, Y. Q., and Yuan, Z. Y. 2004. Wheat stripe rust epidemic and virulence of Puccinia striiformis f. sp. tritici in China in 2002. Plant Dis. 88:896-904. Wang, J. 2009. Inclusive composite interval mapping of quantitative trait genes. Acta Agron. Sin. 35:239-245. Wang, M., Wang, S., and Xia, G. 2015. From genome to gene: a new epoch for wheat research? Trends Plant Sci. 20:380-387. Wang, S., Wong, D., Forrest, K., Allen, A., Chao, S., Huang, B. E., Maccaferri, M., Salvi, S., Milner, S. G., Cattivelli, L., Mastrangelo, A. M., Whan, A., Stephen, S., Barker, G., Wieseke, R., Plieske, J., Lillemo, M., Mather, D., Appels, R., Dolferus, R., Brown-Guedira, G., Korol, A., Akhunova, A. R., Feuillet, C., Salse, J., Morgante, M., Pozniak, C., Luo, M., Dvorak, J., Morell, M., Dubcovsky, J., Ganal, M., Tuberosa, R., Lawley, C., Mikoulitch, I., Cavanagh, C., Edwards, K. J., Hayden, M., and Akhunov, E. 2014. Characterization of polyploid wheat genomic diversity using a high-density 90 000 single nucleotide polymorphism array. Plant Biotechnol. J. 12:787-796. Wellings, C. R. 2011. Global status of stripe rust: a review of historical and current threats. Euphytica 179:129-141. Wiesnerhanks, T., and Nelson, R. 2016. Multiple disease resistance in plants. Annu. Rev. Phytopathol. 54:8.1-8.24.
William, H. M., Singh, R. P., Huerta-Espino, J., Palacios, G., and Suenaga, K. 2006. Characterization of genetic loci conferring adult plant resistance to leaf rust and stripe rust in spring wheat. Genome 49:977-990. Yang, E. N., Rosewarne, G. M., Herrera-Foessel, S. A., Huerta-Espino, J., Tang, Z. X., Sun, C. F., Ren, Z. L., and Singh, R. P. 2013. QTL analysis of the spring wheat “Chapio” identifies stable stripe rust resistance despite inter-continental genotype × environment interactions. Theor. Appl. Genet. 126:1721-1732. Yang, H., Li, C., Lam, H. M., Clements, J., Yan, G., and Zhao, S. C. 2015. Sequencing consolidates molecular markers with plant breeding practice. Theor. Appl. Genet. 128:779-795.
Zeng, Q. D., Han, D. J., Wang, Q. L., Yuan, F. P., Wu, J. H., Zhang, L., Wang, X. J., Huang, L. L., Chen, X. M., and Kang, Z. S. 2014. Stripe rust resistance and genes in Chinese wheat cultivars and breeding lines. Euphytica 196:271-284. Zeng, Q. D., Shen, C., Yuan, F., Wang, Q., Wu, J., Xue, W., Zhan, G., Yao, S., Chen, W., Huang, L. L., Han, D. J., and Kang, Z. S. 2015. The resistance evaluation of the Yr genes to the main prevalent pathotypes of Puccinia striiformis f. sp. tritici in China. Acta Phytopathol. Sin. 45:641-650. Zheng, J., Yan, Z., Zhao, L., Li, S., Zhang, Z., Garry, R., Yang, W., and Pu, Z. 2014. Molecular mapping of a stripe rust resistance gene in wheat line C51. J. Genet. 93:443-450.
Plant Disease / December 2017
2087