Pappada et al. Patient Safety in Surgery 2010, 4:15 http://www.pssjournal.com/content/4/1/15
RESEARCH
Open Access
Development of a neural network model for predicting glucose levels in a surgical critical care setting Scott M Pappada1, Marilyn J Borst2, Brent D Cameron1,3, Raymond E Bourey1,3, Jason D Lather2, Desmond Shipp2, Antonio Chiricolo2, Thomas J Papadimos2,4*
Abstract Development of neural network models for the prediction of glucose levels in critically ill patients through the application of continuous glucose monitoring may provide enhanced patient outcomes. Here we demonstrate the utilization of a predictive model in real-time bedside monitoring. Such modeling may provide intelligent/directed therapy recommendations, guidance, and ultimately automation, in the near future as a means of providing optimal patient safety and care in the provision of insulin drips to prevent hyperglycemia and hypoglycemia. Background Following severe trauma, approximately 25% of patients experience hyperglycemia [1]. Sustained hyperglycemia increases mortality and increases care needs [2-4]. However, lowering glucose levels after severe trauma may decrease mortality, days of ventilation, incidence of infection, and length of stay in an intensive care unit (ICU) and in the hospital [2-5]. Aggressive therapy to maintain glucose levels below 150 mg/dl improves outcomes [3]. Glucose levels exceeding 200 mg/dl in severely injured patients have been correlated to an increase in mortality [2]. In addition to trauma patients, cardiothoracic surgical patients also experience lack of glycemic control during all phases of the perioperative period. Persistently elevated glucose values in this patient base have also been linked to adverse outcomes and increases in mortality [6-8]. The standard method for management of glycemic control in critical care patients is adjustment of a variable infusion of insulin on the basis of discrete point of care (POC) blood glucose monitoring via handheld glucose meters [9]. This POC monitoring is completed every 1-4 hours throughout a patient’s length of stay in the ICU. Based on POC glucose values, insulin is infused intravenously to maintain a normal glycemic state. This practice * Correspondence:
[email protected] 2 University of Toledo Medical Center, Toledo, Ohio, USA Full list of author information is available at the end of the article
is limited as POC monitoring only provides glucose values when measurements are obtained every 1-4 hours. Patients may be hyperglycemic or hypoglycemic between POC results. Recent advances in technology include the development of real-time continuous glucose monitoring (CGM) devices which report measurements of interstitial glucose concentration every few minutes. A recent investigation studied the impact of utilizing real-time CGM in the critical care setting [10]. The study concluded that utilization of CGM did not correlate to a direct benefit in patient outcome. However, utilization of CGM did correlate with improvement of glycemic control in patients with high sequential organ failure (SOFA) scores, and increased the ability of caregivers to mitigate occurrences of hypoglycemia. It is important to note that CGM devices were utilized only for documentation of glucose values and were not used in a predictive capacity. Utilization of CGM devices in combination with predictive models for glucose may provide clinicians with a means for enhancement of glycemic control and patient outcome. Given the limitations of POC monitoring there is a need to develop technologies to allow critical care providers access to predicted glucose values thereby allowing optimization of glycemic control. The prediction of glucose in outpatients with insulin dependent diabetes via a neural network modeling approach has been previously demonstrated [11]. This report is an extension of the previous application, and involves the development and
© 2010 Pappada et al; licensee BioMed Central Ltd. This is an Open Access article distributed under the terms of the Creative Commons Attribution License (http://creativecommons.org/licenses/by/2.0), which permits unrestricted use, distribution, and reproduction in any medium, provided the original work is properly cited.
Pappada et al. Patient Safety in Surgery 2010, 4:15 http://www.pssjournal.com/content/4/1/15
optimization of neural network models for real-time prediction of glucose in critical care patients. Such networks have the ability to quantify the effect of various factors on a desired predicted variable. Neural network modeling is therefore well suited in such a venue, where various factors such as, but not limited to, medications, vital signs, nutritional intake, and ventilation data are routinely collected in a controlled setting. Construction of a neural network model for prediction of glucose in the critical care setting requires a large dataset for model training and development. The utilization of CGM provides a significant and suitable source of glucose data for neural network model development. Such a dataset is superior to a dataset containing only discrete POC values. Furthermore, this allows for assessment of trends in glucose which cannot be distinguished in POC glucose monitoring results.
Methods Patient Data Acquisition and Development of Patient Specific and General Neural Network Models for Prediction of Glucose in the Critical Care Setting
After institutional review board approval a patient specific neural network model was developed/trained using 243.6 hours (2,923 data points) of continuous glucose monitoring (CGM) (Medtronic Diabetes, CGMS Ipro®) and concurrent medical records data from a 38 year old trauma patient (who had an
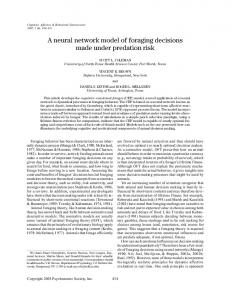
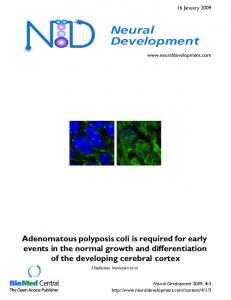
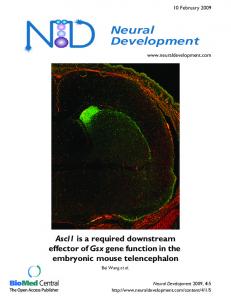
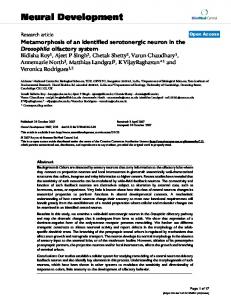
Figure 1 Neural network architecture and data flow.
Page 2 of 5
intensive care stay of 16 days). The model was configured for prediction of glucose by implementing a prediction horizon of 75 minutes. Additionally, a general feed forward neural network was developed/trained using 515.7 hours (6,188 data points) of CGM and medical records data from 5 critical care patients and configured with the same 75 minute prediction horizon. Neural Network Model Design and Training
The neural network models were trained via the backpropagation training algorithm. In this training modality, model error is calculated, and model weights for minimization of this error can be determined. The neural network models were designed with a three layer design. The input layer of the neural network was configured to utilize time, CGM data, and electronic medical records that included point of care glucose test times and results, insulin delivery type (intravenous drip, or subcutaneous sliding scale), and units of insulin delivered as input variables for prediction. The second or hidden layer of the neural network was designed to limit the range of neural network model inputs to between -1 and 1. This enables data within the neural network to be more easily processed and for trends in data to be identified more effectively. Figure 1 includes the neural network model architecture and dataflow in generation of model predictions.
Pappada et al. Patient Safety in Surgery 2010, 4:15 http://www.pssjournal.com/content/4/1/15
Page 3 of 5
Neural Network Model Performance Analysis and Validation
Table 1 Percentages of hyper-and hypoglycemia detected by point-of-care testing
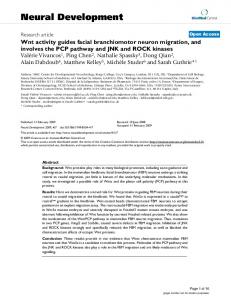
A computer program implementing the neural network model for real-time prediction of glucose was developed. Data from the trauma patient not utilized for initial model development/training (containing 40.3 hours [484 data points] of CGM and medical records) was used to test the performance of the patient specific and general neural network models. Clarke Error Grid Analysis (CEGA) was completed to assess clinical acceptability of real-time predictions. Overall error (mean absolute difference percent [MAD%]) was calculated for real-time predictions. CEGA was established in 1987 and was originally utilized to assess patient estimates of blood glucose compared to those obtained using a “gold-standard” reference glucose meter [12]. The accuracy of current CGM technologies is also assessed via utilization of CEGA to compare CGM performance to that of blood glucose meters. Region A contains predicted values within 20% of the reference concentration and Region B contains predictions outside 20%. However, Region B predicted values would not lead to inappropriate treatment. Regions A and B therefore contain predicted values which can be classified as clinically acceptable. Region C contains points that lead to unnecessary treatments, and Region D contains points indicating a potentially dangerous failure to detect hypoglycemia. Region E contains predicted values that would confuse treatment of hypoglycemia for hyperglycemia and vice-versa. A successful predictive model and system would thus need a majority of predicted CGM values to fall with regions A and B in the Clarke Error Grid. If a majority of predicted values fall within regions A and B of the Clark Error Grid, any therapeutic interventions made using the NNM predictive results would not lead to any adverse or unwanted glycemic excursions.
Glucose
% Detected
% Detected at
% Detected at
Range
at 40 min
60 min
80 min
Hyper
51.4
74.0
96.9
Hypo
61.3
91.9
100.0
Analysis of the Clinical Applicability and Usefulness of CGM and Neural Network Model for Prediction of Glucose in the Trauma Patient
In addition to performance analysis of the neural network model, the utility of CGM in the trauma patient was analyzed. This was accomplished by determining the percentage of hypoglycemic (≤70 mg/dl) and hyperglycemic (≥150 mg/dl) events that were detected by CGM and not by conventional POC glucose monitoring. In this analysis we locate hypoglycemic and hyperglycemic CGM values and search for POC monitoring values within a defined time window. A time window of 60 minutes is defined as 30 minutes before and 30 minutes after the detected extreme. If there is a POC value within the time window it is defined as a successful detection of hypoglycemia/hyperglycemia via POC monitoring. Table 1 demonstrates the usefulness of CGM in
min = minutes; % = percentage; hyper = hyperglycemia; hypo = hypoglycemia
detecting hypoglycemic and hyperglycemic glucose values which are not detected via conventional POC monitoring. This table summarizes the percentage of hypoglycemic/hyperglycemic CGM values detected via POC monitoring.
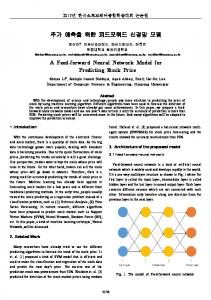
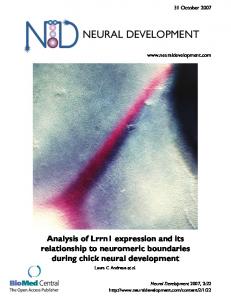
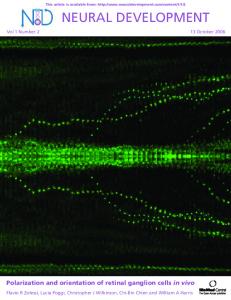
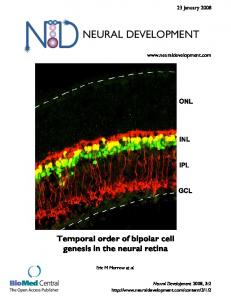
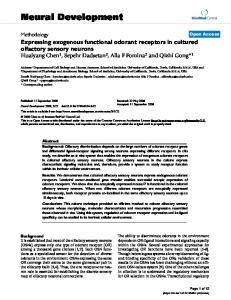
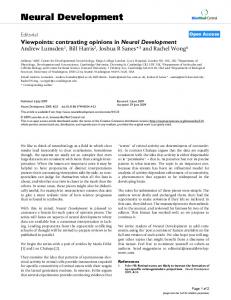
Results Throughout the patient’s length of stay in the ICU, CGM detected a total of 642 hyperglycemic and 124 hypoglycemic occurrences. The patient was on an insulin drip throughout their length of stay in intensive care and POC glucose monitoring was completed intensively. Table 1 indicates that the prediction horizon of 75 minutes implemented in the NNMs is likely ideal for this patient population and will provide insight where POC glucose values are not obtained. Figure 2 includes the real-time predictions on the test dataset using the patient specific neural network model. Due to the large dataset of 7,260 predicted glucose values (i.e. 15 CGM values predicted for every CGM value in the test dataset) the data was re-sampled to demonstrate predictive accuracy in Figures 2 and 3. Resampling involved plotting every 20th predicted CGM value and corresponding actual glucose value in the predictive dataset. The overall error (MAD%) of the predictions generated using the patient specific model was calculated as 7.9%. Figure 3 includes the real-time predictions on the test dataset using the general neural network model. The overall error (MAD%) of the predictions generated using the general model was calculated as 15.9%. The patient specific model therefore generates more accurate predictions with a decrease in overall error of 8.0%. Figure 4 is the Clarke Error Grid showing the realtime predictions generated via the patient specific neural network model. CEGA revealed that 95.1% of the predictions fell within region A of the error grid and 4.9% fell within region B of the error grid. Figure 5 is the Clarke Error Grid showing the real-time predictions generated via the general neural network model. CEGA revealed that 69.8% of the predictions fell within region A of the error grid and 30.2% fell within region B of the error grid. In both instances 100% of the predicted CGM values could be considered clinically acceptable with no predicted values falling within regions C, D, or
Pappada et al. Patient Safety in Surgery 2010, 4:15 http://www.pssjournal.com/content/4/1/15
Page 4 of 5
Figure 2 Real-time predictions generated using patient specific model. conc. = concentration; mg = milligrams; dl = deciliter.
E of the error grid. CEGA also revealed that the patient specific model generated predictions with a high degree of accuracy as 95.1% of the values fell within region A of the error grid and had values within 20% of the reference glucose concentration.
Discussion The real-time application of a neural network model for glycemic prediction in critical care patients will provide significant insight to glycemic excursions at points in time where POC glucose values are not obtained. The ability to predict glucose concentration during these time domains would provide caregivers a means of
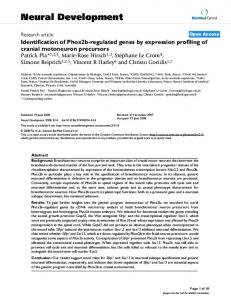
Figure 3 Real-time predictions generated using general model. conc. = concentration; mg = milligrams; dl = deciliter.
Figure 4 Clark error grid of predictions generated by patient specific model. mg = milligrams; dl = deciliter.
modifying insulin dosages and therapy for optimization of glycemic control. The optimization of glycemic control in critical care trauma patients could reduce morbidity, and mortality in these patients [1-5]. This is also fundamentally true in cardiac surgery patients who were used as part of the modeling process [6-8].
Figure 5 Clark error grid of predictions by general model. mg = milligrams; dl = deciliter.
Pappada et al. Patient Safety in Surgery 2010, 4:15 http://www.pssjournal.com/content/4/1/15
CEGA was developed in 1987 for use in the quantification and assessment of patient’s estimates of their blood glucose levels compared with the value obtained by a meter [12]. It was later used to compare the clinical accuracy of blood glucose levels generated by meters/ monitors compared to reference, and it was utilized in this report because it has become the gold standard for blood glucose meter accuracy [13]. The utilization of this predictive model in real-time bedside monitoring for intelligent/directed therapy recommendation, guidance, and ultimately automation, will provide caregivers a means of enhancing patient safety and care. Furthermore, CGM identifies hypoglycemic and hyperglycemic excursions where conventional POC glucose values are not obtained, and results of this investigation demonstrate the utility of CGM in the critical care trauma setting. For the patients with an extended length of stay in the ICU, the results of this investigation substantiate the position that a patient specific neural network model (generated and trained with data from a single patient) may provide increased clinical performance and safety at the bedside. Further clinical trials will need to be pursued.
Conclusions Utilization of CGM in this patient population is clinically useful. Further investigation regarding the development and optimization of the real-time implementation of the neural network for prediction of glucose is ongoing and warranted based on this preliminary report. Consent Written informed consent was obtained from the patient for publication of this report and any accompanying images. A copy of the written consent is available for review by the Editor-in-Chief.
Page 5 of 5
References 1. Sung J, Bochicchio GV, Joshi M: Admission hyperglycemia is predictive of outcome in critically ill trauma patients. J Trauma 2005, 59:80-83. 2. Bochicchio GV, Sung J, Joshi M: Persistent hyperglycemia is predictive of outcome in critically ill trauma patients. J Trauma 2005, 58:921-924. 3. Collier B, Diaz J Jr, Forbes R: The impact of a normoglycemic management protocol on clinical outcomes in the trauma intensive care unit. Parenter Enteral Nutr 2005, 29:353-358. 4. Laird AM, Miller PR, Preston R, Kilgo PD, Chang MC: Relationship of early hyperglycemia to mortality in trauma patients. J Trauma 2004, 56:1058-1062. 5. Yendamuri S, Fulda GJ, Tinkoff GA: Admission hyperglycemia as a prognostic indicator in trauma. J Trauma 2003, 55:33-38. 6. Jessen M: Glucose control during cardiac surgery: how sweet it is. J Thorac Cardiovasc Surg 2003, 125:985-987. 7. Jones KW, Cain AS, Mitchel JH, Millar RC, Rimmasch HL, French TK, Abbate SL, Roberts CA, Stenson SR, Marshall D, Lappe DL: Hyperglycemia predicts mortality after CABG: postoperative hyperglycemia predicts dramatic increases in mortality after coronary artery bypass grafting. J Diabetes Complications 2008, 22:365-370. 8. Doenst T, Wijeysundera D, Karkouti K, Zechner C, Magnant M, Rao V, Borger MA: Hyperglycemia during cardiopulmonary bypass is an independent risk factor for mortality in patients undergoing cardiovascular surgery. J Thorac Cardiovasc Surg 2005, 130:1144.e1-1144.e8. 9. Kanji S, Buffie J, Hutton B, et al: Reliability of point-of-care testing for glucose measurement in critically ill adults. Critical Care Medicine 2005, 33:2778-2785. 10. Holzinger U, Warszawska J, Kitzberger R, et al: Real-Time Continuous Glucose Monitoring in Critically Ill Patients. Diabetes Care 2010, 33:467-472. 11. Pappada SM, Cameron BD, Rosman PM: Development of a neural network for prediction of glucose in type I diabetes patients. J Diabetes Sci Technol 2008, 2:792-801. 12. Clark WL, Gonder-Federick LA, Carter W, Pohl SL: Evaluating clinical accuracy of systems for self-monitoring of blood glucose. Diabetes Care 1987, 10:622-628. 13. Kovatchev BP, Gonder-Federick LA, Cox DJ, Clark WL: Evaluating the accuracy of continuous glucose-monitoring sensors. Diabetes Care 2004, 27:1922-1928. doi:10.1186/1754-9493-4-15 Cite this article as: Pappada et al.: Development of a neural network model for predicting glucose levels in a surgical critical care setting. Patient Safety in Surgery 2010 4:15.
Author details 1 University of Toledo, Department of Bioengineering, Toledo, Ohio, USA. 2 University of Toledo Medical Center, Toledo, Ohio, USA. 3University of Toledo, Center for Diabetes and Endocrine Research, Toledo, Ohio, USA. 4The Ohio State University Medical Center, Columbus, Ohio, USA. Authors’ contributions SMP and BDC conceived and wrote the mathematical algorithm. TJP, SMP, BDC, and RJB were involved in conception and design. JDL, DS, TS, TJP, MJB, SMP, and AC were involved in data acquisition. TJP and MJB cared for the patient. All authors were involved in interpretation of the data. TJP, MJB, SMP, AC, and BDC were involved in drafting the manuscript or revising it for critically important intellectual content. All authors have given final approval of the version to be published.
Submit your next manuscript to BioMed Central and take full advantage of: • Convenient online submission • Thorough peer review • No space constraints or color figure charges
Competing interests The authors declare that they have no competing interests.
• Immediate publication on acceptance • Inclusion in PubMed, CAS, Scopus and Google Scholar
Received: 22 May 2010 Accepted: 9 September 2010 Published: 9 September 2010
• Research which is freely available for redistribution Submit your manuscript at www.biomedcentral.com/submit