2017년 한국소프트웨어종합학술대회 논문집
주가 예측을 위한 피드포워드 신경망 모델 이신터0, 모흐신자바이드, 아사드아바스, 이욱진 한양대학교 컴퓨터공학과
[email protected],
[email protected],
[email protected],
[email protected]
A Feed-forward Neural Network Model for Predicting Stock Price Xintao Li0, Mohsin Javaid Siddiqui, Asad Abbas, Scott Uk-Jin Lee Department of Computer Science & Engineering, Hanyang University Abstract With the development of science and technology, people pay more attention to predicting the price of stock by using machine learning algorithm. Different algorithms have been used to forecast the direction of the stock prices and researchers have already got some achievements. In this paper, we propose a feedforward neural network model and use one year’s data to train it until the accuracy of prediction is more than 90%. Predicting stock prices will be concerned more in the future. And many algorithms will be adopted to improve the prediction accuracy. 1. Introduction With the continuous development of the electronic finance and stock market, there is a quantity of stock data. As the big data technology grows more popular, dealing with abundant data is becoming possible. Due to the quick fluctuations of stock prices, predicting the trends accurately is still a great challenge. One perspective, traders want to buy the stock whose price will raise in the future. On the other hand, traders can sell the stock whose price will go down in advance. Therefore, there is a strong need for accurately predicting the trends of stock price in the future. Machine learning has already been applied in forecasting stock market for a few years and is different from traditional predicting methods. In the early time, people usually treated the stock predicting as a regression problem instead of a classification problem, such as (1) Technical Analysis, (2) Time Series Forecasting. In current research, different algorithms have been proposed to predict stock market such as Support Vector Machine (SVM), Neural Network, Random Forest (RF), etc. In this paper, a kind of machine learning technique, Neural Network, will be discussed.
forest. Hafaezi et. al. [3] proposed a bat-neural network multiagent system (BNNMAS) for stock price forecasting and the results showed the accuracy reached more than 70%.
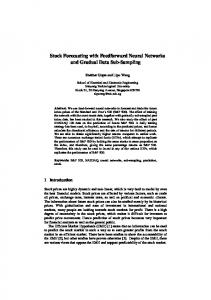
3. Architecture of the proposed model 3.1 Feed-forward neural network Feed-forward neural network is a kind of artificial neural network which is widely used and develops rapidly in the world. It’s a one-way multilayer structure as shown in Fig. 1 where the first layer is called the input layer, intermediate layer is called hidden layer and the last layer is named output layer. Each layer contains different neurons which are not connected with each other. Information only transfers along one direction from the previous layer to the next layer.
2. Related Work Many researchers have already tried to use the different predicting algorithms to forecast the trend of the stock price. Li et. al. [1] proposed a kind of SVM model that is efficient and used to make the classification and regression of the stock data and predict the next day’s price. The success rate of the prediction result was proved more than 70%. Khaidem et. al. [2] predicted the direction of the stock market prices using random
1018
Fig. 1. The model of Feed-forward neural network
2017년 한국소프트웨어종합학술대회 논문집
3.2 Parameter Setting for Feed-forward neural network We define the objective function like that :
cost( , b)
1 y ( x) a 2n
2
output value. If the stock price raises, then Y1 = 1, Y2 = 0, otherwise Y1 = 0, Y2 = 1. So we will have 20 inputs and 2 outputs in total.
(1)
Equation 1 shows the quadratic objective function where is weight, b is bias, n is the number of training sample, y(x) is output based on the model whose input is x and ‘a’ is the real value based on input x. The initial weight and bias value have a bigger difference with the real weight and bias value, which will make the learning speed become slow. Therefore, this study uses the Cross-Entropy function to raise the learning speed. Equation 2 shows the Cross-Entropy function.
cos t ( , b)
1 [ y ( x) ln a (1 y ( x)) ln(1 a)] (2) n
When the difference between value of bias and weight gets bigger, we will have a larger update value. Conversely, the smaller difference will take a less update which is good advantage of this function. Therefore, it has a faster speed than quadratic objective function. And also learning rate can be regarded as a gradient descent problem here. If we set up the learning rate too big, it may be difficult to find the convergence, or directly skip the extreme value point. If we set up the learning rate too small, we need to use much more time to find the convergence point. In the process of the neural network training, weight is a very important parameter. Too big weight will enlarge some characters. Too small weight will decrease the effect of the corresponding characters. Here we add regularization (Equation 3) to make the training procedure stable. L1: cost cos t
2 2n
(3)
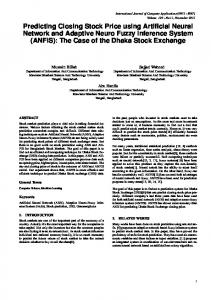
Fig. A. The prediction accuracy by using quadratic function.
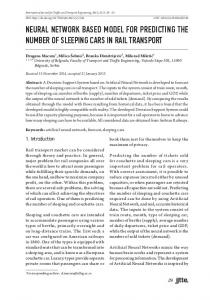
Fig. B. The prediction accuracy by using Cross-Entropy function.
4. Experiments There are many technical indicators in stock market, such as MACD, RSI, KDJ, OBV, CCI, SMA,WMA and so on. The stock indicators get different features through different equations. Therefore, indicators can know when the stock price will raise or when the stock price will go down. Ten stock indicators are used in this paper as features. We use the training data from 1 Jan, 2016 to 31 Dec, 2016 and test data from 1 Jan, 2017 to 1 June, 2017. For every feature we use two input variables: X1, X2. As for the KDJ, if the KDJ indicator shows that the stock price will raise then X1 = 1, X2 =0, else X1 = 0, X2 = 1. Therefore, on the basis of the ten indicators, 20 input are defined in this paper. Also, we use two variables (Y1,Y2) as
1019
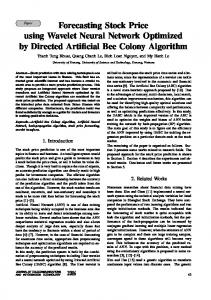
Fig. C. The prediction accuracy by using normalization term.
2017년 한국소프트웨어종합학술대회 논문집
References
Fig. D. The prediction accuracy by adding hidden layer.
In the experimental figures above, the red line represents the prediction accuracy of training data group. The blue line depicts the prediction accuracy of testing data group. Fig.A shows that before 50 epoch the training speed is slow. After approximately 70 epoch, the accuracy of prediction reaches more than 80%. A quadratic objective function is used in Fig.A. Fig.B shows that less than 20 epoch, the prediction accuracy of training data group has already reached more than 90%. But the testing data group still has some fluctuations. Cross-Entropy function is used to improve the speed of training. Fig.C shows that the prediction accuracy of training data group and testing data group has improved better. On the basis of model parameter in Fig.B, normalization term is added. Fig.D shows that there exists a little over-fitting performance. Because one hidden layers are added.
[1] Xintao, L., & Lee S.U.J., “Support Vector Machine fo r Predicting Stock Price Based on RBF Kernel,” Kore a Computer Conference, 856-858, 2017. [2] Khaidem, L., Saha, S., & Dey, S. R., “Predicting the direction of stock market prices using random forest,” arXiv preprint arXiv, 1605.00003, 2016. [3] Hafezi, R., Shahrabi, J., & Hadavandi,E., “A bat-neura l network multi-agent system(BNNMAS) for stock pric e prediction: Case study of DAX stock price,” Applied Soft Computing, 29, 196-210,2015. [4] Ticknor, J.L., “A Bayesian regularized artificial neural network for stock market forecasting,” Expert Systems with Applications, 40(14), 5501-5506, 2013. [5] Sands, T. M., Tayal, D., Morris, M. E., & Monteiro, S. T., “Robust stock value prediction using support ve ctor machines with particle swarm optimization,” In Ev olutionary Computation (CEC), 2015 IEEE Congress o n (pp. 3327-3331). IEEE, 2015. [6] Bisoi, R., & Dash, P. K., “A hybrid evolutionary dyna mic neural network for stock market trend analysis an d prediction using unscented Kalman filter,” Applied So ft Computing, 19, 41-56, 2014. [7] Fang, Y., Fataliyev, K., Wang, L., Fu, X., & Wang, Y., “Improving the genetic-algorithm-optimized wavelet n eural network for stock market prediction,” In Neural Networks (IJCNN), 2014 International Joint Conference on (pp. 3038-3042). IEEE. [8] Wang, J., & Wang, J., “Forecasting stock market inde xes using principle component analysis and stochastic time effective neural networks,” Neurocomputing, 156, 6 8-78, 2015.
5. Conclusions More and more people want to have achievement in this field. They tried different ways to predict and want to get a good performance. In this paper, we proposed the feed-forward neural network to forecast the stock price. The accuracy of prediction can reach more than 90% from this model. But stock market has so many uncertainties, from the view of neural network, we would like to use Recurrent Neural Network to improve it next time.
ACKNOWLEDGMENTS This work was supported by the National Research Foundation of Korea through the Korean Government (MSIP) under Grant NRF-2016R1C1B2008624.
1020