DEVELOPMENT OF A NEURO FUZZY MODELLING TOOL FOR A DECISION SUPPORT SYSTEM IN DESALINATION IN COASTAL ZONES. a
b
c
a
Marta Navarro Hernandez , Rafael Molina , Miguel Martin Monerris , Jose M. Hernandez Torres , Aina Hernández Mascarell
a
a Tecnoma S. A. C/ Antiga senda de Senent, 11-33º - 46023. Valencia, SPAIN. Ph.: +34+96 337 92 20. Fax: +34 96 337 14 29. e-mail:
[email protected] b Typsa. Gomera 9, San Sebastián de los Reyes – 28700. Madrid. SPAIN. Ph.: +34 91 722 73 00. Fax: +34 91 6517588. e-mail:
[email protected] c Departamento de Ingeniería Hidráulica y Medio Ambiente, Universidad Politécnica de Valencia. Camino de Vera, s/n. – 46022. Valencia, SPAIN. Ph.: +34 96 387 70 07. e-mail:
[email protected]
Abstract. The advances in models based on fuzzy neuronal logic networks in field of water quality in the last few years have been quite significant. This article develops a decision tool based on this methodology that allows the analysis of instant and seasonal behavior of brine discharge from desalination plants into the sea. This is to establish management measures to maximize discharge dilution and thereby reduce brine impact on the receiving medium. Over 70% of the increase in salinity of the affected area can be explained by just three significant variables: one associated to brine discharge, one associated to seasonality and one associated to climate conditions. Keywords. ASDECO, brine discharge, brine plumes, brine dispersion forecast system, support tool for decision making, desalination, neural network, fuzzy logic, dilution Introduction The placement of the brine generated in desalination processes by means of inverse osmosis is one of the main problems confronting the desalination industry. Brine discharge in coastal areas is an appropriate solution, but it must be carried out in an environmental way by complying with authorized regulations. In Spain, in the last few years, there has been a spectacular increase in the use of inverse osmosis in the desalination process of sea water. In most cases, environmental brine impact has been evaluated from contrasted models such as CORMIX, which is useful in the design phase but limited in the operation phase. Also, deterministic models do not yet have the necessary capacity to solve the complex problem of transport and brine diffusion in the marine environment. This slow development is partly caused by the lack of experimental data from the natural environment. One of the objectives of the ASDECO Project (Automated System for Desalination Dilution Control) is the evaluation of salinity variations in the marine environment over periods of time. This information can be used to improve the applicability of deterministic models, but until this is possible, it would to be used very convenient to have a mathematical tool that allowed this information to be used for predictive tasks in real time. An interesting possibility has become available with the current development and application of models that combine fuzzy inference systems and artificial neuronal networks in the water quality field. Even though mathematical models based on neural networks have been successfully used in fields such as hydrology and coastal engineering, it hasn’t been that successful in the water field. The main reason for this is that a great amount of information that is difficult to obtain is required. However, the benefits in environmental aspects have continued to increase. Currently, these models of this kind have been used to build a system to predict the water level in a reservoir [2], to predict the appearance of pesticides in wells with limited information [6] and also to mould nutrient loads in water masses [4].
In transport and brine dispersion, the physical processes of turbulent mix are predominant in chemical and biological ones; therefore, the application of models based on fuzzy logic can be viable provided if there is enough information. Objectives The main objective of this research, which is integrated in the ASDECO program, is to develop a computational requirements tool that, given the brine discharge levels and the environmental conditions, can predict salinity evolution in the marine environment. The data available comes from two sources: from historical registers for 2006 and 2007 gathered in the Environmental Vigilance Programs (PVA) and from the measuring instruments for salinity, currents, swells, winds, etc installed in one of the buoys of the ASDECO system. The buoy is located in the influence area of the brine discharge of Desalination Plants I and II of Alicante (Spain). The characteristics of the discharge as well as the ASDECO system have already been described in previous reports (Annual report 2008). Due to the wide availability of data and the current difficulty of using turbulent dispersion classic models, a computational tool based on neural and fuzzy systems has been developed as support to the alert system installed by ASDECO.
Description and implementation of models The tool used is based on Adaptative Neuro-Fuzzy Inference Systems (ANFIS), which is a neural fuzzy Sugeno-type model that is implemented by Matlab. It is an application that combines fuzzy logic with neural networks. In addition, the programming developed in modeling the continental water quality has been adapted [4]. There are two fundamental reasons for using this tool in the model. The parameters that can influence the dilution of a brine plume in the sea can be of very different types with a highly nonlinear relationship due to interaction with each other. Also, the transformation of parameter field data does not provide statistically significant results which would allow the use of other more traditional regression models. Before using this application, one of the first decisions to be taken is to define the objective function and the significant variables. The objective function is the increase of salinity in the area affected by the brine discharge. From other studies [1], it has been determined that base salinity in this area is 37.5 psu. These studies also state that the quality objective to fulfill in the area to protect is that the maximum increase can reach 1 psu for areas where there is Posidonia oceanica, and 2 psu in the case of Cymodocea nodosa. The significant variables are of two types: those associated to the brine discharge and those associated to environmental variables. The first refer to discharge flow and its excess salinity with respect to the base salinity. This is expressed in a combined form, which is known as excess salt load over the salinity in the sea. The second refer to swell, which is represented by significant height, wave period and direction.
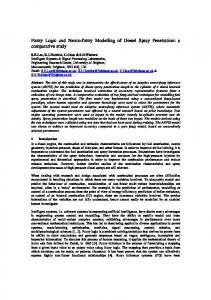
Results Model adjustment with data from the Vigilance Programme 2006. First, a series of preliminary tests were carried out using the historical registers of 2006 from the Environmental Vigilance Programs in the area affected by brine discharge. The purpose was to evaluate the possible viability of the parameters according to the results and then to make the decision to apply the model with the new data obtained by the ASDECO system. For 2004, there are different CTDs in the area of influence of brine discharge that register salinity in the perimeter of protection of Posidonia oceanica. Figure 1 shows the location of the sensors which, for different reasons, have moved over time, from positions A1-A6 to L1-L5. The data used in this section is related to station A3 of the PVA 2006, since it was verified that this station gathers the influence of the plume of brine discharge more directly than other stations.
Figure 1. Location of stations and distribution of Posidonia oceanica (Annual report 2006)
The first simulations were carried out using the input of excess salt load as one of the variables to represent the excess salinity with respect to the base salinity of the sea and the day of the year of the discharge as another one to represent seasonality. The first results are shown in Figure 2. Simulated vs Measured Station A3. Moving average (4 days) 40.50 2
R = 0.719
Measured salinity (PSU)
40.00
Period: Feb-Dic 2006 n: 359 measured dates
39.50 39.00 38.50 38.00 37.50 37.00 37.50
38.00
38.50
39.00
39.50
40.00
Simulated salinity (PSU)
Figure 2. Results for salt load for A3.
The increase of salinity measured in the area and the one simulated by means of neural networks is quite close with a regression coefficient R2 0,719. This shows that salt load is a key factor just as expected. Since the model has limitations due to the number of registers available, the experiments were limited to three variables. Based on these results, another parameter representing hydrodynamics in the area under study was added to the model. This variable, maximum wave height, was selected and the changes and the results in the model are shown in
Figure 3. As expected, there is an inverse relation between the salinity of the plume observed in the station A3 and the maximum wave height. This relation leads to a reduction of approximately 0.75 psu per meter of increase in the maximum wave height.
Maximum salinity (PSU)
40.5 40 39.5 39 38.5 38 37.5 0
0.5
1
1.5
2
2.5
3
Maximum wave height (m) Simulated salinity
Measured salinity
Figure 3. Results for salt load and swell for A3
Model adjustment with data from the Vigilance Progamme 2007. During 2007, the active CTDs are found in positions L1-L5 and have more data available for these sensors than in 2006. This is relevant because stations that are farther away from the discharge provide results that are closer to the actual measured results. This is true even though additional parameters are influencing the results of the model. Simulated vs Measured Station L3. Moving average (4 days)
H max vs PSU max L3 39
39.00 2
R = 0.778
38.8 Maximum salinity (PSU)
Period: Feb-Dic 2007 n: 2193 measured dates
Measured salinity (PSU)
38.50
38.00
38.6 38.4 38.2 38 37.8
37.50
37.6 37.4 0
37.00 37.00
37.50
38.00
38.50
39.00
0.5
1
1.5
2
2.5
3
Maximum wave height (m)
3.5
4
4.5
Simulated salinity
5
5.5
Simulated salinity (PSU)
39.00 38.80 38.60
Salinity (PSU)
38.40 38.20 38.00 37.80 37.60
2
R =0,778 37.40 37.20 37.00
Period: Feb-Dic 2007 n: 2193 measured dates
01/2007
01/2007
03/2007
04/2007
05/2007
05/2007
06/2007
07/2007
08/2007
09/2007
10/2007
11/2007
12/2007
Date Simulated
Measured
Simulated moving average (4 days)
Measured moving average (4 days)
Figure 4. Results for salt load and swell for L3.
6
Measured salinity
Simulated vs Measured Station L4. Moving average (4 days)
H max vs PSU max L4 39
39.00 2
R = 0.862
38.8
Period: Feb-Dic 2007 n: 2241 measured dates
Maximum salinity (PSU)
38.6
Measured salinity (PSU)
38.50
38.00
37.50
38.4 38.2 38 37.8 37.6 37.4 37.2
37.00 37.00
37.50
38.00
38.50
37
39.00
0
0.5
Simulated salinity (PSU)
1
1.5
2
2.5
3
Maximum wave height (m)
3.5
4
4.5
Simulated salinity
5
5.5
6
Measured salinity
39.00 38.80 38.60
Salinity (PSU)
38.40 38.20 38.00 37.80 37.60 37.40 37.20 37.00
2
R =0,862 Period: Feb-Dic 2007 n: 2241 measured dates
01/2007
02/2007
03/2007
04/2007
05/2007
06/2007
07/2007
08/2007
09/2007
10/2007
11/2007
12/2007
Date Simulated
Measured
Simulated moving average (4 days)
Measured moving average (4 days)
Figure 5. Results for salt load and swell for L4
Model adjustment with ASDECO data 2008-2009. The data provided by the sensors installed in the SADO I buoy by the ASDECO control, follow-up and alarm prototype started to be available in October 2008. The data became more uniform in February 2009. The increase of salinity produced in the control point where the buoy was located (according to excess salt lead and maximum wave heigh) is currently being studied. Also, the introduction of new parameters has been attempted in order to achieve better results from the model and the standardization of other parameters. Other variables besides maximum wave height have been introduced to define the specific behaviors of the brine plume: the significant wave height, the wave period, the intensity of the wind up to 10 m of height, the direction of the wind up to 10 m height and the direction of the swell. Finally, it is necessary to introduce a parameter that represents previous sea states since the salinity accumulated in the seabed on a specific day is not just a consequence of the climate conditions of that day, but of an accumulation of previous sea states. Thus, the longer the period calm, the lower the energy of dispersion accumulated. This results in a lower mix and a lower dilution of the plume. In contrast, extended storm periods will cause great turbulence, thus favoring the mix
Conclusions A decision tool has been presented in this work that allows the analysis of instantaneous and seasonal brine discharge behavior. A fuzzy logic application that is combined with neural networks has been developed and applied to the environmental management of desalination
plants to predict increase of salinity in the perimeters of the Posidonia oceanica to be protected. With this application, measures can be taken to maximize brine discharge dilution and, thereby reduce its impact on the marine environment. Research has proven that the most influential environmental variables in salt concentration are the wave height (within the climate scenario), brine discharge, the increase of salinity with respect to base salinity of the receiving medium, and the dilution relations. These results show that the model predictions are fulfilled. The increase of salinity is higher when the parameter that represents the excess salt load is higher. The increase of salinity is lower when the maximum wave height is higher. It is worth mentioning that the maximum wave height does not explain the average dispersion condition of the plume in the sea nor the decrease peaks of specific salinity. For prolonged periods of calm, the increase of salinity with respect to the base salinity is high, while for large wave heights the plume undergoes more dispersion. These results demonstrate that the application of neural fuzzy types such as ANFIS can be an acceptable option for the follow-up and control of brine discharge into the sea. This is true at least until the deterministic models finally correctly represent the turbulent dispersion processes in transport and brines dispersion in real time.
References [1] BOE. Boletín Oficial del Estado, 26 de Marzo 2007 (núm. 073). Resolución de 5 de marzo de 2007, de la Secretaría General para la Prevención de la Contaminación y el Cambio Climático, por la que se formula declaración de impacto ambiental del proyecto «Desalación y obras complementarias para la Marina Baja (Alicante)». [2] Chang, F., Chang, Y. 2006. Adaptive neuro-fuzzy inference system for prediction of water level in reservoir. Advances in Water Resources, 29 (1-10). [3] Chau, K.W., Wu, C.L., Li, Y.S., 2005. Comparison of several flood forecasting models in Yangtze river. Journal of Hydrologic Engineering 10, (485-491). [4] Marcé, R., Comerma, M., García, J.C., Armengol, J. 2004. A neuro-fuzzy modeling tool to estimate fluvial nutrient loads in watersheds under time-varying human impact. Limnology and Oceanography: Methods 2, (342–355) [5] Programas de Vigilancia Ambiental de la desaladora de Alicante. Años 2004, 2005, 2006 y 2007. Departamento de Ciencias del Mar y Biología aplicada. Universidad de Alicante. [6] Sahoo, G.B., Ray, C., Wade, H.F. 2005. Pesticide prediction in ground water in North California domestic wells using artificial neural works. Ecological Modelling, 183 (29-46)