Journal of Chromatographic Science, Vol. 42, August 2004
Development of a Reversed-Phase Thin-Layer Chromatographic Method for Artemisinin and Its Derivatives M. Gabriëls and J. Plaizier-Vercammen* Vrije Universiteit Brussel, Pharmaceutical Institute, Pharmaceutical Technology and Physical Pharmacy, Laarbeeklaan 103, 1090 Brussels, Belgium
Abstract In this study a clear separation between seven analogues of artemisinin on thin-layer chromatography (TLC) is presented. The developed TLC method is carried out on a RP-C18 thin-layer plate using acetonitrile–water (50:25 v/v) as the mobile phase. Spots are visualized by derivatization with an acidified 4-methoxybenzaldehyde reagent in methanol–water. This method allows the separation of a diverse group of compounds that have versatile hydrophilic/lipophilic characteristics; namely artemisinin, artesunate (AS), artelinic acid (AL), arteether (AE), both isomers of artemether (AM) (α and β), dihydroartemisinin, and desoxyartemisinin. Separation of some degradation products and impurities, down to 2%, allows quality control and stability investigation of all actives in raw material and pharmaceutical formulations. The method is further developed via densitometric measurement for quantitative determination purposes for AL and AS. The derivatization technique is evaluated, showing good stability and reproducibility of the coloring process. Percent relative standard deviation values are less than 5% for replicates, and linearity is obtained in the range of 0.5 to 8 µg. A comparative study with high-performance liquid chromatography (HPLC) on a C18 column, applying the same mobile phase, proves the suitability of the TLC method, in which almost all presented analytes are separated from each other. In contrast, HPLC requires at least a 20-min analysis to chromatograph all of the compounds and only βAM and AE are clearly separated from each other and from the other compounds.
drug for a number of semisynthetic derivatives with different solubility characteristics and, subsequently, a more-or-less-specific clinical profile. Several studies suggest that the endoperoxide function is important for the antimalarial activity because of the production of free radicals (1–4). Reduction of the endoperoxide function of AT to an epoxide yields desoxyartemisinin (DAT), which is devoid of any antimalarial activity (5). From the intermediate reduction product, dihydroartemisinin (DHA), being even the most common active metabolite of all AT derivatives in vivo (6), other even or more potent drugs were synthesized such as artesunate (AS), arteether (AE), artemether (AM), and artelinic acid (AL) (Figure 1) (7). The world-wide claimed efficacy of these drugs, supported by clinical studies (8), has led to the development of several pharmaceutical formulations (tablets, intramuscularly injections, and suppositories) (7,9–11). For the purpose of adequate pharmaceutical development of these AT analogues, stringent information
Introduction Artemisinin (AT), a natural antimalarial compound, is a sesquiterpene molecule, isolated from the plant Artemisia annua L. Its structure contains a lactone function and a ring overstrained with an endoperoxide bridge. AT is the parent natural * Author to whom correspondence should be addressed: email
[email protected] or
[email protected].
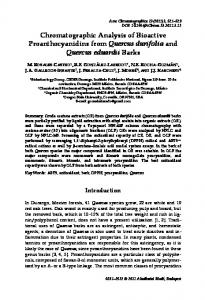
Figure 1. Structure of AT and its semisynthetic derivatives (AS, AE, AM, AL, DHA, and DAT).
Reproduction (photocopying) of editorial content of this journal is prohibited without publisher’s permission.
341
Journal of Chromatographic Science, Vol. 42, August 2004
should be acquired about some crucial parameters such as the stability in different formulations and storing conditions. Only some studies mention the instability of AT at temperatures higher than 150°C and in acidic solutions (5). AS is known to be instable in aqueous solutions (12); therefore, injections of this drug need to be reconstituted just before administration. Several high-performance liquid chromatographic (HPLC) or gas chromatographic (GC) methods have been published but describe only the resolution of two or three AT derivatives (13–21). Some analytical methods were already proposed in the literature, but because of the inert nature of the molecules, rather highly specific and uncommon techniques are needed, such as GC–mass spectrometry (MS)–selected ion monitoring (13), UVderivatization (1), chemiluminescence (15), electrochemical detection (15–20), light scattering (21). Many of them require intensive sample preparation or highly technical experience and are not always suitable for a great number of samples and routine analysis, as needed for stability studies. The first purpose of this work is to develop an analytical technique allowing the separation of AT derivatives as much as possible, as well as degradation products. A second purpose is to visualize these compounds as easily as possible. In this work a simple technique, compared with the existing analytical methods, is presented that allows the following: separation of at least seven derivatives of AT (the hydrophilic ones, AS and AL) and the more lipophilic ones (AM, AE, DHA, and DAT) (Figure 1). The last two are also known as degradation products or metabolites of these derivatives (or both). Therefore a reversedphase thin-layer chromatography (TLC) technique has been presented using a derivatization technique for visualization of all of these derivatives with the same derivatization solution and densitometric method. Such a technique allows for the identification and quantitation of AT and its derivatives in various samples, for which quite simple sample preparation methods can be used.
Experimental Analytes, solutions, and reagents
The test substances [AT, AS, AL, α-artemether (αAM), and DHA] were kindly supplied by the respective organizations: Arenco (Geel, Belgium), HelmAG (Hamburg, Germany), ACF-beheer (Maarssen, the Netherlands), and Arenco Pharmaceutica (Geel, Belgium). β-Artemether (βAM), AE, and DAT were generous gifts from the University of Mississippi (University, MS). As well as for qualitative and quantitative purposes, solutions were prepared ranging from 0.1 to 1 mg/mL analyte. They were then spotted on the TLC plate as individual bands, and the plate was developed maintaining the chromatographic conditions mentioned later. For qualitative evaluation on the TLC system, the Rf values were determined; for quantitative purposes, densitometric measurements on the spots were performed, for which al details are listed below. The TLC mobile phases consisted of acetonitrile of HPLC grade from Carlo Erba Reagenti (Milano, Italy), methanol of HPLC grade or chloroform (Merck, Darmstadt, Germany) and MilliQ water. The same solvents were used in the HPLC analysis. The dipping reagent to visualize the spots in the TLC method consists of
342
2 mL of 4-methoxybenzaldehyde, 4 mL of sulfuric acid 95–97% (v/v), and 20 mL of acetic acid 98% (v/v) dissolved in 94% alcohol (v/v)–water (100:80 v/v). Except for the solvents, all reagents were obtained from Merck. For the creation of degradation products, analytical-grade HCl 32% (g/g) from Merck was used. To compare the separation efficiency under the same conditions with the TLC or HPLC technique [C18 column or thin-layer plate as stationary phase and acetonitrile–water (in a ratio of 2:1 v/v) as mobile phase], solutions of each analyte were prepared in HPLC-grade methanol with a concentration of approximately 1 mg/mL. Instruments and methods
Acidic degradation The procedure for the acidic degradation of each of the analytes was as follows: 1N HCl prepared in water was added to a certain amount of the test substances, namely 10 mg AS was dissolved in 5 mL HCl 1N and 45 mL water and 50 µL was spotted; 10 mg AL was dissolved in 10 mL HCl 1N and 90 mL water was added; 100 µL was spotted; 25 mg of AT, AE, or AM were individually mixed with 1 ml HCl 1N and further diluted to 100 mL with ethanol 94% v/v; and 20 µL of these solutions were spotted. In order to induce degradation, the solutions were stored overnight at 45°C before applying on the plate. TLC conditions A Linomat IV device from Camag (Lot, Belgium) was used to apply the test solutions on the TLC plates. Appropriate aliquots were spotted under a continuous drying nitrogen stream in a 1-cm band at 2 cm from the bottom on the TLC plate. For quantitative analysis, 10-µL quantities of standard solutions and appropriate volumes of degraded solutions, depending on their degradation rate, were always applied on the plates. The development is performed on TLC layer interfaces (10 × 20 cm), respectively. RP-C18 F254S and TLC plates silica gel 60 F254, both having precoated layer thicknesses of 0.25 mm (Merck) in a developing chamber tank (Camag) were saturated with the appropriate eluent overnight at 25°C. For normal-phase chromatography, the mobile phases consisted of chloroform–methanol (70:0, 60:10, and 50:20 v/v). For reversed-phase chromatography, methanol–water (50:20 v/v) or acetonitrile–water (50:20 v/v) were used. For the derivatization, a dipping chamber (20 × 20 cm) and a plate heater from Camag were used. The exact activation time needed for a stable color was investigated. After development, the plates were air dried for 5 min and sample and standard zone areas were measured by linear scanning at 565 nm with a PMQ 3 Zeiss-TLC scanner (Oberkochen, Germany). The scanning was performed vertically over the plate over a distance of 5 cm and at a scanning rate of 5 cm/min, measuring 200 points. Densitograms were generated from transmission measurements of the samples and the blank. The respective absorbance values were calculated and peak areas were quantitated with aid of the Peakfit program from Jandel (Erkrath, Germany). Application of the TLC method in quality assurance of β AM raw material To test the applicability of the TLC method in quality assurance of βAM at a level of 2%, a stock solution of 160 mg/100 mL AM
Journal of Chromatographic Science, Vol. 42, August 2004
was foreseen. For the impurities, a solution that was diluted properly to obtain a concentration of 3.2 mg/100 mL was prepared. Lower concentrations were also tried. From each of the solutions, 10 µL was spotted on the thin-layer plate. The plate was developed and derivatized as discussed before. HPLC conditions A standard solution of each compound was prepared separately in methanol (containing 1 mg/mL analyte) and then qualitatively investigated with the following HPLC method: a Lichrocart RP C18 column (250 × 4 mm) filled with Lichrosphere 100 (5 µm) particles (Merck), a mobile phase consisting of acetonitrile (HPLC grade from Merck) and MQ-water in a ratio of 2:1 (v/v), a flow set at 1 mL/min at an injection volume of 2 µL. The HPLC apparatus consists of a binary LC pump 250, LC-235 diode array UV detector, LCI-100 laboratory computing integrator (Perkin Elmer, Norwalk, CT) and a Rheodyne 20-µL loop (Cotati, CA). The detector wavelength was 215 nm because none of the compounds had UV-detectable chromophore groups, except for AL.
when using a mobile phase with a methanol content equal or less than 10%. It is not practically advisable to perform TLC developments in “sensitive” eluents; just a small difference in the methanol content can change the separation efficiency of the investigated drug and its degradation products.
AS
βAM
AE
AT
AS
βAM
AE
AT
DHA
αAM
DAT
AL
αAM
DAT
AL
Results and Discussion The choice for the development of a TLC as a preferred and simple method for the discrimination of related AT compounds was inspired mainly by the fact that the overall chemical structure of all these compounds lacked the presence of a chromophore function. For our purpose, a densitometric measurement after color derivatization was coupled to the separation capacity of TLC.
DHA
Qualitative TLC separations
Both normal- and reversed-phase TLC systems were investigated. On the basis of previous observations in our lab, mobile phases consisting of 100% chloroform could discriminate AT and its lipophylic derivatives (AT and AM). However, nearly no migration was observed for the hydrophilic compounds AS and DHA (Figure 2C). Addition of different amounts of methanol to chloroform could improve the separation of the hydrophilic compounds as shown in Figures 2A and 2B. It could be observed that the substitution of 25 mL of chloroform (Figure 2C) by methanol influences the migration strongly; AT, AE, and AM migrated with the solvent front. At the same time, the separation of AS, AL, and DHA was improved (Figure 2B), and with higher amount of methanol at least six products were separated. It could be concluded that in the conditions of the normalphase TLC on a silica gel stationary phase, mobile phases consisting of mixtures of chloroform–methanol can only discriminate the lipophilic and hydrophilic compounds into two groups, an all-over separation of all derivatives is not evident. On the other hand, most of undefined degradation products of AS and AL obtained in hydrochloric acidic solutions were separated using a chloroform–methanol (60:10 v/v) mobile phase. For each drug, at least seven bands could be observed (Table I). As most of the degradation products exhibit Rf values greater than 0.5, the separation of these substances should be improved
Figure 2. Thin-layer chromatogram of AT and five analogues using a silica gel stationary phase and chloroform–methanol (50:25 v/v) (A), chloroform– methanol (60:10 v/v) (B), and chloroform (70 mL) (C) as mobile phase (spots from left to right: AS, βAM, βAE, AT, DHA, αAM, DAT, and AL).
Table I. Rf Values of AS and AL and Their Degradation Products on Silica Gel Plates Developed in a Mobile Phase of Chloroform–Methanol (60:10 v/v) AS
AL
0.26 pink 0.43 pink 0.60 blue AS standard: 0.64 grey 0.70 pink 0.77 grey 0.84 blue 0.94 grey 1.00 grey
0.24 pink 0.43 pink 0.57 pink 0.64 blue AL standard: 0.71 grey 0.84 blue 0.91 grey 0.97 pink 1.00 grey–pink
343
Journal of Chromatographic Science, Vol. 42, August 2004
Because of the limitations encountered with normal-phase systems, our analytes were investigated on RP-C18 thin layer plates. In earlier studies on tretinoin (22), better migration and finer bands for reversed-phase systems were already noticed than on normal-phase plates. Two types of mobile phases were compared, one based on methanol, the other based on acetonitrile, each with the same ratio of water (50:25 v/v). In comparison with normal-phase systems, much better results were obtained with reversed-phase systems, as can be observed from Figure 3. For all analytes, several degraded products obtained in acidic medium (Figure 3) could be separated from the parent compound as well as in the eluent containing acetonitrile, as in the one composed of methanol–water. But the highest number of spots and separation efficiency were achieved with the first one, composed of acetonitrile–water (50:25 v/v).
Observing these positive results, a good TLC technique, from the qualitative point of view, seemed to be developed. Only a simple RP-C18 plate developed in a mobile phase containing acetonitrile–water (50:25 v/v) is required for an almost total separation of AT and the investigated derivatives (AE, AM, AS, AL, DHA, and DAT) (Figure 4). Typical quality control of the semisynthetic derivatives included investigation of AT and DHA impurities after synthesis. For each compound, the method can be applied for that purpose. Especially for AM, both isomers (α and β) were well separated. This method is certainly interesting as identification step in the quality control of each compound. Quantitative determination of AT and structured analogues using visual scanning densitometry
It was already demonstrated in previous work in our lab that 4-methoxybenzaldehyde is a suitable derivatization reagent to visualize AT, AE, and AM for quantitative determination in solutions (23) and even for tretinoin and erythromycin (22). From
ASs
ASd
ALs
ALd
ATs
ATd
AEs
AEd
AMs
AMd
Figure 3. Thin-layer chromatogram of in HCl degraded AS, AL, AM, AE, and AM, using a RP-C18 stationary phase and methanol–water (50:25 v/v) (A) and acetonitrile–water (50:25 v/v) (B) as mobile phases (s = standard solution; d = solution of the analyte, degraded with HCl).
AS
βAM
AE
AT
DHA
αAM
DAT
AL
Mixture
Figure 5. Evaluation of the densitometric peak area of AS and AL after 8, 10, and 12 min of activation at 110°C as a function of time.
Table II. Precision on the Peak Areas for the Investigated Drugs in the RP Systems Using the C18 Thin-Layer Plate
AS
βAM
AE
AT
DHA
αAM
DAT
AL
Mixture
Figure 4. Thin-layer chromatogram of AM and seven related compounds using an RP-C18 stationary phase and methanol–water (50:25 v/v) (A) and acetonitrile–water (50:25 v/v) (B) as mobile phases (spots from left to right: AS, βAM, βAE, AT, DHA, αAM, DAT, and a mixture of all compounds).
344
%RSD (n = 6)
Regression equation (y = mx + b)
Linear interval
Sample Scan
spot
(µg)
m
b
r
AS AL
3.0 4.5
0.5-8 0.5-8
63.8 53.5
0.27 0.28
0.992 0.995
3.2 5.0
Journal of Chromatographic Science, Vol. 42, August 2004
these experiences, the possibility for quantitative determination of all AT derivatives was further evaluated using a methoxyben-
zaldehyde dipping reagent. The application of the dipping technique to achieve a higher reproducibility quota was in accordance with the review of Touchstone (24). The stability of the colored TLC bands, translated to densitometric area, was evaluated as a function of time elapsed after 8, 10, and 12 min of activation at 110°C. From previous studies on tretinoin and erythromycin, 8 min seemed suitable for qualitative evaluation. An activation period of at least 12 min was necessary for quantitative determination (22). In our study, a minimum of 12-min activation period was also required to have stable spots that were measurable at 565 nm. The color reached a stable condition after 20 min of cooling at room temperature and remained stable during 3 h (Figure 5). Under these standardized conditions of development and derivatization, the TLC visual scanning densitometry was quantitatively evaluated (Table II). The calibration curves produced on βAM αAM mixture AT DHA each plate by linear regression of several standards (scan area count vs. micrograms spotted) had correlation coefficient values Figure 6. Thin-layer chromatogram of the impurities AT, DHA, and αAM at a of at least 0.99 and were similar to each other. In all cases, percent level of 2% (g/g) in βAM raw material, using an RP-C18 stationary phase and relative standard deviation, measured at two levels (one spot meaacetonitrile–water (50:25 v/v) as mobile phase. sured several times and several spots once), was lower than 5%. The linearity intervals of the visual responses had adequate precision at least in the range of 0.5–8 Table III. Data of Peaks on HPLC and Spots on TLC and Resolution Results µg and were similar for AS and AL. for the TLC and HPLC Method for Nine Analytes Applicability of the TLC test in the quality assurance of AM raw material
Data on HPLC-peaks and TLC-spots Analytes
HPLC
Abbreviation Artesunate Dihydroartemisinin I Dihydroartemisinin II Artelinic acid Artemisinin Desoxyartemisinin α-Artemether β-Artemether Arteether
TLC
Retention time (min)
Width at 1⁄2 height (cm)
Width at 1⁄2 height (min)
Width of the spot (mm)*
Distance to spot line (mm)*
4.35 4.56 5.97 5.5 6.65 8.66 8.74 12.62 18.38
0.3 0.1 0.1 0.9 0.15 0.25 0.15 0.15 0.25
0.50 0.20 0.20 1.51 0.25 0.42 0.25 0.25 0.42
30 80 80 25 40 30 35 30 25
54.5 49.5 49.5 40.0 44.0 37.0 38.0 32.5 34.0
AS DHA-I DHA-II AL AT DAT αAM βAM AE
Resolution Rs for TLC AS AS DHA I DHA II AL AT DAT αAM βAM AE
0.35 2.73 0.67 3.60 5.52 6.87 12.94 17.96 AS
DHA-I
DHA-II
AL
AT
DAT
αAM
βAM
AE
0.09
0.09 –
0.53 0.18 0.18
0.30 0.09 0.09 0.12
0.58 0.23 0.23 0.11 0.20
0.51 0.20 0.20 0.07 0.16 0.03
0.73 0.31 0.31 0.27 0.33 0.15 0.17
0.75 0.30 0.62 0.18 0.36 0.10 0.15 0.06
4.22 0.65 5.50 7.85 11.00 21.21 26.47 DHA-I
0.33 1.79 5.15 7.29 17.50 23.77 DHA-II
0.77 1.93 2.17 4.78 7.89 AL
3.54 4.91 14.01 20.65 AT
0.14 6.97 13.69 DAT
9.11 16.97 αAM
Resolution Rs for HPLC * Measured on spots of 1 cm – migration distance of 7 cm.
10.14 βAM
AE
The specification test for the active ingredient in a pharmaceutical formulation should confirm the identity and purity at a certain level. The detection limit of related substances, mostly impurities originating from the synthesis of βAM, was therefore evaluated. In the following test, the TLC method was evaluated to detect these impurities at a level of 2%. Therefore,a high concentrated solution, to which the different impurities were added, was chromatographed. As can be observed in Figure 6, each impurity can be clearly distinguished from the main compound (βAM) at a level of 2%. At this level, three clearly separated spots of the measured impurities were observed, possibly allowing quantitative determination via densitometry. Comparative study of the TLC and HPLC analysis of AT and derivatives
Although nowadays TLC can be applied as an analytical method alongside other chromatographic techniques (25,26), including HPLC, the technique is still not generally accepted as a valuable method for quantitative analysis in different domains. However, because of recent developments in accessories for TLC analysis and new “high-performance” thin-layer plates, the technique rivals HPLC in terms of chromatographic efficiency, sensitivity, and precision. A comparative study with HPLC using a C18 column (4 µm × 25 cm) and the same mobile phase [acetoni-
345
Journal of Chromatographic Science, Vol. 42, August 2004
trile–water (2:1 v/v)] with a flow of 1 mL/min was performed. The aim of this part of this study was to compare the TLC and HPLC methods for their system suitability in the quality control of AT derivatives and their degradation products. To determine the quality of the HPLC system, the method of Molnár (27) was followed. For each of the two peaks, the resolution (Rs) was determined. For TLC, the resolution value was calculated based on the formula mentioned in the study of Fried and Sherma (28). The following formulas were applied in the calculation of the resolution Rs . For HPLC: t –t RS = 1.178 × 2 1 Eq. 1 Wh1 + Wh2 and for TLC: d RS = (W1 + W2)/2
Eq. 2
where t1 and t2 are the retention times, Wh1 and Wh2 are the peak widths at half height, d is the distance between the center of two spots, and W is the widths of the spots Results of the comparative study are presented in Table III and Figure 7. Table III gives data on the peaks in HPLC, namely retention time and peak width information, as the peak width at half height; for the spots on TLC, the spot width and distance from the spot line to the migrated spot are presented. Based on this data, the resolution, being a system suitability value for the separation between each AT in the derivative, can be calculated for HPLC and TLC. Figure 7 (for HPLC) and previous figures for TLC (Figures 3 and 4) represent, respectively, the HPLC chromatogram and the TLC plates. Based on the criteria of Molnár (27)—a good resolution between two compounds is obtained because the Rs value is greater than 1.5—we could conclude the following for the HPLC method: if the Rs is lower than 1.5, the HPLC method seemed unsuitable for the separation of these compounds. For the following compounds, the resolution does not fulfill the criteria, namely DHA-I and AS (Rs = 0.35); AL, DHA-I, and DHA-I, respectively (Rs = 0.35 and 0.33); AT and AL (Rs = 0.77); and DAT and αAM (Rs = 0.14). Practically, the HPLC method is not completely satisfactory for the identification of all compounds. Six compounds (e.g., AS or
DHA-I, AT, βAM or DAT, αAM, and AE) can be easily separated. For the investigation of degradation products or metabolites (DHA) of the compounds AT, AM, and AE, the method seemed to be suitable. Additionally, αAM, the isomer of βAM, was well separated. The requirement to obtain system suitability in TLC is an Rs of greater than 0.05. Therefore, the method is not satisfactory for αΑΜ and DAT. The same phenomenon was observed with HPLC. In contrast with HPLC, TLC does not separate the two isomers present in the product DHA (α and β forms). With HPLC, an Rs of 4.22 between both isomers was obtained. Nevertheless, the method is satisfactory for the separation of all other compounds from each other. Moreover, the described TLC method provides excellent capability for dosage and stability investigation of the main compounds, their impurities and degradation products, and as pure material or incorporated in several pharmaceutical dosage forms. This method can be of a great value in the semiquantitive analysis of the compounds because the derivatization allows for the visual determination of the spots.
Conclusion In this work, a simple TLC technique using visual scanning densitometry after derivatization has been presented. This method, the separation of all of the presented drugs with a sufficient separation efficiency, contributes to the identification of AT and its hydrophilic derivatives (namely AS and AL) and the lipophilic ones (AM and AE). Even more, the method allows the separation of the following two degradation products, which are simultaneously metabolites of most of these derivatives (namely DAT and DHA). All semisynthetic derivatives are well separated from AT and DHA, with both compounds possibly being present as impurities originating from the synthesis. Additionally, most of the analytes can be quantitated in a stability investigation because they are separated from many degradation products. For βAM it was shown that its impurities (AT, DHA, and αAM) at a level of 2% could be detected. It should be noted that neither qualitative analysis nor quantitative determination of such a high number of structurally related drugs from the artemisia group, using one simple TLC or any other technique, has been reported in literature as far as the authors of this work know. Some preliminary tests on suppositories with AS and AM allow us to suggest that this method will be of merit in the investigation of the stability of pharmaceutical preparations of these drugs without intensive sample pretreatment. Based on the resolution results of the presented HPLC method and the evaluated TLC method, the latter seems to be superior for investigation in different domains of pharmaceutical technology, including identification, dosage determination, and stability investigation.
Acknowledgments Figure 7. Chromatograms of AM and its derivatives, analyzed with HPLC [stationary phase = Lichrocart C18 column and mobile phase = acetonitrile–water (2:1 v/v) at 1-mL flow].
346
We wish to thank Mr. McChesny from The University of Mississippi for kindly providing the sample of DAT.
Journal of Chromatographic Science, Vol. 42, August 2004
References 1. S.R. Meshnick, Y.-Z.Yang, V. Lima, F. Kuypers, S. Kamchonwongpaison, and Y. Yuthavong. Iron-dependent free radical generation and the antimalarial artemisinin (qinghaosu). Antimicrob. Agents Chemother. 37: 1108–14 (1993). 2. A.C. Beeckman, P.K. Wierenga, H.J. Woerdenbag, W. Van Uden, N. Pras, A.W.T. Konings, F.S. El-Feraly, A.M. Galal, and V. Wilkström. Artemisinin-derived sesquiterpene lactones as potential antitumour compounds: cytotoxic action against bone marrow and tumour cells. Planta Medica 64: 615–19 (1998). 3. D.L. Klayman. Qinghaosu (artemisinin): an antimalarial drug from China. Science 228(4703): 1049–55 (1985). 4. W. Asawamahasakda, I. Ittarat, P. Yu-Ming, H. Ziffer, and S.R. Meshnick. Reaction of antimalarial endoperoxides with specific parasite proteins. Antimicrob. Agents Chemother. 38(8): 1854–58 (1994). 5. H.K. Webster and E.K. Lehnert. Chemistry of artemisinin: an overview. Trans. R Soc. Trop. Med. Hyg. 88(suppl 1): S27–29 (1994). 6. H.J. Woerdenbag, N. Pras, W. van Uden, T. E. Wallaart, A.C. Beekman, and C.B. Lught. Progress in the research of artemisinin related antimalarials: un update. Pharm. World & Sci. 16(4): 169–80 (1994). 7. P.J. de Vries and T. Dien. Clinical pharmacology and therapeutic potential of artemisinin and its derivatives in the treatment of malaria. Drugs 52(6): 818–36 (1996). 8. V. Dhingra, K.V. Rao, and M.L. Narasu. Minireview: Current status of artemisinin and its derivatives as antimalarial drugs. Life Sci. 66(4): 279–300 (2000). 9. F. Nosten and R.N. Price. New antimalarials: a risk-benefit analysis. Drugs 12(4): 264–73 (1995). 10. S. Looareesuwan, P. Wilairatana, W. Molunto, K. Chalermrut, P. Olliaro, and M. Andrial. A comparative clinical trial of sequential treatments of severe malaria with artesunate suppository followed by mefloquine in Thailand. Am. J. Trop. Med. Hyg. 57(3): 348–53 (1997). 11. K. Na-Bangchang, J. Karbwang, K. Congpoung, A. Thanavibul, and R. Ubalee. Pharmacokinetic and bioequivalence evaluation of two generic formulations of oral artesunate. Eur. J. Clin. Pharmacol. 53: 375–76 (1998). 12. K.T. Batty, K.F. Ilett, T. Davis, and M. E. Davis. Chemical stability of artesunate injection and proposal for its administration by intravenous infusion. J. Pharm. Pharmacol. 48: 22–26 (1996). 13. S.S. Mohamed, S.A. Khalid, S.A. Ward, T.S. Wan, H.P. Tang, M. Zheng, R.K. Haynes, and G. Edwards. Simultaneous determination of artemether and its major metabolite dihydroartemisinin in plasma by gas chromatography-mass spectrometry-selected ion monitoring. J. Chromatogr. B Biomed. Sci. Appl. 731(2): 251–60 (1999). 14. P.O. Edlund, D. Westerlund, J. Carlqvist, B.L. Wu, and Y.H. Jin. Determination of artesunate and dihydroartemisinin in plasma by liquid chromatography with post-column derivatization and UVdetection. Acta Pharm. Suec. 21(4): 223–34 (1984). 15. M.D. Green, D.L. Mount, G.D. Todd, and A.C. Capomacchia.
16.
17.
18.
19.
20.
21.
22.
23.
24. 25. 26.
27.
28.
Chemiluminescent detection of artemisinin. Novel endoperoxide analysis using luminol without hydrogen peroxide. J. Chromatogr. A 695: 237–42 (1995). J. Karbwang, K. Na-Bangchang, P. Molunto, V. Banmairuroi, and K. Congpuong. Determination of artemether and its major metabolite, dihydroartemisinin, in plasma using high-performance liquid chromatography with electrochemical detection. J. Chromatogr. B 690: 259–65 (1997). V. Navaratman, S.M. Mansor, L.K. Chin, M.N. Mordi, M. Asokan, and N.K. Nair. Determination of artemether and dihydroartemisinin in blood plasma by high-performance liquid chromatography for application in clinical pharmacological studies. J. Chromatogr. B 669: 289–94 (1995). V. Navaratman, M.N. Mordi, and S.M. Mansor. Simultaneous determination of artesunic acid and dihydroartemisinin in blood plasma by high-performance liquid chromatography for application in clinical pharmacological studies. J. Chromatogr. B 692: 157–62 (1997). N. Sandrenan, A. Siouffi, J. Godbillon, C. Netter, M. Donker, and C. van Valkenburg. Determination of artemether and its metabolite, dihydroartemisinin, in plasma using high-performance liquid chromatography and electrochemical detection in the reductive mode. J. Chromatogr. B 690: 259–65 (1997). K. Na-Bangchang, K. Congpuong, L.N. Hung, P. Molunto, and J. Karbwang. Simple high-performance liquid chromatographic method for the simultaneous determination of artesunate and dihydroartemisinin in biological fluids. J. Chromatogr. B 708: 201–207 (1998) B.A. Avery, K.K. Ventakesh, and A. Mitchell. Rapid determination of artemisinin and related analogues using high-performance liquid chromatography and an evaporative light scattering detector. J. Chromatogr. B 730: 71–80 (1999). M. Gabriëls, M. Brisaert, and J. Plaizier-Vercammen. Densitometric thin layer chromatographic analysis of tretinoin and erythromycin in lotions for topical use in acne treatment. Eur. J. Pharm. Biopharm. 48: 53–58 (1999). M. Gabriëls and J. Plaizier-Vercammen. Densitometric thin-layer chromatographic determination of artemisinin and its lipophilic derivatives, artemether and arteether. J. Chromatogr. Sci. 41: 359–66 (2003). J. Touchstone. Practice of Thin Layer Chromatography, 3rd ed. John Wiley & Sons, New York, NY, 1992. C. Weins and H.E. Hauck. Advances and developments in thin layer chromatography. LC-GC International 9: 710–17 (1996) Q.S. Wang, L. Zhang, H.Z. Yang, and H.Y. Liu. Lipophilicity determination of some potential photosystem II inhibitors on reversedphase high-performance thin-layer chromatography. J. Chromatogr. Sci. 37: 41–44 (1999). I. Molnár. Validation of robust chromatography methods using computer-assisted method development for quality control. LC-GC International 9: 800–806 (1996). B. Fried and J. Sherma. Thin Layer Chromatography: Techniques and Applications, 1st ed. Marcel Dekker, New York, NY, 1996. Manuscript accepted June 10, 2004.
347