Development of a Semi-Automated Testing and Calibration System for Custom-Built TPC DAQ Hardware Brycen L. Wendt, Eric A. Burgett Department of Nuclear Engineering, Idaho State University, Pocatello, ID, 83209
[email protected],
[email protected] INTRODUCTION Many aspects of nuclear science are dependent on isotopic cross sections and particle kinematics information. Examples include reactor simulations and nucelosynthesis calculations. Uncertainties in the data propagate through in calculated performance parameters. The impact of nuclear data uncertainties has been studied in detail, and sensitivity codes have subsequently been developed that provide nuclear data accuracy requirements based on adopted target accuracies for crucial design parameters. Sensitivity calculations have been performed for a number of candidate systems. These sensitivity studies provide specific requirements for uncertainties on many fission cross sections, many of which are beyond the reach of current experimental tools. The development of new technologies, or enhancement of existing technologies, must be furthered in order to satisfy these uncertainty requirements in nuclear data measurements. One proposed method is to employ a time projection chamber (TPC). TPC technology has been in use in high-energy physics for over two decades, thus it is a mature and well understood technology. However, it will have to be optimized for a task that includes miniaturization, hydrogen gas, and electronics with a large dynamic range. The TPC is the perfect tool for minimizing most of the systematic errors associated with fission measurements—controlled by performing the nuclear data measurements relative to H(n,n)H elastic scattering—specifically for delivering cross section measurements with uncertainties below 1.0%[1]. The Neutron Induced Fission Fragment Tracking Experiment (NIFFTE) collaboration has designed such a TPC for this purpose. Although designed around fission cross section measurements, the TPC can be adapted to perform a multitude of ionizing-event measurements. The final TPC design is a 4π detector that contains 5952 channels. The signals are amplified by custom 32-channel preamp cards, then digitized and transmitted to a recording computer by an EtherDAQ card. Each EtherDAQ card is permanently paired with a preamp card. The EtherDAQ/Preamp (EDAQ/PA) pairing ensures that valid calibration measurements are maintained, especially between different TPC configurations. Each TPC contains the equivalent of 186 EDAQ/PA pairs[2]. A very high level of rigor is essential since the desired measurement uncertainty is so small. Each EDAQ/PA pair must be individually tested to ensure it meets the necessary quality requirements. Criteria for rejection include noisy or dead channels, significant crosstalk (i.e. greater than 0.25%), and nonlinear response. Additionally, minor variations naturally exist in the electronic components between each channel. Thus, each channel must be individually calibrated—a nontrivial task for such a large number of channels. Furthermore, the
EDAQ/PA pairs are subject to failure due to experimental conditions and are occasionally replaced with fresh counterparts. The individual testing and calibration of each EDAQ/PA pair is ill-suited for a manual process due to large time requirements. Additionally, a manual process for such a large number of cards is prone to human-based error. An automated system is therefore the most desirable solution for testing and calibration. DESCRIPTION OF DEVELOPMENT Hardware Test Stand The testing is performed in a test stand (see Figure 1) designed to replicate the installation of an EDAQ/PA pair onto the TPC. A Stanford Research Systems (SRS) CG635 provides an external clock signal. Power is supplied via a set of coupled Agilent E3620A and E3630A power supplies. Two power supplies are required because of the unique power requirements; the EtherDAQ card requires +24V, while the preamp requires -3.0V, +3.3V, and +7.0V.
Fig. 1. The EDAQ/PA pair test stand. The EtherDAQ card is seated on a bus board, also used in the actual TPC, that distributes the clock signal and power. Cooling is provided via a single forced-air DC fan. Power to the bus board is controlled via a mechanical relay connected to the fan power. This precaution prevents that accidental overheating of the EtherDAQ components since power is supplied to the system only if the fan is operating. Pulse Generation The automated system functions by sending pulses to the EDAQ/PA pair and evaluating the digital output. A computerdriven automated system requires that the pulse generator be controlled by EtherDaqGUI. An SRS DG645 generator was used initially. It was programmable via Ethernet, which enabled integration into an automated system. It was discovered that the DG645 was designed for application requiring precise timing, often at the expense of amplitude consistency. Pulse heights were observed to drift by as much
as 20% from the requested pulse height. The Teledyne-LeCroy ArbStudio 1104 signal generator was evaluated as a potential alternative. It was subject to a variety of extreme cases, such as loading and temperature, and determined to have a total drift of less than 0.1%. Thus, the ArbStudio 1104 was selected to replace the DG645 for generating pulses. Both pulse generators provided a maximum of four output channels. A breakout board in the test stand splits each output eight ways to provide 32 signal The splitting is done such that no two adjacent preamp channels originate from the same output.
The two remaining modes are used only when the testing is completed and can be used to verify the test results. In both of these modes the console output is replaced by an image viewer. The first of these is the waveform viewer mode, which is specially designed to look at waveforms one-by-one. The second, the analysis viewer mode, is much more extensive. It allows the direct comparison of waveforms from the same set, as shown in Figure 3. The test analysis results, such as variations in pedestal values or timestamps, can also be plotted and visually verified in this mode.
Software The automated calibration and testing system utilizes two software packages. The first is EtherDaqGUI, which serves the purpose of testing the hardware and recording waveform data. EtherDaqGUI was developed at Lawrence Livermore National Lab and runs on Microsoft R Windows R XP. The original purpose was the characterization and validation of the EtherDAQ cards. Integral to these processes was the ability to configure and communicate with the EtherDAQ cards using a graphical user interface (GUI). These two criteria resulted in the selection of EtherDaqGUI for use in the automated system instead of developing a new program. The calibration measurements required the individual fitting of hundreds of waveforms per channel to determine the gains over a large dynamic range. Additionally, the number of channels per TPC results in a very large data set to be analyzed for the calibrations. No suitable program was available for performing the calibration calculations. A new analysis package, temporarily called PreAna for preamp analysis, is currently being developed at Idaho State University to fill this need. Eventually it will be used to generate and upload the calibration measurements to a central database. These measurements will then be available for use in the NIFFTE reconstruction software. EtherDaqGUI A new tab was created in the GUI to contain all the functionality necessary for the card testing. Three modes are available, and can be toggled using the buttons in the upper-left section of the tab window. In the first mode, the test steps and results are reported in the console window during testing. The user is also able to specify the tests to run, and then fine-tune the parameters in the Advanced Settings dialog, shown in Figure 2.
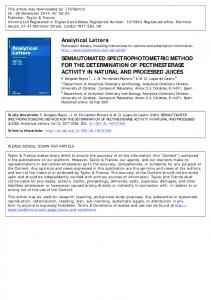
Fig. 2. The advanced options dialog.
Fig. 3. The analysis viewer mode. It was necessary to modify EtherDaqGUI to control the ArbStudio 1104 signal generator. The control interface provided by Teledyne LeCroy for the ArbStudio 1104 was written in C# and controlled via USB. This was overcome by developing an intermediary interface written in managed C++ for the .NET Framework that can access C# libraries. The intermediary control library was then compiled as a dynamic-linked library used by the EtherDaqGUI native C++ code. The switch to the ArbStudio 1104 also provided the additional capability of a fully-programmable waveform shape, e.g. sinusoidal or triangular in addition to a standard square pulse. The newly developed intermediary control library was configured to utilized this capability and includes a dialog, show in Figure 4 to configure pulse shapes. Currently only square pulses are used for testing cards, although this may be changed. For this reason only a small set of shapes were implemented in the intermediary control library. This can be expanded in the future to include any shape representable by a Fourier series. PreAna Significant progress has been made towards the completion of PreAna. At the time of writing, the completed items are the GUI, data input, waveform display, and integration of MINUIT2 for fitting. A screenshot of the basic GUI and waveform display functionality are shown in Figure 5. PreAna, designed using the Windows R application programming interface, is compatible with all versions of Windows R XP and newer. The statistical validation of the waveform fitting and the calibration calculations components are currently being developed. In order to trust the calibration measurements, it will be necessary to understand the sources of uncertainty in the analysis process.
waveform data is output to a plain text file, which is then read into PreAna. The development of the semi-automated system has already provided the ability to test EDAQ/PA pairs. It has been tested with a sample set of EDAQ/PA pairs containing both defective units and production-level pairs. The defective pairs were correctly flagged, and the production-level pairs passed the test. A tribute to the manufacturing process, no productionlevel EDAQ/PA pair has yet been found to fail the EtherDaqGUI test. ACKNOWLEDGMENTS This research is being performed using funding received from the Integrated University Program.
Fig. 4. The waveform customization dialog. Components waiting to be completed are the generation of a baseline and database integration. The baseline generation cannot be completed until a sample set of cards has been fully calibrated. The database integration is the end goal, and will make the calibration measurements available on-demand to the REFERENCES entire NIFFTE collaboration. 1. NIFFTE COLLABORATION, “Annual Technical Report Fission Time Projection Chamber Project,” Annual report, DOE Collaborative Reasearch (October 2012). 2. M. HEFFNER, V. RIOT, and L. FABRIS, “A Compact, Flexible, High Channel Count DAQ Built From Off-theShelf Components,” IEEE Transactions on Nuclear Science, 60, 3, 2196–2202 (June 2013).
Fig. 5. Current stable version of PreAna. RESULTS The current version of the test stand breakout board has significant crosstalk. The crosstalk is currently being characterized. If the crosstalk exhibits consistent behavior, it will be possible to eliminate the crosstalk within the software itself. Conversely, a new solution will need to be engineered if the crosstalk cannot be removed. This is a critical component of the analysis—the crosstalk must be deconvolved without violating the strict uncertainty tolerances of the project. EtherDaqGUI is used to run a suite of tests on a single EDAQ/PA pair. The testing progress is reported in real time. The user is notified if the EDAQ/PA pair passes the test. The