Kenji NAKAI,1 MD, Junichi TSUBOI,2 MD, Hitoshi OKABAYASHI,2 MD,. Akimune FUKUSHIMA,3 MD, Manabu ITOH,4 Hiroshi KAWATA,5. Fumihiko MIYAKE,6 ...
Development of a Signal-Averaged Vector-Projected 187Channel High-Resolution Electrocardiogram for the Evaluation of the Spatial Location of High-Frequency Potentials and Abnormal Ventricular Repolarization Kenji NAKAI,1 MD, Junichi TSUBOI,2 MD, Hitoshi OKABAYASHI,2 MD, Akimune FUKUSHIMA,3 MD, Manabu ITOH,4 Hiroshi KAWATA,5 Fumihiko MIYAKE,6 MD, and Hiroshi KASANUKI,7 MD SUMMARY Noninvasive risk stratification is important for screening for lethal arrhythmia. We developed a 187-channel signal-averaged vector-projected high-resolution electrocardiograph (187-ch SAVP-ECG) for detecting abnormalities in the spatial location of ventricular high-frequency late potentials (HFLPs) and ventricular repolarization. The subjects consisted of 30 normal controls (CONTROL) and 13 patients with HFLPs (6 with myocardial infarction [MI], 6 with cardiomyopathy, and 1 with Brugada syndrome). The modified X, Y, Z-lead ECG and the synthesized signals from vector-projected 187-channel ECGs were amplified and passed through a digital filter. We calculated the integration of the HFLPs area between QRSend and 30 ms before QRSend. The integrated HFLPs map was superimposed on the corrected recovery time (RTc) and Tpeak-end dispersion maps composed by 187-ch SAVP-ECG. All patients received an examination by 64-channel magnetocardiography (64-ch MCG) on the same day. The spatial distribution of HFLPs by the 187-ch SAVP-ECG map was in agreement with the location of increased RT dispersion in MI. The spatial distribution of HFLPs in DCM demonstrated a wide variety of patterns. Interestingly, the spatial distribution of HFLPs in cases with ARVC was located at around a right ventricular outflow region. The spatial distribution of HFLPs by 187-ch SAVP-ECG was in agreement with those determined by 64-ch MCG. The 187-ch SAVP-ECG might be useful for evaluating the spatial distribution of nonuniform conduction and ventricular repolarization heterogeneity. (Int Heart J 2007; 48: 701-713) Key words: Vector-projection, Body surface mapping, High-resolution ECG, Late potentials, Ventricular repolarization, Myocardial infarction, Dilated cardiomyopathy
From the 1 Departments of Laboratory Medicine, 2 Cardiovascular Surgery and 3 Obstetrics and Gynecology, Iwate Medical University, 4 ICS, Co., Ltd. Iwate, 5 Division of Medical Engineering and Clinical Investigation Institute of Development, Aging and Cancer, Tohoku University, Miyagi, 6 Department of Cardiology, St. Marianna University School of Medicine, Kanagawa, 7 Department of Cardiology, Tokyo Women's Medical College, Tokyo, Japan. Address for correspondence: Kenji Nakai, MD, Laboratory Medicine, Iwate Medical University, Uchimaru 19-1 in Morioka-shi, Iwate 020-8505, Japan. Received for publication September 25, 2007. Revised and accepted October 29, 2007. 701
702
NAKAI, ET AL
Int Heart J November 2007
N
ONINVASIVE risk stratification is important for screening for lethal arrhythmia. Breithardt, et al reported noninvasive detection of late potentials (LPs) as a new marker for ventricular tachycardia (VT).1,2) They demonstrated that LPs, which represent late depolarization of a mass of ventricular tissue after slow conduction, herald increased susceptibility to VT. Gomes, et al also reported that the combination of an abnormal signal-averaged electrocardiogram (ECG) and reduced EF may be useful for selecting high-risk patients for intervention.3) The localization of the sources of high-frequency LPs (HFLPs) would help to identify the substrate leading to sustained VT before catheter ablation. Recent advances in electrophysiological mechanisms and therapeutic strategies have been striking.4) A three-dimensional electro-anatomical mapping system is now often used for ablation of VT in various heart diseases.5,6) In addition, Aiba, et al have reported that recovery time (RT) dispersion measured from 87-lead body-surface potential mapping is a predictor of sustained VT in patients with idiopathic dilated cardiomyopathy.7) Previously, we reported the spatial distribution of LPs assessed by 45-channel signal-averaged body-surface mapping.8) Ramanathan, et al reported the activation and repolarization of the normal human heart under complete physiological conditions using an ECG recorded by a body-surface 224-multielectrode vest.9,10) Despite these advances, body-surface mapping has not become a routinely used clinical method.11) One reason for this is that the handling and quantitative analysis of the sequence of excitation and repolarization in the heart using body-surface mapping are not easy. Recently, we reported the significance of three-dimensional RT dispersion using 64-channel magnetocardiography (64ch MCG) for evaluating a repolarization feature.12) We hypothesize that noninvasive combined evaluation of the spatial distribution of ventricular HFLPs and repolarization in patients with lethal ventricular arrhythmias is important. In the present study, we have developed a novel 187channel (ch) signal-averaged vector-projected high-resolution electrocardiograph (187-ch SAVP-ECG) and X, Y, Z-lead ECG based on the concept of vector projection in the Mason-Likar system. We have verified the significance of our algorithm for detecting the location in space of the HFLPs and abnormalities in ventricular repolarization. METHODS Study population: The study population consisted of 30 normal volunteers
(CONTROL) and 13 patients with ventricular HFLP. Of the latter, 6 had old myocardial infarction (OMI), 6 had cardiomyopathy (CM) including one with arrhythmogenic right ventricular cardiomyopathy (ARVC), and one had Brugada
Vol 48 No 6
VECTOR-PROJECTED 187-CHANNEL HIGH-RESOLUTION ECG
703
Table. Baseline Characteristics of Cases With HFLPs. No.
Age
DIAG
VT
CAG
fQRS
LAS
RT disp
Tp-e disp
RT loc
HFLP
LPECG
LPMCG
1 2 3 4 5 6 7 8 9 10 11 12 13
56 64 74 70 71 53 63 64 58 57 76 57 33
OMI OMI OMI/VSP OMI OMI OMI DCM DCM DCM DCM DCM/CLBBB ARVC Brugada
+ + + + + -
RCA LCX LAD LCX RCA LAD ns ns ns ns ns ns non
152 140 104 131 163 202 131 170 218 185 166 187 130
61 56 75 59 69 130 44 103 143 69 42 137 51
62 55 65 26 6 32 37 22 13 55 27 23 19
8 28 5 11 16 13 41 20 61 71 59 61 46
INF-POST POST ANT INF INF ANT ANT INF INF POST ANT RVO RVO
positive positive positive positive positive positive positive positive positive positive positive positive positive
INF POST ANT INF INF ANT ANT INF INF POST ANT-LAT RVO RVO
INF POST ANT INF INF ANT ANT INF INF POST ANT-LAT RVO RVO
DIAG indicates diagnosis; VT, ventricular tachycardia; CAG, lesion by coronary angiography; fQRS, filtered QRS (ms); LAS, duration of < 40uV of RMS; RT dis, RT dispersion; Tp-e disp, Tpeak-end dispersion; RT loc, location of increased RT dispersion; HFLP, high-frequency late potential; LPECG, location of HFLP by 187-ch SAVP ECG; LPMCG, location of HFLP by 64-ch MCG; OMI, old myocardial infarction; VSP, ventricular septal perforation; DCM, dilated cardiomyopathy; CLBBB, complete left bundle branch block; ARVC, arrhythmogenic right ventricular cardiomyopathy; Brugada, Brugada syndrome: RCA, right coronary artery; LCX, left circumflex; LAD, left anterior descending artery; INF-POST, infero-posterior; POST, posterior; INF, inferior; ANT, anterior; RVO, right ventricular outflow; LAT, lateral; + , compliacted with VT; -, no recording of clinical VT; ns, no significant stenosis; and non, not performed.
syndrome. None of the CONTROL population had evidence of myocardial infarction (MI) in their histories or in 12-lead ECG. All patients underwent a 64-ch MCG. The existence of ventricular HFLPs was defined by X, Y, Z-lead ECG of SAVP-ECG. The patient characteristics are listed in the Table. The institutional ethics committee approved the research protocols (H17-2), and all patients gave their informed consent. All procedures were performed in accordance with institutional guidelines. 187-channel signal-averaged vector-projected high-resolution electrocardiograph (187-ch SAVP-ECG) : The prototype 187-ch SAVP-ECG consisted of an elec-
trode leads system, an input box, a high-precision amplifier (prototype; Fukuda Denshi Co., Ltd., Tokyo), and a personal computer with software specifically designed for custom data analysis. The input box generated modified X, Y, Z-lead ECGs and 187-ch SAVP-ECGs using the Mason-Likar lead system. The input signal (± 550 mV) was digitized at 2 kHz by an analogue-digital translate circuit (A/D) converter with a resolution of 0.076 µV. An isolation circuit recognized the electrical separation between the input and output circuits in the form of an optical signal, thereby preventing accidental exposure of the subjects to electrical currents. The control department consisted of a CPU, ROM, RAM, and an application program specifically designed for our purpose. The output section con-
704
NAKAI, ET AL
Int Heart J November 2007
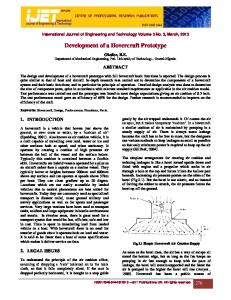
Figure 1. Vector-projected property for 187 fixed-positions on a torso surface model, prototype 187-ch SAVP-ECG system, and a block diagram. Eleven parallel, equally spaced transverse levels with 2-inch spacing between the levels. Level 5 coincides with the second intercostal space and level 6 coincides with the center of the heart. Seventeen letter designations (A-I) indicate the intersection with each transverse level of radial lines separated by equal angles of 11.25 degrees emanating from the longitudinal anatomic axis of the torso. A/D indicates analogue-digital translate circuit; PC, personal computer; V2, precordial lead of V2; R, right upper arm; L, left upper arm; F, left lower body; and RF, right lower body.
sisted of a visual display unit and a printer. The Mason-Likar lead system was used. We attached 10 electrodes; to the right shoulder (R), left shoulder (L), left lower abdomen, right lower abdomen, and precordial V1 to V6. An electrode was connected to an input box at one end. A vector-projected property corresponding to an electrode position of 187 leads was determined as described above. A vector-projected property for 187 fixed positions on a torso surface model, based on the theory reported by Frank13,14) was used. These representative points are shown in Figure 1. Eleven parallel, equispaced transverse levels, with a 2-inch space between the levels, were used. Level 5 coincides with the second intercostal space and level 6 coincides with the center of the heart. Seventeen letter designations (A through I) indicate the intersection with each transverse level of radial lines, separated by equal angles of 11.25 degrees, emanating from the longitudinal anatomic axis of the torso.
Vol 48 No 6
VECTOR-PROJECTED 187-CHANNEL HIGH-RESOLUTION ECG
705
The electrical potentials at 187 points were calculated using the following equation: Vp = Lp • H = IpxX + IpyY + IpzZ where Vp is the electrical potential at point p in each of the 187 channels, Lp = (Ipx, Ipy, Ipz), in which Lp is the vector projection at the P position, and H = (X, Y, Z), in which H is the cardiac electromotive force vector by the input signal from X, Y, Z. For an individual wave pattern of 187-channel ECGs, we calculated the electrical current density (ECD) from the 187-channel ECG signals using the following equation: F(chi, chj) = k × (V(chj) - V(chi))/d(chi, chj)2 where F is the electrical current density (i = 1 ~ 187, j = 1 ~ 187), k is a proportion constant, and d (chi, chj) is the distance between channeli and channelj. In this algorithm, the RT interval was defined as the time difference between the peak points of the R waves of ECD and the occurrence of the positive maximum peak of the first derivative of the T wave of ECD. The Tpeak was defined as the occurrence of the peak points of the T waves of ECD. The Tpeak-end was defined as the time difference between the occurrence of the Tpeak and the occurrence of the maximum negative derivative of the T wave of ECD. The values for the mean RT dispersion were automatically calculated as the difference between the greatest RT interval (RTmax) and the smallest RT interval (RTmin). The values of Tpeak-end dispersion were also automatically calculated as the difference between the greatest Tpeak-end interval and the smallest Tpeak-end interval. Corrected RT intervals and Tpeak-end intervals were calculated using the Bazett formula as follows:15) RTc dispersion = RTc max - RTc min Tpeak-end dispersion = Tpeak-end max - Tpeak-end min RTc and Tpeak-end dispersion maps were displayed as a 256-color coordinated map according to the time differences. In brief, time differences were scaled by color, with blue indicating < 40 ms (almost normal range of dispersion), yellow indicating 40-50 ms (slightly increased dispersion), and red indicating > 60 ms (extremely increased dispersion). The modified X, Y, Z-lead ECG and the synthesized signals from the vectorprojected 187 ECGs were amplified and passed through a Finite Impulse Response (FIR) digital filter (frequency characterization: 27th order) with a low frequency of 45 Hz and a high frequency of 280 Hz, and then converted to A/D with 12-bits accuracy at 2000 samples/s. After rejecting ectopic beats, the ECG signals over 10 minutes were averaged with the signal-processing system. The nonfiltered X, Y, Z-lead ECG, filtered X, Y, Z-lead ECG, and vector magnitude ECG were displayed on the same time-scale. The interval of the filtered QRS
706
NAKAI, ET AL
Int Heart J November 2007
(fQRS) was determined automatically by the beginning and end of the vector magnitude ECG by the points exceeding 5 times the noise levels. The value of the root mean square of the last 40 ms (RMS40) was also measured by the integrated magnitude at 40 ms before the QRS-end of the vector magnitude. In addition, we measured the duration of low amplitude signals (LAS) under 40 µV on the vector magnitude ECG. The spatial distribution of integrated HFLPs by 187-ch SAVP-ECG was calculated using the following formula: QRSend Σ⏐xi⏐ QRSend-30 where Σ⏐xi⏐is the integration of the electrical potentials of fQRS between 30 ms (initial offset) before the QRSend (QRSend -30) and the end of QRS (QRSend). The endpoint in each channel (i = 1 ~ 187) was defined at the endpoint of the QRS, where the average exceeded the mean plus 5 standard deviations of the noise sample. The integrated HFLPs map by 187-ch SAVP-ECG was generated graphically by dividing voltages that exceeded 5 times the mean noise level. This area was represented by an increasing gray scale. The spatial distribution of integrated HFLPs by 187-ch SAVP-ECG was superimposed on the RTc and Tpeak-end dispersion maps. Three-dimensional HFLPs map by 64-ch MCG: The MCG studies were performed in the Biomagnetism Laboratory at the Memorial Heart Center of Iwate Medical University. The recordings were made in a magnetically shielded room using a 64-channel MCG (prototype; SQUID sensor, manufactured by Hitachi High-Technology, Co., Ltd., Tokyo). The details of measurements with the 64-ch MCG were described in our previous reports.12,16) Briefly, current signals from magnetic coils placed at precordial leads of the V1, V2, V4, and xiphoid regions were recorded, followed by a 10-minute recording in each subject in the same position. The recordings were digitized at 500 Hz, and the frequency characteristic was DC to 200 Hz. Subject interference was removed using a matched filter. The acquired MCG images were processed by custom software (MCG Manager, ICS, Co., Ltd., Morioka, Japan). The three-dimensional electrical current density and heart polygon map were generated using a space filter.16) The spatial distribution of integrated HFLPs by 64-ch MCG was generated by the integrated current density of filtered QRS between 30 ms before the QRSend (QRSend-30) and the end of QRS (QRSend). The integrated HFLPs map by 64-ch MCG was generated and demonstrated graphically by dividing the current density that exceeded 5 times the mean noise level. The positive HFLPs map by 64-ch MCG was represented by an increasing green scale. The HFLPs map by 64-ch MCG was superimposed on the three-dimensional heart polygon wall.
Vol 48 No 6
VECTOR-PROJECTED 187-CHANNEL HIGH-RESOLUTION ECG
707
Statistical analysis: All results are expressed as the mean ± SD and significance
was defined as a P value of < 0.05. Analysis was performed using GraphPad PRISM software (San Diego, CA, USA). Unpaired t-tests were used to compare the mean values between different groups. RESULTS Representative 187-ch SAVP-ECG, filtered X, Y, Z-lead ECG and vector magnitude ECG, 64-ch MCG, RTc dispersion map, and the Tpeak-end dispersion map in normal volunteers (Figure 2) and anterior MI (Figure 3) are displayed. The waveform of the 187-ch SAVP-ECG was similar to that of the 64-ch MCG.
A
C
B
D
Figure 2. Representative 187-ch SAVP-ECG, 64-ch MCG, filtered X, Y, Z-lead ECG, and RTc dispersion map (upper) and Tpeak-end dispersion map (lower) in the CONTROL. A: Representative synthesized 187-ch ECG. Assumed electrode positions of V1 and V6 are marked by circles. B: Nonfiltered and filtered X, Y, Z-lead ECG. Note that there are no high-frequency potentials after the QRS end in filtered X, Y, Z-lead ECG and vector magnitude. C: 64-ch MCG. Note current signals from magnetic coils placed at precordial leads of the V1, V2, V4, and xiphoid regions are marked by ①, ②, ④ and N, respectively. D: Reference points for RT interval and Tpeak-end interval, and RTc dispersion map (upper) and Tpeak-end dispersion map (lower). The RT interval was defined as the time difference between the peak points of R waves and positive maximum peak of the first derivative of the T wave of ECD. The Tpeak-end was defined as the time difference between peak points of T waves and the negative maximum peak of the first derivative of the T waves of ECD. Note that there are no significant increases in RTc dispersion (upper) and Tpeak-end dispersion (lower).
708
A
B
C
NAKAI, ET AL
Int Heart J November 2007
D
E
F
Figure 3. Representative 187-ch SAVP-ECG, 64-ch MCG, filtered X, Y, Z-lead ECG, and RT dispersion and Tpeak-end dispersion maps in anterior MI. A: Representative synthesized 187-ch ECG. Assumed electrode positions of V1 and V6 are indicated by circles. B: Nonfiltered and vector magnitude ECG. Note that there are high-frequency potentials after the QRS end on vector magnitude ECG. C: RTc dispersion map (upper) and Tpeak-end dispersion map (lower). Note the increased RT dispersion at the anterior lesion. Color scale demonstrates the difference of RTc dispersion; 0 ms, blue; 100 ms, red. D: 64-ch MCG. Note current signals from magnetic coils placed at precordial leads of the V1, V2, V4, and xiphoid regions are marked by ①, ②, ④ and N, respectively. E: HFLPs map by 64-ch MCG. Wire mesh represents the heart wall polygon (red indicates the left ventricle). Small white circles indicate the locations of V1, V2, V4 and xiphoid. Note the HFLPs colored by green scale distributed at the anterior wall. F: Spatial distribution of ventricular HFLPs as defined by the gray scale on RT dispersion map by 187-ch SAVP ECG. Note the ventricular HFLPs located at the anterior lesion, which was in agreement with the increased RT dispersion.
Spatial distribution of HFLPs by 187-ch ECG superimposed RTc dispersion maps and three-dimensional HFLPs maps by 64-ch MCG in representative inferior MI and posterior MI are shown in Figure 4, and those in dilated cardiomyopathy (DCM) with complete left bundle branch block (CLBBB) and arrhythmogenic right ventricular cardiomyopathy (ARVC) with sustained VT are presented in Figure 5. The spatial distribution of the HFLP map in representative anterior, inferior, and posterior MI cases was located around the lesion of increased RT dispersion, suggesting the presence of a necrotic substrate. The spatial distribution of HFLPs by the 187-ch SAVP-ECG map in DCM
Vol 48 No 6
VECTOR-PROJECTED 187-CHANNEL HIGH-RESOLUTION ECG
A
709
B
Figure 4. Spatial distribution of HFLPs by 187-ch SAVP ECG superimposed RTc dispersion maps and threedimensional HFLPs maps by 64-ch MCG in representative cases of inferior MI (A) and posterior MI (B). Upper: HFLPs map by 64-ch MCG. Note the HFLPs colored by green scale distributed at the inferior region (A) and posterior region (B). Lower: Spatial distribution of ventricular HFLPs by 187-ch SAVP ECG as defined by the gray scale superimposed on RTc dispersion map. Note the ventricular HFLPs located at the inferior and posterior regions, which was in agreement with those in the 64-ch MCG.
A
B
Figure 5. Representative HFLPs map by 64-ch MCG and spatial distribution of ventricular HFLPs superimposed RTc dispersion map by 187-ch SAVP ECG in DCM with CLBBB (A) and ARVC with sustained VT (B). Upper: HFLPs map by 64-ch MCG. Note the HFLPs colored by green scale distributed at the antero-lateral region (A) and right ventricular outflow region (B). Lower: Spatial distribution of ventricular HFLPs by 187-ch SAVP ECG as defined by the gray scale superimposed on Tpeak-end dispersion map. Note the ventricular HFLPs located at the antero-lateral and right ventricular outflow region, which was in agreement with those in the 64-ch MCG.
demonstrated a wide variety of patterns, although the spatial distribution of HFLPs was in agreement with the increased Tpeak-end dispersion in several cases.
710
NAKAI, ET AL
Int Heart J November 2007
The spatial distribution of HFLPs by the 187-ch SAVP-ECG map in cases with ARVC was in agreement with an increased RT dispersion that suggested a right ventricular outflow region. The spatial distribution of HFLPs by the 187-ch SAVP-ECG area map in the case with Brugada syndrome was located at the right ventricular outflow region, although there was no significant increased RT dispersion and Tpeak-end dispersion (data not shown). The spatial distribution of HFLPs by 187-ch SAVP-ECG was in agreement with the spatial distribution of HFLPs by 64-ch MCG. DISCUSSION We have developed 187-ch SAVP-ECGs synthesized from 5 actual leads from the Mason-Likar lead system. Furthermore, we have determined the spatial distribution of RTc dispersion and Tpeak-end dispersion by 187-ch ECD and the spatial distribution of HFLPs by 187-ch SAVP ECG. The spatial distribution of HFLPs was verified by the 64-ch MCG. The integrated spatial distribution of HFLPs superimposed on the RTc and Tpeak-end dispersion maps by 187-ch ECD allowed us to evaluate the relationship between the spatial distribution of HFLPs and abnormalities in ventricular repolarization. The image surface is a geometric representation of the relationship between a fixed-position current dipole inside a volume conductor and the electric potential that is produced on the boundary of the conductor. Many factors are believed to be responsible for the distorted “electrical view” of the heart. Frank proposed that a heart-vector projection theory provided deep insight into the nature of the relationship between torso surface voltage and the internal heart generator.13,14) The image surface differs slightly from the physical torso surface. The wave pattern in a representative 187-ch SAVP-ECG is similar to that obtained from the 64ch MCG. However, a lower voltage pattern in precordial leads of V5-6 in the 187ch SAVP-ECG was observed. In any event, this vector-projection property on the image surface is appropriate for an orientation of the fixed-position heart dipole. Usually, the standard ECG is displayed as a wave form that is converted by electrical potential. Essentially, an electrical phenomenon originates an electrical current within the heart. In this study, we have determined the electrical potential by the vector-projection theory, and we also have calculated the ECD at 187 channels. Based on this hypothesis, we have determined the RTc dispersion and Tpeak-end dispersion based on the ECD. This could possibly be used to measure the RTc dispersion and Tpeak-end dispersion in cases with T-wave inversion. Conventionally, QT intervals are used as an index of repolarization abnormality and the QT interval is defined as the interval from a start point of the Q wave to the end point of a T wave.17) QTc dispersion has been well-established by
Vol 48 No 6
VECTOR-PROJECTED 187-CHANNEL HIGH-RESOLUTION ECG
711
multi-channel body surface mapping.7) However, visual examination and sophisticated quantitative analysis of QTc dispersion has not been fully established. Therefore, we have determined the RT interval and Tpeak-end interval automatically. Our hypotheses are as follows: RTc dispersion may be reflected by the dispersion of the activation recovery interval, and Tpeak-end dispersion may be reflected by the transmural dispersion. QTc dispersion may include RTc dispersion and Tpeak-end dispersion. According to recent advances in electrophysiology, the M cell may contribute to an occurrence of transmural heterogeneity. The Tpeak-negative dispersion may reflect repolarization abnormalities of the transmural action potential.18,19) Shimizu, et al have reported that TWA observed at rapid rates under long-QT conditions is largely the result of alternation of the M-cell action potential duration, leading to exaggeration of transmural dispersion of repolarization during alternate beats, and causing development of torsades de points.20,21) In the present study, the values of RTc dispersion and Tpeak-end dispersion were significantly greater in patients with MI and DCM including ARVC. Interestingly, the location in space of increased RTc dispersion might be reflected by the location of necrotic myocardium in representative cases with MI. On the other hand, Tpeak-end dispersion is frequently increased in cases with DCM. Bogun, et al have reported that in patients with coronary artery disease who have nonsustained VT, inducibility of monomorphic VT is associated with an increase in QT dispersion.22) Thus, QT (RT) dispersion may be helpful in predicting which patients with nonsustained VT are likely to have inducible VT by programmed stimulation. HFLPs represent late depolarization of a mass of ventricular tissue after slow conduction and herald increased susceptibility to VT. The localization of the sources of HFLPs would help to identify the substrate leading to sustained VT before catheter ablation. We have previously demonstrated that the spatial location of ventricular HFLPs might be correlated with intracardiac fragmented activity in patients with sustained VT.9) Volkmer, et al have reported an overall success rate with VT ablation using 3D electro-anatomical mapping (CARTO) in 47 patients, with a subgroup analysis comparing VT mapping performed during sinus rhythm or pacing (substrate mapping).23) In the present study, we have demonstrated that a synthesized 187-ch SAVPECG can detect the spatial distribution of HFLPs and ventricular depolarization. Interestingly, the spatial distribution of HFLP in cases with ARVC is in agreement with an increased RT dispersion that suggests a right ventricular outflow region. We postulate that the area of substrate with nonuniform conduction can be screened by this synthesized 187-ch SAVP-ECG. Study limitation: Since our sample size is extremely small, further study with a large sample size and comparisons with electrophysiological studies will be
712
NAKAI, ET AL
Int Heart J November 2007
needed to verify the clinical usefulness of this novel 187-ch SAVP-ECG. ACKNOWLEDGEMENTS This study was supported by a grant from the DREAM-LAND IWATE Foundation of Iwate Prefecture, a Grant-in-Aid for Scientific Research (No. 18500383) from the Japanese Society for the Promotion of Science, and the Open Research Translational Research Center Project.
REFERENCES 1. 2. 3.
4. 5.
6. 7.
8. 9. 10. 11. 12.
13. 14. 15. 16. 17. 18.
Breithardt G, Becker R, Seipe L, Abendroth RR, Ostermeyer J. Non-invasive detection of late potentials in man - a new marker for ventricular tachycardia. Eur Heart J 1981; 2: 1-11. Breithardt G, Borggrefe M. Recent advances in the identification of patients at risk of ventricular tachyarrhythmias: role of ventricular late potentials. Circulation 1987; 75: 1091-6. Gomes JA, Cain ME, Buxton AE, Josephson ME, Lee KL, Hafley GE. Prediction of long-term outcomes by signal-averaged electrocardiography in patients with unsustained ventricular tachycardia, coronary artery disease, and left ventricular dysfunction. Circulation 2001; 104: 436-41. Zipes DP. The year in electrophysiology. J Am Coll Cardiol 2004; 43: 1306-14. Verma A, Kilicaslan F, Schweikert RA, et al. Short- and long-term success of substrate-based mapping and ablation of ventricular tachycardia in arrhythmogenic right ventricular dysplasia. Circulation 2005; 111: 320916. Bogun F, Krishnan S, Siddiqui M, et al. Electrogram characteristics in postinfarction ventricular tachycardia: effect of infarct age. J Am Coll Cardiol 2005; 46: 667-74. Aiba T, Inagaki M, Shimizu W, et al. Recovery time dispersion measured from 87-lead body surface potential mapping as a predictor of sustained ventricular tachycardia in patients with idiopathic dilated cardiomyopathy. J Cardiovasc Electrophysiol 2000; 11: 968-74. Nakai K, Ito C, Moriai N, et al. Spatial distribution of late potentials assessed by signal-averaged body surface mapping. Jpn Circ J 1991; 55: 384-92. Ramanathan C, Ghanem RN, Jia P, Ryu K, Rudy Y. Noninvasive electrocardiographic imaging for cardiac electrophysiology and arrhythmia. Nat Med 2004; 10: 422-8. Ramanathan C, Jia P, Ghanem R, Ryu K, Rudy Y. Activation and repolarization of the normal human heart under complete physiological conditions. Proc Natl Acad Sci USA 2006; 103: 6309-14. Taccardi B, Punske BB, Lux RL, et al. Useful lessons from body surface mapping. J Cardiovasc Electrophysiol 1998; 9: 773-86. Nakai K, Izumoto H, Kawazoe K, et al. Three-dimensional recovery time dispersion map by 64-channel magnetocardiography may demonstrate the location of a myocardial injury and heterogeneity of repolarization. Int J Cardiovasc Imaging 2006; 22: 573-80. Frank E. The image surface of a homogenous torso. Am Heart J 1954; 47: 757-68. Frank E. General theory of heart-vector projection. Circ Res 1954; 2: 258-70. Indik JH, Pearson EC, Fried K, Woosley RL. Bazett and Fridericia QT correction formulas interfere with measurement of drug-induced changes in QT interval. Heart Rhythm 2006; 3: 1003-7. Nakai K, Tsuboi J, Okabayashi H, et al. Three-dimensional spectral map of atrial fibrillation by a 64-channel magnetocardiogram. J Electrocard 2007; 40 (in press) Lepeschkin E, Surawicz B. The measurement of the Q-T interval of electrocardiogram. Circulation 1952; 6: 378-88. Antzelevitch C, Shimizu W, Yan GX, et al. The M cell: its contribution to the ECG and to normal and abnormal electrical function of the heart. J Cardiovasc Electrophysiol 1999; 10: 1124-52.
Vol 48 No 6
19. 20. 21. 22. 23.
VECTOR-PROJECTED 187-CHANNEL HIGH-RESOLUTION ECG
713
Antzelevitch C, Yan GX, Shimizu W. Transmural dispersion of repolarization and arrhythmogenicity: the Brugada syndrome versus the long QT syndrome. J Electrocardiol 1999; 32: 158-65. Akar FG, Yan GX, Antzelevitch C, Rosenbaum DS. Unique topographical distribution of M cells underlies reentrant mechanism of torsade de pointes in the long-QT syndrome. Circulation 2002; 105: 1247-53. Shimizu W, Antzelevitch C. Cellular and ionic basis for T-wave alternans under long-QT conditions. Circulation 1999; 99: 1499-507. Bogun F, Chan KK, Harvey M, et al. QT dispersion in nonsustained ventricular tachycardia and coronary artery disease. Am J Cardiol 1996; 77: 256-9. Volkmer M, Ouyang F, Deger F, et al. Substrate mapping vs. tachycardia mapping using CARTO in patients with coronary artery disease and ventricular tachycardia: impact on outcome of catheter ablation. Europace 2006; 8: 968-76.