DEVELOPMENT OF A SIMULATION PACKAGE FOR MODELLING EMERGENCY MEDICAL SERVICE OPERATIONS Andrew Mason1, Paul Day2, Shane Henderson3, Jeff Meyer2, Jody Snowdon2, Jim Waite2 1
Department of Engineering Science University of Auckland Private Bag 92019 Auckland New Zealand
[email protected] http://www.esc.auckland.ac.nz/Mason/ 2
Optimal Decision Technologies Ltd Private Bag MBE P112 Auckland, New Zealand http://www.optimal-decision.com
3
School of Operations Research and Industrial Engineering Cornell University Ithaca, NY 14853, USA http://www.orie.cornell.edu/~shane/
Abstract: As health care demands increase, we need to find better ways to manage the scarce resources that are available. A new simulation package, named Siren, has been developed to help meet this need in the Emergency Medical Services area. We discuss the development of Siren, illustrate some of its capabilities, and present some of our experiences in using Siren to model ambulance services both in Auckland, New Zealand and in Melbourne, Australia. The Siren project is a collaborative exercise that includes the University of Auckland in New Zealand, Shane Henderson from Cornell University, and the commercial partner Optimal Decision Technologies Ltd.
1. INTRODUCTION The operators of emergency vehicle services face a number of complex problems when designing their operations. Obvious decisions that have to be made include the locations of ambulance bases and the number of vehicles to have operating from each base. Other decisions include determining the start and finish times of staff shifts, the mix of officers to place in each vehicle, and the rules to use when dispatching vehicles. Determining the best configuration that allows an ambulance operator to efficiently meet their performance targets is, unfortunately, too complex a task for even today's powerful optimization systems. Many authors have considered aspects of this problem (eg Carson and Batta, 1990), often using models based on theoretical simplifications of the problem (eg Brandeau and Larson, 1986). In this paper, we provide a brief description of a simulation system, termed Siren, that we have developed to assist ambulance operators in their decision making. This system has been designed to capture the most important aspects of emergency vehicle operations.
2. SYSTEM DESIGN Siren is a purpose-written software system that provides both simulation and analysis capabilities. The simulation is event driven. A typical event sequence starts with the receipt of a call describing an incident at a given location. This triggers the execution of a user-defined dispatch procedure appropriate to the incident type. This dispatch procedure sends 1 or more vehicles to the incident scene and determines which vehicles, if any, will use high-speed lights-and-sirens travel. Events are then generated when the vehicles arrive at the scene, followed by events for the departure of the transporting vehicle (if any) from the scene, the departure of any other vehicles from the scene back to their bases, the arrival of the transporting vehicle at the hospital, and then the return of the transporting vehicle to its base. A flow diagram of this process is shown in
Figure 1. This figure also shows the all-important response time – the time elapsed between receipt of the call and arrival of the first vehicle at the scene – that forms the basis of the ambulance operator’s reported performance. Ambulance waiting at station A: New call arrives
Response Time
B: Call allocated to closest free ambulance C: Ambulance departs for incident scene D: Ambulance arrives at scene
Service Time
E: Ambulance departs for hospital F: Ambulance arrives at hospital G: Ambulance departs for station H: Ambulance dispatched to new call I: Ambulance arrives back at station Ambulance waiting at station
Figure 1. The ambulance dispatch and service delivery process
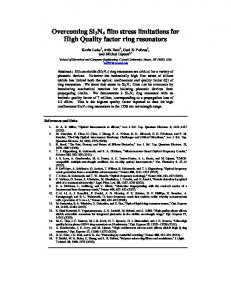
To predict the travel times of the vehicles, Siren includes a detailed transport model that alters the travel times during the day to model the effects of congestion. This travel model is designed to very quickly provide the shortest (or fastest) paths that are required to determine the closest ambulance(s) to a new incident. Fastest travel paths are also generated for sending the dispatched vehicle(s) to the scene, from the scene to the hospital, and then back to their base(s). Figure 2 shows the simulation model in operation. The transport network is shown, along with the ambulances, bases, hospitals and several emergency calls. 3. ANALYSIS AND REPORTING TOOLS An important feature of Siren is its ability to provide detailed geographical reports. One such report is shown in Figure 3. Reporting views such as this have proven invaluable for both analysing historic data and for comparing simulated performance with historic, both in system validation and during what-if analysis.
4. RESULTS AND CONCLUSIONS Siren has now been used for modeling ambulance operations in both Auckland, New Zealand, and in Melbourne, Australia. Our experience is that simulation can provide a high level of detail in modeling ambulance operations. This detailed modeling allows investigation and comparison of alternative business scenarios with a high level of confidence in the predicted operational performance outcomes. Further information on Siren is provided in Henderson and Mason (2004) and BartSim (1999) and is also available from Optimal Decision Technologies (2003).
5. ACKNOWLEDGEMENTS The Siren project is a collaborative exercise that includes the University of Auckland in New Zealand, Shane Henderson from Cornell University, and Optimal Decision Technologies Ltd (ODT). We also acknowledge the valuable input received from St John Ambulance in Auckland, the Metropolitan Ambulance Service in Melbourne, the Auckland Regional Council and Melbourne's Department of Infrastructure. ODT gratefully acknowledges the receipt of a GPSRD grant in 2002 to fund
the additional research and development on Siren required to take this product to market. The work of the 3rd author was supported in part by NSF grant number DMI 0230528.
Figure 2. The simulation in action showing emergency calls, ambulances, hospitals, ambulance bases and the road network.
6. REFERENCES 1.
BARTSim (1999). http://www.esc.auckland.ac.nz/stjohn/
2.
Bell, C. E., D. Allen. (1969) Optimal planning of an emergency ambulance service. Journal of Socio-Economic Planning Science 3, 95 – 101.
3.
Brandeau, M., and R. C. Larson. 1986. Extending and applying the hypercube queuing model to deploy ambulances in Boston. In A. Swersey and E. Ignall, eds. Delivery of Urban Services, TIMS Studies in Management Sciences 22, Elsevier. 121 – 153.
4.
Carson, Y. M., and R. Batta. 1990. Locating an ambulance on the Amherst Campus of the State University of New York at Buffalo. Interfaces 20, 43 – 49.
5.
Henderson, Shane G., and Andrew J. Mason (2004) “Ambulance Service Planning: Simulation And Data Visualization,” In: F. Sainfort, M. Brandeau, and W. Pierskalla, Handbook of Operations Research/Management Science Applications in Health Care. Kluwer Publishers, forthcoming
6.
Optimal Decision Technologies (2003) www.optimal-decision.com
Key: Response time... ≤ 80% target time ≤ 95% target time > 95% target time
Figure 3: Graphical analysis showing response times generated by a simulation run. In this example, there are two target times, an ‘80%’ time of 12 minutes and a ‘95%’ time of 26 minutes. Each call has been classified by calculating which (if any) of these target times the call’s response time falls within. (Note that calls shown as meeting the 80% target time have also met the 95% target time.) In this example, 80% of the calls should be reached within 12 minutes, and 95% within 26 minutes.