System Lifecycle Management, Strategic Design Process Management, Computer-Aided Engineering. 1 INTRODUCTION. In the extended enterprise context, ...
Development of a Software Tool to Support System Lifecycle Management V. ROBIN, S. BRUNEL, M. ZOLGHADRI, P. GIRARD IMS Laboratory – LAPS department, UMR 5131 CNRS, University of Bordeaux, 351 cours de la Libération, 33405 Talence Cedex, France. {vincent.robin ; stephane.brunel ; marc.zolghadri ; philippe.girard} @ims-bordeaux.fr Abstract In the extended enterprise context, many stakeholders act on the product during all its lifecycle. They influence the product development and managers have to be able to control all the activities and their interactions that are generating the different processes. They have also to manage each actor involved in the project during the product lifecycle. In this paper, propose an approach to identify, define and manage factors influencing product development. It is the System Lifecycle Management. PEGASE, a prototype of software to control design project, follow-up the system evolution and support decision-making, is also presented. Keywords: System Lifecycle Management, Strategic Design Process Management, Computer-Aided Engineering.
1 INTRODUCTION In the extended enterprise context, many stakeholders act on the product during all its lifecycle. The notion of performance in product development not only concerns the product and the process but also the organization of actors and the system on the whole. Since the beginning of the development, managers have to encourage and favour collaboration between actors involved in the project. They have to manage design teams and existing networks but also to create new partnerships. These partnerships not only concern design process but also all the phases of the product lifecycle. In this paper, we focalised on the design phase management since it has many preponderant influences on the other phases of the product lifecycle. We are interested in the definition, the follow-up, the capitalization and the reuse of the performance inductors that could have an influence on the design performance. First, we study the PLM (Product Lifecycle Management) epicycle view to identify factors influencing product development and the information flows between them. Second, we propose a model to manage these factors and we focus on their description through out the system, from the actors to the enterprises network. Objective is to identify specific factors impacting the performance of each entity of the system. Finally, we present a prototype of software to control product development process and to support decision-making. 2
SYSTEM LIFECYCLE MANAGEMENT (SLM) IN THE EXTENDED ENTERPRISE CONTEXT Co-ordination and control of design projects are part of a global approach for the new products/systems development that implies the need to identify the different situations occurring during the design process and the adequate resources to satisfy design objectives. The design situations are described by identifying components of the design activity and their relationships [1],[2]. In design project management, the control of the design process is defined as the understanding and the evaluation of these existing design situations to take decisions. These decisions will modify and improve the
CIRP Design Conference 2009
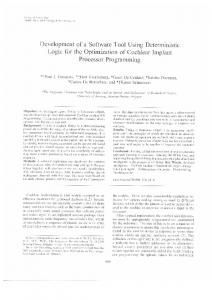
future process, according to design objectives given by customer specifications or the company strategy. In a nutshell, management of design projects is a decisionmaking problem to support designers in their activities and achieve an objective in a specific design context [3]. This context has an influence on the project and refers to the environment of the enterprise (society, subcontractors, market, supply chain, etc) and to its organization [4]. Influences of the context affect each entity of the organization. Sudarsan et al. [5] proposed a high level view of these influences in their adaptation of the epicycle diagram adapted from [6] (Figure 1). It explains the epicycle nature of PLM and characterizes the information flow pattern in any product lifecycle. The PLM epicycle current view emphasis that many kinds of information have to be considered and managed to ensure a coherent multi-level project management adapted to each decision-maker at each decision-level. In such a context, PLM support needs to connect the product design and analysis processes to the production and supply chain processes, including: product data management (PDM), component supplier management (CSM), enterprise resource planning (ERP), manufacturing execution systems (MES), customer relationship management (CRM), supply and planning management (SPM), and others that will undoubtedly follow [7]. Objective is to provide to each project manager a set of information representative of the real state of the system. All the data and the information have to be synchronized for each project in the organization to ensure coherence of the project management. Information has also to be continuously defined and characterized to permit an efficient decision-making during the progress of the project. It is possible only if all information flows, for each project are traced, analyzed and exploited to follow-up the design project. To identify and manage all these information flows, our approach was to developed a model centred on the design system (the system in which the product/system is designed) in order to analyse and describe them and to follow- up its evolution.
P roduc t design , evo lution, design organization an d pr actic e, product researc h, deman d, need for society reward, di spo sal
Specific ation birth Tec hn ology Fo rmal/in formal rep. Mo del lin g lan gua ges Onto logy, KR Stan dards and best practices
Pro duct in use a nd soc ietal feedback
Sc ience Resourc es: • Hu man • In fo rmation • co llabo ration • In frastru cture • Organ ization
Man ufa cturing Supply chain Di stribution
Design an alys is V&V P erforma nce Qu ality
Design: • Co nceptu al • P roduc t • P rocess Design activities, tools
Figure 1: PLM epicycle current view
•
Link 2
The technological factor that concerns the techno-physical environment (scientific and technological knowledge). The context in which the design process takes place. It includes natural, socio-cultural and econo-organizational environments (external and internal environments).
Human and his different activities during design process (actor). These factors influence the design process and the design system. All of them and their interactions are integrated in a model composed with a technological axis, an environment axis and an actor one (Figure 2). Then specific objectives, action levers and performance indicators, dedicated to the design system, have to be identified according to these elements. Interactions between these objectives, action levers and performance indicators have to be considered to supply pertinent information to decision-makers. These interactions are a composition of each element of the model and of relationships between them. The product, process and organizational models allow us to put in evidence and manage relationships between factors influencing performance of the product development [4] (Figure 2). These models are local performance inductors for design system and interactions between them provide a dynamic vision of the design system evolution. In this model, the description of factors influencing the design system, at each decision-making level provides a global vision of the design context. Hence, thanks to such a representation of the design context, the decision-maker can analyse the design situation and identify particularities of each •
Actor Actor Axis
•
project. He is able to observe evolution of each component (environment, technological and actor one), interactions between them and consequently adapt his project management method. He could also study the impact of one of his decision by simulating the possible evolution of the system. To make it possible the model must be completed with a methodology to follow-up the design system evolution and to evaluate design process.
Link 3
Enterprise
2.1 Design system modelling During the IPPOP project [8], a model integrating Product, Process and Organization models (PPO model) has been developed [9]. We placed this PPO model in a more global context to describe and analyze the design system. This approach puts in evidence the global and local performance inductors influencing the design system. They have to be considered to follow and manage suitably the design system and the design process co-evolution. Global performance inductors are [4]:
Process
Organization
Link 5 Link 4 xis al A gic olo hn Tec
Scientific and Technological Knowledge
Link 1
Design system
Product
En vi r on me nta lA xis
Link 6
External and Internal Environments
Figure 2: Design system modelling, factors influencing the design system [4] 2.2 A PLM epicycle mediated-view to manage design system and design process co-evolution The global and local performance inductors influencing the design system have to be considered to follow and manage suitably the design system and design process co-evolution. Dynamic of the design system is provided by the evolution of these factors but also by their interactions. PPO model is used to put in evidence and manage these relationships. Sudarsan et al. [5] have proposed a model for the mediation of information flow across the activities of PLM thanks to a common set of ontological structure and information models to represent product and process: the NIST information-modelling framework. The PPO model completes NIST framework by considering simultaneously three models that have an influence on the design system. We could propose the PLM epicycle mediated-view in Figure 3.
Product design, evolution, design organizati on and practice, product research, demand, need for society reward, disposal
Product in use and societal feedback
Specification birth Technology Formal/informal rep. Modelling languages Ontology, KR Standards and best practices
Science Resources: • Human • Information • collaborati on • Infrastructure • Organization
Core PPO model Product ontology Process ontology Organization ontology
Manufacturing Supply chain Distribution
Design analysis V&V Performance Quality
Design: • Conceptual • Product • Process Design activities, tools
Figure 3: PLM epicycle-mediated view
Res ources of the design system
Resources o f the comp any
Scientific and Technological Knowledge
A ct or‘s acquired knowledge
Kno wledge in t he design system
Knowledge in the comp any
Internal Environment
Exis ting relationships in the company
Inte ractions with in ternal syst ems
Internal organization of the comp any
External Environment
Exist ing exte rna l relationships
Inte ractions with external systems
Interactions wit h othe rs compan y
Actor
Act ivities an d actual actor’s state of mind
A ffected resources for design pro je ct s
Affected resources for project s
Scientific and Technological Knowledge
Actor‘s knowled ge u sed in projects
Kno wledge u se d in the design system
Kno wledge used in the company
Internal Environment
Effective inte rn al relationships during proje cts
Effe ctive interactions with in ternal syst ems
Current organization of the comp any
External Environment
External relationships during proje cts
Inte ractions with external systems during projects
Interactions wit h othe rs compan y during project s
Actor
Professional / perso nal evolution
Evolution of t he resources in the design system
Evolution of the reso urces in the company
Scientific and Technological Knowledge
Evolution of actor‘s knowledge
E volu tion of knowle dge in the design system
Evolution of knowled ge in the comp any
Internal Environment
Creation o f new internal relationships
Evolution of t he interactions with in ternal syst ems
Evolution of the organizatio n of the comp any
External Environment
Creation o f new e xternal relationships
Creat ion of interactions with external systems
Creation of int era ctions with othe rs compan y
Figure 4: Global performance inductors influencing PD
System Lifecycle Management
Positioning, pe rsonal aspects
Knowledge management
Actor
Real-ti me sy stem manageme nt
“As-wa s” situation (past) As-i s situati on (present) To-be situation (future)
System Lifecycle
Ente rpris e / Compa ny
Predictive sys tem mana gement
Desi gn sy stem Actor
The aim of our approach is to propose concepts, models and software tools to obtain an extended PLM support managing the global co-evolution of the product and the system. Our ambition is to work on the opportunity to make evolve models, approaches and tools from PLM to SLM (System Lifecycle Management). The SLM approach has to consider all the elements of the system influencing the product development (PD), their interactions and their co-evolution to establish the better context for decisionmaking. That obliges to have a modelling of the enterprise and of the network in which it has to evaluate. Objective is to capitalize and follow information about each entity of the system. This capitalization helps decision-makers to analyze and understand the as-is situation regarding to the capitalized information (“aswas” situation) and to evaluate the impact of its decisions by considering the possible evolution of the system (the to-be situation). The system could be described by defining the global and local performance inductors and their interactions. The description of the system according to different viewpoints allows obtaining a great number of information that has to be capitalized and dynamically managed [10]. Figure 4 presents a macroscopic description of the system regarding different viewpoints. This figure focuses on the global performance inductors and we have the same description for the local performance inductors [10]. Specification of all these elements permits the creation of a model of the system. 3 SOFTWARE TOOLS FOR SLM According to the SLM concept and the PPO model, we developed a prototype of software to support actors during a design project: PEGASE. To ensure that our prototype respects criterion of conformity, reliability, safety, dimensioning and maintainability [11], the design phase was based on concepts proposed by the creators of UML language [12]. This choice is justified by the fact that this method is very structured. Objective is to capitalize, manage and use information about the system and its evolution to support decision-making. PEGASE must answer is to ensure the connection between the structuring of the organization of the company relating to the creation and the control of a different kinds of projects. Information in the database has to be generic to offer the opportunity to help decision-makers in different situations. The detailed analysis of processes and of the mechanisms of decision-making throughout the product development allows identifying elements that have to be managed to control product development process (Figure 2). PEGASE has been developed to integrate and manage all these elements to ensure a coherent vision of the system (from a macroscopic vision (the network of enterprises) to a microscopic one (the actors of the projects)). The administrator of the system implements and configures the data base. The product development process has to be structured, planned and resources have to be allocated. This phase is realized by the projects managers. Finally, PEGASE controls project evolution by managing the realization of the designers’ activities. It also helps managers to follow-up the project. In a nutshell, control of the product development
processes thanks to PEGASE results in several actions from the genesis of the projects to their closure: •
implementation and configuration of the data base,
•
structuring and planning the projects and allocated resources: o after a project was initialized and the objectives of the company were specified, the head of project structures his project to achieve his goals, o he defines several sub-projects for which he specifies the objectives and the persons in charge (as local decision centres), o he associates input technical data necessary to achieve the designers’ goals, and output technical data corresponding to the achievement of these objectives, o he defines a planning of the activities to be carried out and specifying their data and their objectives,
realize the activities and follow-up the design projects: o to allow the follow-up of the project, the designers generate the awaited technical data and valuate the required performance indicators. These actions associated with the integrated PPO model ensure that the organization of the company, the multilevel management of the projects, the differentiation between the decisions and the transformation of productprocess knowledge, the synchronization of informational and decisional flows and finally the follow-up of the projects are taken into account. •
3.1 Implementation and configuration of the data base Within the framework of GRAI R&D approach [13], the modelling of a company makes it possible to formalize its organization (functional decomposition and decisional system) and its technological system (design process). Via an administrator access, the organization is seized within PEGASE (Figure 5). The structure of the decisional system is defined thanks to GRAI R&D grid. Decision centre are identified and their temporal range, their nature and information flows connecting these centres are identified too. This structure is deployed in PEGASE by associating each element of the organization (plant, services, stakeholders, etc.) and the corresponding decision centres and by connecting them between specifying information flows (Figure 5). The administrator configures information flows that will be implemented in the course of project by the various local coordinators implied in order to ensure the coherence of their communication and their decision-making. Information and the information flows concern the data and links defined during the modelling of the system based on the macroscopic viewpoint on Figure 4.
Structure of the society Summary
Structure
Resources
Compet encies
St atis tic s
Company A
Plant of V eliz y (FR) B Res earch and Development Dept . B
Structure of the s oc iety
Design Depart ment C
Architect ure Depart ment
C
Chas sis Design Depart ment
Su m m a ry
Struc tu re
Res o urce s
C om peten cie s
Sta ti sti cs
(tac tic al )
B
Plant of Paris (FR)
Co l l abo r ati on
Ac tiv i ti es
Ex te rn al c o l a l b o ra tio n
De c i si o na l / Desi gn Fra m e w or k
De c i si o n al / Des i g n Fr am ew or k
Inf or ma ti o n al l n i k
B
Administ rativ e Direction
Fra m ew o rk an d i nfo rm a ti ona l l n i k Add e ntry
B
Sta ti sti c s
Ex ter na l c o l a borati on Pl a n t o f Vel i z y
A
R e sou rc e s
Manufac turing and Quali ty Dept.
Marketing Depart ment
In forma ti on al l n i k Fram ew o rk an d i n o f rm a ti onal l n i k Ad d ex i t
B Res earch and Development Dept . A
P lant of Vigo (SP) B Manuf ac turing and Met hods Dept . B
Welding S hop
B
Machine Shop
M a rk eti ng Pari s (FR )
M a n ufa c turin g … ( FR)
Ch as s si Dept. (FR )
M a n ufa c turin g … ( SP) D es i gn De part me nt (F R)
M a nu fa ctu ri ng… (FR)
We l d n i g Sho p (SP)
M a nu fa ctu ri ng… (SP)
Cha s si s Dep t. (FR)
Decisional links
Stud i es & M ethod s De p t.
Tec hni c a l Esti m a te D ep t.
Informational links
Figure 5: Graphical User Interface (GUI) defining functional structure and organization of the company
Process Definition Summary
Structu re
Resources
Competen cie s
Activities
Statistics
Statistics
(tactical )
Resources
Collaboration
List of thecollaboration activities: External Decisiona l / Desig n Frame work Integrate Safety Integrate Informa tio nal link Constraints Chassis D ata Framework an d informational link
Integrate Pr oducti on Data
Validate Chassis Data
Clo se Integrati on Acti vity
Val idate Prod ucti on Data
Transmit Chassis Data
Add an a ctivity
Integrate Safe ty Constraints
Add an in put
Cl ose Integration Acti vi ty
In tegrate Ch assis Data
Va lidate Chassis Data
In tegrate Production Data
Va lidate Production Too ls
Close In tegration Activity
Transmit Cha ssis Data
Add an o utpu t
Valida te C hassi s Data
Integrate Chassis Data Integrate Production Data
Validate Chassis Data
Chassis Integration
Integ ra te Sa fe ty Con strai nts
V alida te Prod uctio n Too ls
Transmit Chassis Data
Figure 6: GUI for the processes definition (description of the sequences of activities) The administrator deploys the processes modelled in the organization by associating to each decision centre the sequences of tasks (Figure 6). This process could be formalized according to the quality procedures of the company. When configuration is completed, PEGASE is operational. The administrator creates and initializes a project by sending the decision frame and associated design frameworks to the decision centres concerned in
the organization. The administrator access also permits to define the whole of the resources: human, material and software. The knowledge and competencies of the actors are also managed. They could be specified according to competencies matrix of the company. Managing actors’ competencies allows decision-makers to find and affected to specific tasks human resources during the design projects (Figure 7).
Huma n Resour ces Mana gem ent Sum mary
S tructure
Resour ce s
Compe tencies
St atistics
(tact ic al)
You ar e man aging h uman resourc es for the pro ject : Select criterio n to se arch a r esourc e for the project All
None
T echnic al comp etencies Abili ty to u se s oftware
Chas sis M9 0
Name: LEGARDEUR Surname: Je rem y Fu nctio n: Car Ar chitect Situatio n: Inter n r esourc e Availab ili ty: 50% rega rdi ng all projects
Tec hnical c om peten cie s
Organizational compete ncies
PHP Langua ge C+ + Language ANS Y S CA T I A V 5 Pro Engineer CA M Works
Meth o ds Search Affect a huma n resourc e to the project: Affect
Res ource Decis i on-mak er
Designe r G ene ral c ompetencies
Affect ed Re so u rces: To the activity : Chassi s Integra tion In the department: Des ign Depa rtment ( FR) For th e projec t : Chas s is M9 0
Social compete ncies
Te chnica l compe tency : Softwar e
L EGA RDEUR J e re m y D e le te
ANSYS
U p da te
De si g ner for th e project
L evel 3
M odify
De lete
Ro le
Cha rge:
S ocial co mpeten cy : Know-how
F or th e pr o jec t
A vaila bility :
Extrave rt
F or o the r p r ojec t
L evel 2
M odify
De lete
Figure 7: GUI presenting general information about an actor and planned. The coordinator has the opportunity to 3.2 Structure, plan and follow-up a design project create sub-projects which will be automatically When the project is initialized, PEGASE systematically associated to decision centres for the lower decisional informs the users of the new events which relate to them. level. He defines finally the tasks to be carried out by So each coordinator is informed of his new statute when completing whole or part of the tasks specified by the he is connected. He has information about the administrator, or by introducing new tasks depending on organisational structure of the company in order to know the needs for the project. It guarantees the flexibility of the other coordinators with whom collaborations will be the process evolution during the project. By using the established. He is able to reach directly the details of the preset informational links, PEGASE informs each new new project and to reach the decision frame or the design local coordinator of sub-projects and each designer framework that is sent by the upper decisional level affected to specific tasks. Project managers and the (Figure 8). The decision frame enables him to know his designers have the same GUI (Figure 8) to understand context of work: his objectives, his criterion and decision the context in which they must carry out their tasks. variables, his constraints, his performance indicators and Difference is that project manager could create the resources which are allocated to achieve his goals performance indicators and designer just could complete regarding to performance indicators. He is then able to these indicators. They must, at the end of their task, begin the phase of control previously structured, assigned indicate the values of the performance indicators. Decision framework Summary
St ruc ture
P roject
[ Return to P roject E dition ]
Objec tives
Performanc e Indicators :
Impact of the welding process on the cost of the chassis: No more than 4% Target: X euros, Actual value of the PI: X euros
Crit erion Const raints
Capacity of the welding shop to realize the welding pass: 100% Target: 100 %, Actual value of thePI: X %
Dec ision Vari ables Perform anc e I ndic ators
Percentage of satisfied constraints of safety: more than 98 % Target: 99%, Actual value of the PI: X %
In formation Human Resources
Maximal duration of the integration phase: 2 months Target: 2 months, Actual value of the PI: X months
M at erial Resources Nam e : Type : Target : Unit : As soc iat ed Obje c tiv e : Add
Choose an Object ive
Cancel
Figure 8: Dedicated actor’s GUI to consult his decision frame
A PhD student is testing PEGASE in a real case study in the case of a partnership with LASCOM. LASCOM is a PLM / BPM solution developer. The company work on the validation of our approach by adapting some concepts developed in PEGASE in their PLM solution (named ADVITIUM). 3.3 Use of the data base to support decision-making To offer new functionalities to decision-makers we are working on new concepts to make evolve PEGASE. Our objective is to combine information in the data base to allow decision-makers to obtain a particular representation of the system, the process or the actors. We have to treat and organize capitalized information of the data base of PEGASE to provide to decision-makers a set of information describing an element of the data base or a specific viewpoint about the system. This set of information could concern the product, the process or the organization (data of the PPO model), or elements of the system (data describing actor, environments or knowledge). According to this information, we propose to decision-makers scorecards describing the resources of the company, the tools used during the different activities and the knowledge. For the moment, this scorecard is a comparative scale (Figure 9).
•
Identify “what I can not do even though other company can do it (external point of view)”: “I know what I can not do and I know who can do that”.
•
Put in evidence the possible difficulties by defining “what I cannot do and to find solutions to provide me information about this lack of knowledge”: “I know what I cannot do but I don’t know who is able to do that”.
Help decision-maker by providing information about possible solutions to solve a problem (internal or external solution, tools, and resources). The gap between the internal and external viewpoints in the representation (white part in figure 9) corresponds to the position “I don’t know that I don’t know”. The gap emphasis that this scale is opened and could always evolves. From now on, to create this comparative scale we correlate information about: •
•
The actor: who possesses information or data about the element and what is the state of his relationship in its environment? We are able to identify if an actor (internal or external actor, department of the company, etc) possesses the information and what he is doing in the system.
•
The supports of the information: what are the objects that permit to “make it real” and to “use” and “reuse” it? To create interactions or collaborations between actors, we have to specify the objects and supports that favour exchanges and the share of information. That could make appear interoperability problems.
Knowledge Knowledge
Tools Tools
Human resources
Human resources
External
Internal Figure 9: Comparative scale Such a comparative scale provides to decision-makers information about the positioning of the company, the design system or the actor (depending on the adopted degree of analysis) and contributes to: •
Know “what my company / design system or an actor is able to do (internal point of view)”: “I know what I know and what I am able to do”.
The knowledge: what are the theories that fund existence of the information about the element? Objective is to precisely define the information. Far from the comparative scale, we are also able to make appear organization of the data and of the information. It possible because we capitalize the way the information is used during an activity, a “map” of the knowledge in the company and of the actors’ abilities. This capitalization allows us to obtain a set of information about the different entities describing actors, knowledge and support of the information. Product, process and organizational models are aggregation of some of these entities. For instance, Figure 10 presents a partial view of the entities and of their organization that have been capitalized during the design process of a bike. The box on the left of the figure is an aggregated vision of the product model of the bike. It is composed with some ball bearings and we have theoretical elements in relation with theses elements. We have also a box to identify the resource which is able to design the product or a part of the product. Specific knowledge, exchanges and collaborations between actors, and actors’ abilities or capabilities could be also put in evidence, All these information are capitalized during the system evolution. This example shows that such a representation could provide information about each entity of a product. The entity could be decomposed, linked with other ones and resources which are able to work on the product or share information about it are identified too. •
The product: a bike
Actor which is able to design a part of the bike
Part of the product: the ball bearings
Theory concerning the ball bearings
Figure 10: Partial representation of information about a bike [5] Sudarsan R., Fenves S. J., Sriram R.D., Wang F., 4 CONCLUSION 2005, A product information modelling framework During the product lifecycle a great number of information for product life cycle management, Computer-Aided concerning the product, the process and the organization Design, vol. 37, n°13, pp. 1399-1411. is created and evolves. Furthermore, the system and its [6] Lederberg J., 1990, The excitement and fascination environment also evolve and information about it too. Our of science: reflections by eminent scientists, vol. 3, objective is to catch information about these evolutions Part 1: Annual Reviews, Inc. and to capitalize them if it necessary. From now on, much information is capitalized thanks to PEGASE but many [7] Sudarsan R., Subrahmanian E., Bouras A., Fenves evolutions are not considered and the database has to be S.J., Foufou S. and Sriram R.D., 2007, Information frequently manually updated. Procedures to automatically sharing and exchange in the context of product capitalize some evolutions are not well established for the lifecycle management: Role of standards, Computer moment and have to be studied and integrated in our Aided Design, doi:10.1016/j.cad.2007.06.012. software. Despite the fact the database does not evolve [8] IPPOP (Integration of Product, Process and quickly, it could be used by decision-maker to analyse the Organisation for engineering Performance situation of the system. Our propositions permit an Improvement) is a french RNTL network project analysis of this situation by capitalizing information about labelled by the French Ministry of Economy, the company, the design system and the actor and their Finances and Industry More information on context of evolution. The comparative scale provides a http://ippop.laps.u-bordeaux1.fr/ vision of what the company is able to do or not. Our [9] Robin V., Girard Ph., 2008, An integrated productapproach and our prototype of software help decisionprocess-organization model to manage design makers to analyse the as-is situation and formalize their system, International Journal of Product strategies. Development, accepted, to be published. 5 REFERENCES [10] Robin V., Sperandio S., Topliceanu G. and Girard [1] O’Donnell F.J.O., Duffy A.H.B., 1999, Modelling P., 2008, Managing product design by considering product development performance, International evolution of design context: from Product Lifecycle Conference on Engineering Design, ICED 99, Management (PLM) to System Lifecycle Munich, Germany. Management (SLM), Proceedings of the 5th [2] Chen H.H, Kang H.Y., Xing X., Lee A.H.I. and Tong International Conference on Product Lifecycle Y., 2008, Developing new products with knowledge Management, Seoul, Republic of Korea. management methods and process development [11] Morlay C., 2001, Gestion d’un projet système management in a network, Computers in Industry, d’information – Principes techniques mise en œuvre vol.59, pp.242–253. et outils. Edn Dunod. [3] Girard, Ph., Doumeingts, G., 2004, Modelling of the [12] Quatrani T., 2000, Modélisation UML sous Rational engineering design system to improve performance, Rose, Edn Eyrolles. Computers & Industrial Engineering, vol.46, n°.1, [13] Girard P., Merlo C., 2003, GRAI-engineering pp.43-67. methodology for design performance improvement, [4] Robin V., Rose B. and Girard P., 2007, Modelling Proceedings of the International Conference on collaborative knowledge to support engineering Engineering Design, Stockholm, Sweden. design project manager, Computers in Industry, vol. 58-2, pp 188-198.