Proceedings for International Workshop on Tools for Managing Globally Distributed Software Development (TOMAG 2007) + Tool Support and Requirements Management in Distributed Project (REMIDI 2007)
Munich, Germany August 27, 2007
Edited by Jos Van Hillegersberg, Frank Harmsen, Chintan Amrit, Dr. Eva Geisberger, Patrick Keil, Marco Kuhrmann
© Chintan Amrit, University of Twente, 2007 Copyright is retained by the authors of the individual papers in this volume.
Title:
TOMAG+REMIDI 2007 Proceedings. The Seventh International Conference of Computer Ethics: Philosophical Enquiry Author: Jos Van Hillegersberg, Frank Harmsen, Chintan Amrit, Dr. Eva Geisberger, Patrick Keil, Marco Kuhrmann (eds.) ISSN: 1574-0846 Publisher: Center for Telematics and Information Technology (CTIT), Enschede, the Netherlands
As part of
International Conference on Global Software Engineering, ICGSE 2007
Program Committee Jos van Hillegersberg, Frank Harmsen, Kuldeep Kumar, Mehmet Aksit, Richard Welke, Matti Rossi, Gert-Jan de Vreede, M. E. Iacob, Robert Slagter, Harry Julsing, Tobias Kuipers, Joost Visser,
Program Committee Matthew Bass, Stefan Biffl, Manfred Broy, Mathai Joseph, Thomas Klingenberg, Vesna Mikulovic, Jürgen Münch, Ita Richardson, Bernhard Schätz, Gernot Stenz,
(TOMAG) University of Twente Cap Gemini Florida International University University of Twente Georgia State University Helsinki School of Economics and Business Administration University of Nebraska at Omaha University of Twente Telematica Institute Mithun Training & Consulting BV Software Improvement Group Software Improvement Group
(REMIDI) Carnegie Mellon University TU Wien TU München Tata Consultancy Services microTOOL GmbH Siemens AG Austria Fraunhofer IESE University of Limerick TU München TU München
Table of Contents
1. Introduction TOMAG 2007……………………………………………………………………………..1 2. Monitoring the Quality of Outsourced Software..…………………….………………………………3 Kuipers, T; Visser, J and de Vries, G 3. MAIS: an awareness mechanism for change identification on shared models…......................12 de M. Lopes, M A.; Werner, C. M. L. and Mangan, M. A. S 4. Exploring Coordination structures in Open source Software Development.....………………22 Amrit, C; Hegeman, J.H. and van Hillegersberg, J 5. A framework for designing integrated tool support for globally distributed software……………30 development teams Herrera, M and van Hillegersberg, J 6. Introduction REMIDI 2007…………………………………………………………………………….37 7. A Sensitivity Analysis Approach to Select IT-Tools for Global Development Projects…………40 Laurent, C 8. Requirements Management Infrastructures in Global Software Development………………….46 -Towards Application Lifecycle Management with Role-Oriented In-Time Notification Heindl, M.; Reinisch, F. and Biffl S. 9. Communication Tools in Globally Distributed Software Development Projects……………..….53 Niinimäki, T 10 A Groupware System for Distributed Collaborative Programming: Usability Issues………..…59 and Lessons Learned Bravo, C; Duque, R; Gallardo, J; García, J and García, P
1st International Workshop on Tools for Managing Globally Distributed Software Development (TOMAG 2007) Chintan Amrit University of Twente
[email protected] Frank Harmsen Cap Gemini
[email protected]
Jos van Hillegersberg University of Twente
[email protected]
Abstract The advent of global distribution of software development has made managing collaboration and coordination among developers more difficult due to various reasons including physical distance, differences in time, cultural differences etc. A nearly total absence of informal communication among developers makes coordinating work in a globally distributed setting more critical. The goal of this workshop is to provide an opportunity for researchers and industry practitioners to explore both the state-of-the art in tools and methodologies for managing global software development (GSD).
1. Introduction Large scale software development is an inherently collaborative, team based process, and hence requires coordination and control in order to make it successful. The advent of global distribution of software development has made managing this collaboration more difficult due to various reasons including physical distance, differences in time, cultural differences etc. Although research on global software development argues the use of communication technologies to alleviate problems caused by separation of workers in time and space, studies have often found them to be not as effective as publicized. A nearly total absence of informal communication among developers makes coordinating work in a globally distributed setting more critical. The goal of this workshop is to provide an opportunity for researchers and industry practitioners to explore both the state-of-the art in tools and methodologies for managing global software development (GSD). The workshop will foster interaction between practitioners and researchers
and help grow a community of interest in this area. Practitioners experiencing challenges in GSD are invited to share their concerns and successful solutions. Practitioners will have the opportunity to gain a better understanding of the key issues facing other practitioners and share their work in progress with others in the field. In this workshop we examine the technologies that go beyond mere communication technologies and which aim to manage the coordination problems encountered in globally distributed development. We are particularly interested in empirical research (case studies) on globally distributed projects such as open source, commercial, and government projects. Such projects are often dominated by social, rather than just technical, issues, and so would significantly benefit from appropriate tool support.
2. Workshop Scope and Theme The main theme of this workshop is Tools for Managing Globally distributed software development. . We are particularly interested in empirical research (case studies) on globally distributed projects such as open source, commercial, and government projects. Such projects are often dominated by social, rather than just technical, issues, and so would significantly benefit from appropriate tool support. Some of the topics of interest to this workshop are: •
Communication, collaboration, and awareness tools for globally distributed software development
•
Visualization systems to support social aspects of globally distributed software development
•
Evaluation techniques for studying the effectiveness and impact of collaborative software development tools
•
CASE and Requirement tools for managing globally distributed systems
•
Project management tools and environments for globally distributed teams
•
Communities of interest, communities of practice, knowledge sharing and organizational learning
•
Interaction in large scale online communities supporting collaboration in local and distributed communities
3. Workshop Presentations Apart from the Key Note speech of Alan Hartman, of IBM Haifa, Israel, the workshop has 3 full papers and one short paper presentation. The workshop accepted both full papers of maximum 8 pages and short pages of 4 pages maximum. We received 3 full papers and two short papers. Among the full papers Lopes M., Werner C. and Mangan Marco describe an awareness mechanism prototype for collaborative modeling. Through a
preliminary case study of 10 university students they try and validate the tool design and usage. Amrit C. and Hillegersberg J. describe a methodology to track globally distributed development. In a case study of 3 open source projects they use a clustering mechanism to see how the tasks of the developers change over a period of time. Kuipers T., Gejon V. and Visser J. present a toolbased method for monitoring software in outsourcing situations. Through the 3 case studies, the authors have shown the usefulness of the method to maintain the software quality through continuous monitoring. Among the short papers, Hillegersberg J. and Herrera M. describe a framework for designing integrated tool support for globally distributed software development teams. Hegeman J.H. and Amrit C. describe a tool which represents the developers and the software they are developing through clustering.
4. Summary and Discussion
One of the goals of this workshop was to have a discussion about the current practices as well as the future of Tool development in a globally distributed software development scenario. In order to have a broader platform for discussion we have a joint session with REMIDI 2007.
Monitoring the Quality of Outsourced Software Tobias Kuipers
Joost Visser
Gerjon de Vries
Software Improvement Group The Netherlands Email:
[email protected]
Software Improvement Group The Netherlands Email:
[email protected]
Software Improvement Group The Netherlands Email:
[email protected]
Abstract—Outsourcing application development or maintenance, especially offshore, creates a greater need for hard facts to manage by. We have developed a tool-based method for software monitoring which has been deployed over the past few years in a diverse set of outsourcing situations. In this paper we outline the method and underlying tools, and through several case reports we recount our experience with their application.
Monitor
Software Annual Report
Board
Quarterly Iteration
IT Management
Montly Iteration
Project Management
Generated Documentation
Software Engineers
I. I NTRODUCTION Outsourcing of application development or maintenance brings about an interesting dilemma. One the one hand, outsourcing promisses cost reduction and increased focus on core business. The vendor organization specializes in software engineering capabilities and realizes scaling benefits. On the other hand, the loss of technical expertise at the client organization leads to loss of control over the quality of the delivered product which, in turn, leads to loss of efficiency and increased costs. To prevent that costs, deadlines, and functionality slip out of control, the remote management of outsourced projects must be grounded in factual technical knowledge of the outsourced system. Is there a way out of this dilemma? In this paper, we argue that this outsourcing dilemma can be resolved by performing tool-assisted monitoring of the quality of outsourced software. Such software monitoring is a highly specialized activity that supports IT management by translating technical findings to actionable recommendations. To avoid the need for in-house technical know-how, this highly specialized activity of monitoring outsourced software can in turn be outsourced to a third, independent party. We have developed a tool-based method for software monitoring which has been deployed over the past few years in a diverse set of outsourcing situations. In this paper we outline the method and underlying tools, and through several case reports we recount our experience with their application. The paper is structured as follows. Section II provides a global overview of the tool-based method for software monitoring that we have developed previously [1]. Section III high-lights the tools that support the method, while Section IV focusses on the quality model it employs. In Section V, we share our experiences with applying the method in the form of three case reports. These reports cover various application scenarios and various software technology platforms. The paper is concluded in Section VI, where we summarize our contributions and reflect on lessons learned and on the value of software monitoring on a more generalized level.
Source code
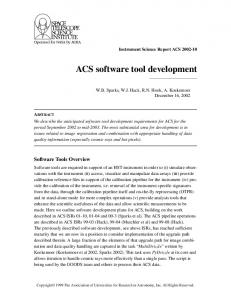
Fig. 1. The various deliverables of software monitoring and their relationships to management levels. On the basis of source code analysis, insight in the technical quality of software systems or entire portfolios is provided at regular intervals to project managers, IT management, and general management.
II. S OFTWARE M ONITORING Previously, we have developed and described a tool-based method for software monitoring which consists of a cycle of activities designed to drive continuous improvement in software products and processes [1]. An overview of the method is provided in Figure 1. A. Source code analysis The basis of monitoring is the frequent analysis of all source code in an automated manner. We have developed a suite of tools, dubbed the Software Analysis Toolkit (SAT), which contains components for parsing, flow analysis, and metric extraction for a wide range of programming languages. The SAT has been designed to be highly scalable and highly customizable. It is suitable for processing software portfolios of many millions of lines of code. We continuously extend the SAT with support for further languages. A dynamic web portal with all extracted software metrics is available to all stake holders in the system or portfolio. B. Scope The scope of software monitoring is flexible, both in duration and in the number of systems being monitored. In some cases, only a single system is monitored, but more commonly all systems with a particular technology footprint (e.g. mainframe systems, or .Net systems) are under scrutiny. When the scope extends to all systems, we use the term software portfolio monitoring. In some cases, monitoring is
er mb
ry
De
ce
Jan ua
Software Annual Report Summarizing
Monthly Iteration Apply SAT
Fig. 2.
Quarterly Iteration Evaluation, interpretation, illumination, recommendation
The various nested iterations of software monitoring.
initiated at the start of system development, and ended at first delivery. In other cases, systems are monitored in their maintenance or renovation phase. C. Deliverables The information extracted from source code is combined with information obtained from secondary sources, such as documentation and interviews with stake holders. On the basis of this combination, insight into the software is provided to various levels of management at different frequencies. With high frequency (typically monthly), fairly detailed information about individual systems is communicated to project managers. With medium frequency, more aggregated information is presented and discussed at the level of overall IT management. With low frequency, the monitoring information of an entire year is compressed into an annual software report, to be presented at board level. Note that the various deliverables are not limited to simply communicating measurement values. The results of source code analysis are interpreted by experts, followed by evaluation and recommendations. Where feasible, targets are set for quality improvement. Thus, a significant consultancy effort is mounted to incorporate the lessons to be learned from software measurements into the software management processes. Below we discuss the various iterations and their deliverables in more detail. D. Iterations The three nested iterations of the monitoring methodology are illustrated in more detail in Fig. 2. Though the typical duration of the shortest iteration is one month, shorter and longer time spans are also used. The yearly iteration is optional, and is typically used only when a significant part of the software portfolio is being monitored. 1) Monthly iteration: In the inner iteration, the Software Analysis Toolkit is applied to the selected software systems or entire portfolio, resulting in a large number of basic facts
about the code. These facts include metrics, dependency information, and detected violations of programming conventions or standards. All these facts are collected into a data repository. From this repository, reports are generated that present the facts in a human digestible fashion. This means that the data is appropriately grouped and filtered, and visualized in graphs and charts that meet the information needs of assessment experts, project managers, and other stake holders. 2) Quarterly iteration: Every three months, the technical data gathered in the inner iterations is interpreted and evaluated by assessment experts. Also, the data is related to other information elicited in workshops and interviews. The findings are presented to IT management together with recommendations about how to react to the findings. By interpretation, we mean that various selections of the data are combined and contrasted to discover for instance trends, correlations, and outliers. For example, based on the fact that certain modules have exceeded a certain complexity threshold, an assessment expert might hypothesize that these modules implement several related functions in a tangled fashion. He might discover that the database dependency information for these modules corroborates his hypothesis. Finally, he may take a small sample from these modules, inspect their code and verify that his hypothesis is indeed true. By evaluation, we mean that the expert makes value judgments about the software system or portfolio. The judgments are based on best practices reported in the literature, on published quality standards, comparisons with industry best and average, and so on. In Section IV, we provide further insight into the structured method we use for software quality evaluation according to the ISO/IEC 9126 software product quality model [2]. The evaluation and interpretation of technical data, as well as elicitation of IT-related business goals are instrumental in the most important element of the quarterly iteration: the drafting of recommendations. These recommendations are of various kinds. They can be detailed, short-term recommendation, such as redesigning a particular interface, migrating particular persistent data from hierarchical to relational storage, or upgrading a particular third-party component. On the other hand, some recommendations may have a more general, long term character, such as integrating two functionally similar, but technically distinct systems, or reducing the procedural character of the object-oriented portions of the portfolio. The deliverable of the quarterly iteration is a presentation of findings, evaluation, and recommendations to IT management in a workshop dedicated to that purpose. 3) Annual iteration: Every year, the deliverables of the monthly and quarterly iterations are summarized in an Annual Software Report. The intended audience of this report is the general management of the company, which is not necessarily IT-savvy. For this reason, the software engineering experts that compile the report need to be able to explain IT issues in layman’s terms. In addition to the summaries of the monthly and quarterly iterations, the Annual Software Report may include IT-related financial information, if available in sufficient detail.
external and internal quality
III. T OOL BASIS functionality
In this section we provide a brief discussion of the tool support for source code analysis on which the monitoring approach is based. The tools offer three overall pieces of functionality: gathering source code, performing static analysis on the code, and visualizing the analysis results. The components that implement analysis and visualization are frameworks into which various subcomponents can be inserted that implement individual analysis and visualization algorithms. A repository that persistently stores all information extracted from the sources is shared by the components for gathering, analysis, and visualization. A. Source Manager Source code files can be brought into the system in different ways. In some cases, a connection is made to the versioning system of the client, such that the upload procedure is fully automatic. In other cases, the technical situation or client preferences do now allow full automation. For these cases, a secure upload facility is provided which can be operated by the client via a standard web browser. B. Analysis Components Once source code files have been uploaded to the system, they will be analyzed statically by the analysis framework. Which analyses are available for the various source files depends on the specific client configuration. Analysis components vary in their degree of sophistication and generality. Some components are applicable only to certain types of files. For instance, a component of control-flow reconstruction may implement an algorithm that works only for ANSI-Cobol-85. Other components are applicable more generally. For instance, a component for counting lines of code and comment could work for any language that employs one of the common comment conventions. The amount of source code in a typical software portfolio ranges between 1 million and 100 million lines of code. Processing this code to obtain the basic monitoring data should under no circumstance take more than a few hours. The computational complexity of the implemented algorithms should be kept within bounds. In this sense, the analysis components must be scalable. C. Visualization components Basically, two categories of visualizations are available: charts and graphs. Both are highly parameterizable. We are not only interested in presenting data about software at a particular moment. We need to visualize the evolution of the software throughout time. Of course charts can be used for this purpose, where one of the axes represents time. Another instrument is the use of animations.
portability reliability
suitability accuracy interoperability security
maturity fault tolerance recoverability
maintainability usability
efficiency
understandability
time behaviour
learnability operability attractiveness
resource utilisation
analysability changeability stability testability
adaptability installability co-existence replacability
Fig. 3. Breakdown of the notions of internal and external software product quality into 6 main characteristics and 27 sub-characteristics (the 6 so-called compliance sub-characteristics are not shown). In this paper, we focus on the maintainability characteristic and its 4 sub-characteristics of analyzability, changeability, stability, and testability.
IV. A PRACTICAL MODEL OF TECHNICAL QUALITY The ISO/IEC 9126 standard [2] describes a model for software product quality that dissects the overall notion of quality into 6 main characteristics: functionality, reliability, usability, efficiency, maintainability, and portability. These characteristics are further subdivided into 27 sub-characteristics. This breakdown is depicted in Fig. 3. Furthermore, the standard provides a consensual inventory of metrics that can be used as indicators of these characteristics [3], [4]. The defined metrics provide guidance for a posteriori evaluation based on effort and time spent on activities related to the software product, such as impact analysis, fault correction, or testing. Remarkably, ISO/IEC 9126 does not provide a consensual set of measures for estimating maintainability on the basis of a system’s source code. Over the course of several years of management consultancy grounded in source code analysis, we have started to formulate a software quality model in which a set of well-chosen sourcecode measures are mapped onto the sub-characteristics of maintainability according to ISO/IEC 9126, following pragmatic mapping and ranking guidelines [5]. We briefly present this model. A. Mapping source code properties quality aspects The maintainability model we have developed links systemlevel maintainability characteristics to code-level measures in two steps. Firstly, it maps these system-level characteristics to properties on the level of source code, e.g. the changeability characteristic of a system is linked to properties such as complexity of the source code. Secondly, for each property one or more source code measures are determined, e.g. source code complexity is measured in terms of cyclomatic complexity. Our selection of source code properties, and the mapping of system characteristics onto these properties is shown in Fig. 4. The notion of source code unit plays an important role in various of these properties. By a unit, we mean the smallest piece of code that can be executed and tested individually. In Java or C# a unit is a method, in C a unit is a procedure. For a language such as COBOL, there is no smaller unit than a program. Further decompositions such as sections or paragraphs are effectively labels, but are not pieces of code that are sufficiently encapsulated to be executed or tested individually.
very high 11%
duplication
x
x x
x
very high 2%
moderate 13%
unit testing
x
high 7%
high 16%
unit size
analysability changeability stability testability
complexity per unit
volume
ISO/IEC 9126 maintainability
source code properties
x
x
x
x x
Fig. 4. Mapping system characteristics onto source code properties. The rows in this matrix represent the 4 maintainability characteristics according to ISO/IEC 9126. The columns represent code-level properties, such as volume, complexity, and duplication. When a particular property is deemed to have a strong influence on a particular characteristic, a cross is drawn in the corresponding cell. .
The influence of the various source code properties on maintainability characteristics of software is as follows: • Volume: The overall volume of the source code influences the analysability of the system. • Complexity per unit: The complexity of the code units influences the system’s changeability and its testability. • Duplication: The degree of source code duplication influences analysability and changeability. • Unit size: The size of units influences their analysability and testability and therefore of the system as a whole. • Unit testing: The degree of unit testing influences the analysability, stability, and testability of the system. This list of properties is not intended to be complete, or provide a watertight covering of the various system-level characteristics. Rather, they are intended to provide a minimal, noncontroversial estimation of the main causative relationships between code properties and system characteristics. Intentionally, we only high-light the most influential causative links between source code properties and system characteristics. For instance, the absence of a link between volume and testability does not mean the latter is not influenced at all by the former, but rather that the influence is relatively minor. B. Ranking For ranking, we use the following simple scale for each property and characteristic: ++ / + / o / - / --. For various codelevel properties we have defined straightforward guidelines for measuring and ranking them. As an example, consider the property of complexity. The complexity property of source code refers to the degree of internal intricacy of the source code units from which it is composed. Since the unit is the smallest piece of a system that can be executed and tested individually, it makes sense to calculate the cyclomatic complexity on each unit. To arrive at a meaningful aggregation of the complexity values of the various unit of a system, we take the following categorization
low 59% moderate 14% low 78%
Fig. 5. Distribution of lines of code over the four complexity risk levels for two different systems. Regarding complexity, the leftmost system scores -- and the rightmost system scores -.
of units by complexity, provided by the Software Engineering Institute, into account [6]: CC
1-10 11-20 21-50 > 50
Risk evaluation simple, without much risk more complex, moderate risk complex, high risk untestable, very high risk
Thus, from the cyclomatic complexity of each unit, we can determine its risk level. We now perform aggregation of complexities per unit by counting for each risk level what percentage of lines of code falls within units categorized at that level. For example, if, in a 10.000 LOC system, the high risk units together amount to 500 LOC, then the aggregate number we compute for that risk category is 5%. Thus, we compute relative volumes of each system to summarize the distribution of lines of code over the various risk levels. These complexity ‘footprints’ are illustrated in Fig. 5 for two different systems. Given the complexity footprint of a system, we determine its complexity rating using the following schema: rank ++ + o --
maximum relative LOC moderate high very high 25% 0% 0% 30% 5% 0% 40% 10% 0% 50% 15% 5% -
Thus, to be rated as ++, a system can have no more than 25% of code with moderate risk, no code at all with high or very high risk. To be rated as +, the system can have no more than 30% of code with with moderate risk, no more than 5% with high risk, and no code with very high risk. A system that has more than 50% code with moderate risk or more than 15% with high or more than 5% with very high risk is rated as --. For example, the system with the leftmost complexity profile of Fig. 5 will be rated as --, since it breaks both the 15% boundary for high risk code and the 5% boundary for very high risk code. The rightmost profile leads to a - rating, because it breaks the 0%, but not the 5% boundary for very high risk code. Similar rating guidelines have been defined for other source code properties. Details can be found elsewhere [5]. The
boundaries and thresholds we defined are based on experience. During the course of evaluating numerous systems, these boundaries turned out to partition systems into categories that corresponded to expert opinions.
Lines of code 90000 80000 70000
C. Practicality of the quality model
60000
Our quality model exhibits a number of desirable properties. • The measures are mostly technology independent. As a result, they can be applied to systems that harbour various kinds of languages and architectures. • Each measure has a straightforward definition that is easy to implement and compute. Consequently, little up-front investment is needed to perform the measurement. • Each measure is simple to understand and explain, also to non-technical staff and management. This facilitates communication to various stake holders in the system. • The measures enable root-cause analysis. By giving clear clues regarding causative relations between code-level properties and system-level quality, they provide a basis for action. Due to these properties, the model has proven to be practically usable in the context of software monitoring.
50000 40000 30000 20000 10000 0 r1
r2
r3 C
Stored procs
r4
Scripts
Fig. 6. System volume in lines of code for the latest 4 releases (Case V-A). Duplication [%] 60
50
40
V. C ASE STUDIES 30
Over the past few years, we have applied software monitoring in a wide range of management consultancy projects. In this section, we share some of our experiences in three anonymized case reports. A. Curbing system erosion during maintenance An organisation has automated a part of its primary business process in a software system some 10 to 15 years ago. A party that currently plays no role in the maintenance of the system built it. Over time, maintenance has passed through a number of organisations. The system is currently being operated and managed in a location in central Europe, and being maintained in South East Asia. The system owner (business requirements developer) is in a different location in western Europe. The system owner periodically requests specific features to be added to the system, and from time to time the system needs to be adapted to a changing hardware environment. We were asked to monitor the maintenance of the system in order to improve management’s control over the technical quality of the software and the associated costs of the maintenance process. As a result of the monitoring activity, we had accurate insight into various system parameters, among which its volume. In Fig. 6, the volume of the system, measured in lines of code, is plotted for the 4 latest releases of the system, separated into C code, stored procedures (PL/SQL), and scripts. Note that an increase in the volume of C code of about 35% occurred between release r1 and release r2. Such increases are normal in development situations, but in the current maintenance situation, where the system had been more or less stable for a number of years, this amount of growth is remarkable. When we asked the various parties involved with the system what
20
10
0 r1
r2
r3 C
Fig. 7.
Stored procs
r4
Scripts
Code duplication for the latest 4 releases (Case V-A).
could explain this growth, we were met with blank stares; nobody could come up with a reason why the system was growing so much. Another parameter that we monitored is the amount of code duplication in the system. This is expressed as a percentage of code lines. A code line counts as duplicated when it participates in a block of code of at least 6 lines that occurs more than once. Apart from some compensation for spacing issues, we count exact duplicates. For the same 4 releases, the measurement values are plotted in Fig. 7. As it turned out, the unexplained growth of the C code between release r1 and release r2 was accompanied by an increase in duplication that was even more pronounced. After some further investigation the underlying cause was identified: from version r1 to r2 a particular piece of hardware was upgraded for some installations of the system. As a result, the driver for that hardware needed to be changed as well. Since the old driver was still needed for the old piece of hardware, the driver was copied completely, and a few minor changes were made to it to facilitate the new hardware. Although there may have been a reason for copying initially
8000
7000
6000
5000 deleted
4000
added changed unchanged
3000
total 2000
1000
0
-1000
r1
r2
Fig. 8. Code modifications on the file level, between two versions (Case V-B).
(shorter time to market, a belief that this was a temporary solution), it will be a burden to maintenance cost in the long run. As the charts show, the initial copying was not subsequently cleaned up in later versions of the system. The fundamental problem, of course, was that no explicit decision was ever made: the developers took this course of action because they felt this was the best, easiest, or quickest way to satisfy a particular change request, but they did not take into account the consequences to the overall system health. By analysing the numbers, and showing the result of the action on the complete code base, we provide both developers and management with the data needed to make an informed, explicit decision regarding the future of the system. In this case, actions were planned in subsequent releases to curb system erosion by refactoring the code such that the introduced duplication was eliminated again. B. Systems accounting from code churn An organisation was building an information system to automate its primary business process. System development was done on three sites on two continents. Requirements gathering and management was done on another two sites in two different countries. An estimated 25 subcontractors were involved in the project, with an estimated 240 people. The perception of higher management was that a significant part of the 240 people involved were developing code on a dayto-day basis. We were asked to monitor the technical quality of the system. When we analysed the system, it turned out to be quite large. It was developed in a modern object-oriented language, and consisted of about 1.5 million lines of code divide over about 7000 files. Based on software productivity statistics [7], a system of this volume, built with this technology, corresponds to about 170 man years, as a rough estimate. The technical quality of the system, judged on the basis of indicators such as modularization, complexity, duplication, etc. did not reveal any major risks, though several points for improvement were identified. Since the system was several years old already, strong doubt arose whether for a system of this size and quality the staffing
of 240 people was justified. To answer this question from management we made an in-depth comparison of two versions of the system, separated by about one year. The overall volume of the system, its complexity, duplication, and other indicators turned out to have been more or less stable over that period. Still, many modifications had been made. We charted those modifications in terms of file creations, deletions, and modification, as can be seen in Fig. 8. When a file was copied, the copy was adapted, and the old file was removed, we counted this as a single file modification. Based on our measurements, it turned out that the amount of change over that year was nowhere near the productivity that one may expect from a 240 people effort. Perhaps 50 would have been more realistic. After we reported our findings, an investigation was started to establish how many staff members were actually active as software developers, to find out what exactly the other people on the project were doing, and what sources of overhead could be eliminated. This investigation led to a restart of the project with less than 30 people, of which about 18 are actively developing software. Development of the system has been brought back to a single location. Requirements gathering is still done at a different location, but people responsible for the requirements spend at least three days a week at the development location. After the restart, the productivity of the project grew in absolute terms. We were told that the project was delivering more functionality (defined in terms of feature requests or change requests) per time unit with 30 people than they were with 240 people. In retrospect this is not as surprising as it seems. It is widely acknowledged that adding more manpower to a software project does not make it necessarily more productive [8]. In addition, dividing resources over a multitude of locations was identified as a major source of overhead and waste. What was surprising to us is that our technology apparently can be used for what we call ‘systems accounting’. Using a very technical (and not very sophisticated) measure, we were able to see right through the 25 subcontractors and the 240 people. In this case, software monitoring at the system level and fact-based interaction with high-level management proved to be decisive in radically improving efficiency. C. Learn from failure, measure for success We were asked to monitor the development of an eCommerce platform for a large bank in the Netherlands. This platform was built from scratch as a replacement for a functionally identical platform which failed in the rollout phase. Because of the earlier failure, the bank and its (new) outsource party decided to use our monitoring service in order to gain insight into the technical quality of the new software. Their key targets for this new project were to realize low costs of maintenance and operation. At the start of the second attempt, we performed an assessment on the code base of the first attempt, which led us to attribute the failure to several factors, including:
eServices
Voortgang/LOC Voortgang/LOC high 1%
very high 12%
very high 0%
moderate 5%
high 18%
low 57%
Dummy
moderate 13% Old
Java
Java
Config
Config
New
eServices
eServices Oude 395,615 eServices
Other
48,441 24,122 0
395,615
100000
200000
300000
400000
CodeCode Duplicatie Duplicatie
Fig. 10. Complexity profiles for both the failed project and the new project (Case V-C). The former system scores --, while the new system scores ++.
Java
48,441 24,122
low 94%
500000
149,713
600000
149,713
Fig. 9. Volume measurements in lines of code for both the failed project and the new project (Case V-C).
An overly complex design that ambitiously tried to generalize the e-Commerce platform so that it could handle future markets. • A design that tried to solve possible performance issues a priori by using a complex distributed J2EE EJB-based architecture. • A lack of (automatic) unit tests and integration tests. Java Java Config Config Learning from these lessons, a set of contrasting goals were set for the new project: 33 33 • A minimalist design that focused only on the eServices current eServices 2 2 product line. 57 Oude eServices Oude eServices • A lightweight approach to system architecture. Fig. 11. Duplication measurements23in lines of code 23 for both the failed project and the new project (Case V-C). • A test-driven approach, by focusing on automated system and unit tests. Continuous monitoring of the source code base was put into while towards the end of the project, this measure stabilizes. place from the start of the new project. For Java code, the final value is excellent, but for non-Java Our monitoring of volume indicators demonstrated that the code duplication is still too high. new approach resulted in a much leaner system. Fig. 9 shows We also measured several coding standards, including: measurements of the lines of code for both the old and new • Double checked locking: 60 instances in the old system system. The measurements are split out between Java code and and 0 in the new. The double checked locking construct other kinds of code, which include HTML, XML, and SQL. introduces a bug in thread synchronization code. As the charts show, the new system was significantly smaller • String reference equality: 22 vs. 0. String reference than the old one (about 7,5 times smaller). Over the period of equality is often a bug introduced by inexperienced 14 months, the volume increase of the new system was almost programmers; the equals method should be called instead. linear, indicating constant productivity throughout that period. • Too generic error handling constructs: 2141 vs. 17. The The new approach also paid off demonstrably in terms 17 cases in the new code were manually checked, and did of quality indicators such as complexity and duplication. not introduce risks (false positives), while sampling the The complexity profiles of both old and new system are 2141 violations in the old code revealed actual problems. shown in Fig. 10. Using the quality model of Section IV, the old system is rated on complexity as poor (--), while Monitoring also revealed that test code was being written, with the new system is rated as excellent (++). The duplication a test coverage stable at about 60% throughout the course of measurements are shown in Fig. 11. The new system contains the project. higher duplication in non-Java code (33%) than in Java code In this case, monitoring helped to reduce the size and (2%), but significantly less than the old system for both kinds increase the technical quality of the new system. Surprisingly, of code (23% and 57%). The timelines reveal that at the start the much simpler (non-distributed) architecture of the new of the project, duplication was low and relatively unstable, system performed much better than the original. Also the •
Dummy
Old
Java
New
Other
0
10
20
30
40
50
60
57
resulting system proved to be much easier to tweak for specific performance issues. In contrast to the previous attempt, this system was successfully concluded and taken into production.
by third-party monitoring of the technical quality of the outsourced software.
VI. C ONCLUSION
Software monitoring, though supported by tools, standards, and models, is a creative process that needs continuous improvement and calibration. Our quality model is still fairly young, and will be further refined based on our experience with its application. Also, changes in the maturity of the software industry will call for adaptation of rating guidelines, application of more sophisticated metrics, and perhaps other analysis instruments. In particular, we are keeping a close watch on developments in the area of analyzing and visualizing software evolution. We collect a extensive set of measurement data in the course of our monitoring and assessment activities. We are currently consolidating this data into a benchmarking data base that will allow well-founded comparisons of systems on the level of source code properties as well as system-level quality aspects.
A. Contributions Some years ago, we developed our tool-based method for software monitoring [1] and introduced it into the market. Since then, we have applied the method in a wide range of circumstances. On the technological side, we have monitored systems built in modern object-oriented languages, as well as classical mainframe languages. On the organizational side, we have acted on behalf of both clients and providers of application outsourcing services (but never both at the same time, naturally). In terms of software life-cycle, we have monitored both system maintenance and development from scratch. More recently, we have used our experience in software monitoring as well as in software risk assessment [9] to draft a practical model for measuring the technical quality of software products [5]. This model has been instrumental for the abstraction and aggregation of source code analysis results necessary for translation of technical findings into management-level notions. In this paper, we have summarized both the monitoring approach and the quality model, and presented them for the first time in combination. Moreover, we have shared our experience of applying the approach and the model in a range of application outsourcing situations. The cases reported include maintenance as well as development situations, various technology mixes, and a variety of organizational contexts. B. Lessons learned Among the lessons learned from these cases and others not reported here, are the following: • Simple measures, but well-chosen and aggregated in meaningful ways, are effective instruments for software monitoring. • The simultaneous use of distinct metrics can be used to zoom in on root causes of perceived quality or productivity problems. • The gap between technical and managerial realities can be bridged with a practical software product quality model. • Monitoring helps to curb system erosion in maintenance situations. • Monitoring code churn allows ‘systems accounting’. • Monitoring helps to achieve clear productivity and quality targets. • The chances of success of software development projects are influenced positively by software monitoring. In the introduction, we indicated that software monitoring, when executed by a third party, can resolve a dilemma that arises from application outsourcing. Indeed, the paradox of removing technical know-how from the organization to an outsourcing party while needed that knowledge to manage the relationship to that party, can in our experience be solved
C. Future work
R EFERENCES [1] T. Kuipers and J. Visser, “A tool-based methodology for software portfolio monitoring.” in Proceedings of the 1st International Workshop on Software Audit and Metrics, SAM 2004, In conjunction with ICEIS 2004, Porto, Portugal, April 2004, M. Piattini and M. Serrano, Eds. INSTICC Press, 2004, pp. 118–128. [2] ISO, ISO/IEC 9126-1: Software Engineering - Product Quality - Part 1: Quality Model. Geneva, Switzerland: International Organization for Standardization, 2001. [3] ——, “ISO/IEC TR 9126-2: Software engineering - product quality - part 2: External metrics,” Geneva, Switzerland, 2003. [4] ——, “ISO/IEC TR 9126-3: Software engineering - product quality - part 3: Internal metrics,” Geneva, Switzerland, 2003. [5] I. Heitlager, T. Kuipers, and J. Visser, “A practical model for measuring mainainability,” 2007, draft, April 30. [6] C. M. Software Engineering Institute, “Cyclomatic complexity – software technology roadmap,” http://www.sei.cmu.edu/str/descriptions/cyclomatic.html. [7] Software Productivity Research LCC, “Programming Languages Table,” Feb. 2006, version 2006b. [8] F. Brooks, The Mythical Man-Month: Essays on Software Engineering. Addison-Wesley Publishing, 1975. [9] A. van Deursen and T. Kuipers, “Source-based software risk assessment,” in ICSM ’03: Proceedings of the International Conference on Software Maintenance. Washington, DC, USA: IEEE Computer Society, 2003, p. 385.
MAIS: an awareness mechanism for change identification on shared models
Marco A. de M. Lopes1, Cláudia M. L. Werner1, Marco A. S. Mangan2 1 System Engineering and Computer Science COPPE – Federal University of Rio de Janeiro P.O Box 68511 – CEP. 21945-970 – Rio de Janeiro – RJ – Brazil 2 School of Computer Science – Pontifical Catholic University of Rio Grande do Sul Porto Alegre – RS - Brazil {mlopes,werner}@cos.ufrj.br,
[email protected]
Abstract Awareness mechanisms could reduce the isolation among distributed software development teams. In particular, they can be applied to concurrent modeling of software artifacts, where a software development team needs to keep track of the evolution of shared models. The developer’s conception of a shared model can be continuously updated with this kind of mechanism. This paper presents an awareness mechanism that collects artifact change information directly from the developer workspace, not influencing his workflow. The objective of this mechanism is to help developers to perceive concurrent artifact changes and coordinate actions to minimize the effort of getting a consistent global state of the shared artifact. Change information is classified, grouped and filtered to reduce a possible cognitive overload. An observation study was performed, aiming to infer some indicators about the utility of the mechanism.
1. Introduction Due to businesses globalization, organizations had to rethink and reevaluate their structures and procedures, to remain competitive in the market. Software organizations are also affected by this trend. These organizations often search for external solutions (e.g. outsourcing) in different locations, to explore the advantages offered in those places. Global Software Development (GSD) [13] takes into account technical, social, and economical aspects of developing software in a distributed setting. This distribution is either geographical (members of a
software development team are dispersed spatially) or over time (team members collaborate in alternated schedules). Herbsleb and Moitra [13] present some factors that motivate GSD: (i) need to obtain scarce resources with certain profiles; (ii) proximity to the software consumer market; (iii) fast formation of corporations and virtual teams, to explore business chances; and (iv) pressure to provide time-to-market, exploring the possibility of increasing productive work hours using the hourly spindle differences among software development team members. These factors are intrinsically related to the increase of productivity and the reduction of costs on software development. This “virtualization” of teams and organizations leads to some difficulties on the interaction of team members. Despite these factors, there are tasks throughout the software lifecycle that still require interactions among individuals: creative brainstorming, pair-programming, and peer review are some tasks that are usually performed by more than one individual. In the context of a distributed software development organization, the enactment of this kind of task needs to be adapted in a way that supplies the lack of some aspects found in a face-to-face interaction (such as communication easiness). The software modeling activity is a software development task that can be done in a distributed setting. For example, delays in schedule could force the adoption of task parallelism to meet the project deadline. In such case, the modeling activity is divided among different developers. More than one developer can develop different model views, exploring parallelism among tasks.
Developers can interact with each other through the work (contributions) on individual copies of a shared software model. From time to time, these copies must be synchronized with a copy stored in a central repository [24]. The divergence among contributions over the shared model can cause a convergence effort, often culminating in rework. In Computer Supported Cooperative Work (CSCW), an awareness mechanism for shared workspaces is an alternative to assist tasks that present some characteristics of the previously described scenario. They provide information to developers about which changes have been done, by who, when, where and how they were done [12]. In the case of interactions over copies of a shared software model, change information is collected and presented to speed up the detection of possible conflicts between the copies of the developers. Therefore, change information makes coordination of actions possible. This kind of mechanism can be found in some general groupware, but groupware task support is not as complete as a specific single-user tool [16]. Sometimes users have to change their way of work to use this kind of mechanism found in general purpose groupware. Figure 1 presents a scenario where an awareness mechanism can be applied. Developers collaboratively design a software model (‘M’), at different time and location. It is assumed that developers D1 and D2 work simultaneously on their copies in [T1, T2] period of time. Now, suppose that developer D3 modifies ‘M’ in a T0 instant of time, before any contribution has been made by D1 and D2. When D1 and D2 begin to contribute over their copies of ‘M’, they must be aware of the changes made by D3. Also, they have to be aware of each other's contributions, as well as who did them. If D3 contributes again some times later (T3), he must be aware of D1 and D2 changes. Thus, an awareness mechanism is useful to make this change information available to all developers.
Figure 1. Interactions over a shared model This paper presents a Multi-synchronous Awareness Infra-Structure (MAIS) mechanism and prototype that aim to collect, distribute and present change information over shared software models. This information is offered to developers who participate in a collaborative modeling interaction. MAIS was developed to be integrated to an existing environment
or editor. The change information related to the state of copies of the shared model is filtered and organized for its presentation. It helps developers to understand changes made over the other copies of the shared model. The proposed approach aims to offer this kind of support without breaking down the developer’s workflow, registering the developer`s awareness state in the shared group memory. The current version of MAIS prototype considers changes over UML models (in particular, class models) developed on the OdysseyShare Environment [21]. The remainder of the paper is organized as follows. The Background work is presented in Section 2. The design of the awareness mechanisms MAIS is discussed in Section 3, and its prototype is presented in Section 4. An analysis of a preliminary viability study is discussed in Section 5. Finally, Section 6 provides the conclusion and future work.
2. Background Work In the GSD context, developers can deal with two sources of complexity [9]: (i) the development complexity of a software artifact, and (ii) the complexity of the distributed software development process itself. So, it is important that developers have some kind of tool support for executing their tasks. CSCW provides many definitions to the awareness conceptIn this paper, awareness means an understanding of the activities of others. This provides a context for a developer’s own activity. This context is used to ensure that individual contributions are relevant to the group activity as a whole, and to evaluate individual actions with respect to the group goals and progress. This information allows groups to manage the process of collaborative working [7]. It is the understanding of a system state (common artifacts where individuals work on, including a particular representation of these), as well as past activities, current state and future options [26]. According to Gutwin and Greenberg [12], the information used to reach an awareness state could be obtained through: (i) transference of others activities information about collaboration; (ii) transference of the information generated by the contributions over some shared artifacts; and (iii) intentional communication between collaboration members. Rosa et al. [23] suggest that the awareness state can be influenced by the context where the collaboration occurs. The elements of this context must be identified and represented to increase the awareness state of collaborators. They consider that these elements can be grouped into five categories of information, related to:
(i) individuals and groups; (ii) tasks previously established; (iii) the relationship between people and tasks; (iv) the environment where collaboration happens; and (v) concluded tasks. This taxonomy was proposed to help the identification of context elements and the implementation of mechanisms that collect and distribute these elements to collaboration individuals. Awareness mechanisms are proposed aiming to offer some indications about what happened, when, how, where, and who has done something. They intend to balance the amount of information that needs to be presented [2]. These mechanisms are implemented to help collaborators on the way they interact, which can be classified as [20]: (i) synchronous, at the same time using the same data; (ii) asynchronous, using the same data but not necessarily at the same time; and (iii) multi-synchronous, where each collaborator has a copy of the shared data and, at certain periods of time, synchronizes his copy to get an updated view of the shared data. To have a complete notion of a collaborative interaction to which they belong, the individuals have to be capable to realize: (i) the social context of groups where they are members, (ii) the context of the activities that they participate, and (iii) changes made on their workspace during the interactions [2]. This approach uses the shared workspace to obtain the awareness information, which is the immediate understanding of actions of individuals [12]. It involves knowing where others are working, what they are doing and what they will probably do. Tam et al. [28] describe the change awareness concept as the ability of individuals to recognize changes done in a collaborative artifact by another participant. Keeping the change history helps the collaboration members to remember past actions, and contextualize new members about the progress of the current activity. Some approaches are found in literature to aid a collaborative software modeling task. CO2DE tool [19] is an implementation of a graphical editor of UML diagrams. It is based on a "masks" metaphor, which represents diagram versions. Another UML collaborative editor is D-UML [3]. Tukan [25] is a distributed environment for Smalltalk programming. SAMS environment [20] allows collaborative edition by synchronous, asynchronous and multi-synchronous modes of interactions. NetEdit [31] is a collaborative web-based text document editor. There are collaborative tools that are non-obtrusive while collecting and distributing awareness information, that is, these actions do not disturb developers when they are doing a collaborative task.
Palantír tool [24] complements configuration management systems by offering information about workspaces of other developers in a collaborative session. Kobylinski et al. [15] present an approach of an awareness system that allows collaborators to monitor activities of others over software artifacts. These approaches can be classified according to the interaction mode between individuals. For example, CO2DE, D-UML, and Tukan approaches offer support to synchronous interaction (CO2DE also provides asynchronous support). Palantír, SAMS, NetEdit and the approach described in [15] work in a multisynchronous way, providing support to synchronous and asynchronous modes too. However, these approaches do not present the developer's awareness of a given change over shared artifacts as the approach proposed in this paper does. This information can be useful, since it prevents information overload to the "aware" developer. Some studies [28] analyze the graphical representations that illustrate changes over UML class diagrams, besides presenting results of an empirical study that determines strong and weak points of these representations. These studies indicate that textual change representations (who changes, what is changed, when it changes) are the ones that have greater impact among developers. The MAIS approach uses textual change representation, as described in the next section.
3. Design MAIS approach involves an awareness mechanism that uses changes made on shared software models as awareness information. It collects, distributes and presents this information to developers that are interacting on a shared software model. By using MAIS, developers interact in a multisynchronous mode to manipulate shared software models, offering to developers an independent way of working. The contributions over a shared model are done by each developer's local copy. So, it is possible to manipulate this artifact in a concurrent way. MAIS mechanism is meant to be used before the convergence phase [29] of the shared model copies into a global one, stored in a central repository. The individual contributions over the shared model are propagated to all developers, offering an overall view of what is being done, which can be useful to make a global “conscience” of the shared model. This can help developers on the convergence phase, since conflicts can be avoided by using this kind of information. We assume that the convergence of the
shared model copies occurs when developers wish to check-in their changes. The MAIS specification is not dependent of a modeling tool; it is a reusable software component [11] that can be coupled to various CASE editors or software environments. However these tools must satisfy some basic extensibility requirements, for instance, to provide an extensibility API. The modeling tool must also have a notification mechanism about fine grained model changes. Contributions over the shared model generate the awareness information, which are represented using an event metaphor. It brings the idea of event notification systems [22] [8] [6], where developers register themselves on the collaboration to be notified when a certain event (some contribution over the shared model) occurs. For each event occurrence, this awareness information is distributed to all developers that are registered. The awareness information is collected using a sensor mechanism [22], which is associated to some particular model elements. These sensors are installed on the modeling tool and capture change information, forwarding them to the MAIS mechanism that broadcasts it. The event concept is implemented using the 5W+1H concept: an event is described by an action (How) over a shared model (Where) element (What). These actions are done by a developer (Who) in a certain period of time (When). MAIS events also describe relevancy relations; events related to changes in composite elements are grouped in a single event. Grouping Events The change information can be manipulated to highlight some “hidden” characteristics about the interactions over the shared model. It is useful to help developers on doing their model contributions, because this enriches their knowledge about the context where the interaction occurs. Grouping events by a characteristic (for example, by developer) makes it possible to observe where actions (represented by events) are located over the shared model. For example, let us consider a UML class model as the shared model presented in Figure 1. Grouping change information of a specific UML class by developer can lead us to infer how much each developer knows about each class, i.e., the volume of changes can indicate the developer’s knowledge about the class. Ranking Events
Apart from grouping events by some characteristics, it is interesting that developers are provided with information about events that are important to their work. An event ranking can be established with this goal. A value can be attributed to each event to determine its importance for a given developer. Thus, MAIS introduces the event relevance concept. It aims to measure how important some kind of event is to a developer by analyzing other past events. This value, called Relevance degree (Gr), related to the event "e" for "D", is calculated by applying the following formula: Gr(e,D) = Er(e,D)/Eg(D)*100 where "Er" represents the amount of events that a developer "D" generated, relative to a shared model element "e"; and "Eg" is the total amount of events generated for "D". For example, in a shared UML class model, if a "D1" developer has generated 40 change events, being 5 of these related to the "C" class, events which involve the "C" class (element) have a relevance degree of 12.5% for "D1". Filtering Events Finally, developers do not want to spend too much time searching for relevant events, since their work flow can be negatively influenced by long duration searches. The grouping and relevance concepts should help to reduce the number of events that each developer has to analyze. However, the amount of events grouped by category can become very large. It is reasonable to imagine that many of these events may have been noticed by developers during the session and it might not be productive to show them again. Thus, event filtering can attenuate the overload problem. MAIS mechanism does event filtering driven by a certain criteria, which is defined at the design phase of the mechanism implementation. The event aware information concept indicates the event existence information noticed by a developer. As such, events can be marked as "aware". This developer's "aware state" can be used to infer the knowledge of others about the contributions (I know that you know/don't know) [5].
4. Implementation MAIS prototype was implemented as part of the OdysseyShare Environment [21], using the Java
platform. The prototype uses a tuple space [4], which stores the generated events. This tuple space works as a shared workspace. The prototype uses UML class model as the shared software model. Figure 2 presents MAIS event model. The event concept implementation consists of an action ("Event" abstract class) combined with a model element ("Element" abstract class). The supported actions are: (i) register itself on the interaction ("Register" class); (ii) create ("Create" class); (iii) delete ("Delete" class); and (iv) modify ("Update" class) a model element. When an element is modified, “Change” class represents the changes over this model element. The supported UML class model elements are: (a) class, (b) attribute, (c) method, and (d) relationship.
environment or CASE tools in the following way: the environment/tool must provide some API that reflects the supported changes on a certain shared model (for example, an element creation) and it is necessary to register MAIS to listen to these events. Thus, when a change is made on the shared model, the environment/tool notifies MAIS about this event. The events are presented to developers as text messages, describing the event that generated it, and the model elements affected by the event. The events are presented in two lists, depending on who generated them. Events generated by the current developer are presented in the left hand side list, while events generated by others are presented in the right hand side list (Figure 3).
5. Observation Study
Figure 2. MAIS event model The tuple space works as a repository of events; objects are stored, removed and searched in this space. This is installed in some network node, accessible to all developers through the mechanism. When an interaction over the shared model begins, the developers register themselves on the mechanism, to be notified when the objects are stored in the tuple space. GigaSpaces server [10] is the used implementation of JavaSpaces specification [14], which is an application of the tuple space concept. When new events are created, developers are notified and are able to retrieve them from the tuple space.
Figure 3. Presentation of generated events As mentioned in the previous section, MAIS prototype is coupled to a software development
Since the awareness concept is associated to an individual’s mental state [26], it is important to observe the usage of MAIS prototype. This observation can provide information about the mechanism applicability in a given scenario, identifying deficiencies and new requirements. This section presents a qualitative observation study about MAIS prototype use [30]. This empirical study consists on observing its use within a collaborative modeling session, registering data related to aspects such as user’s satisfaction on using the prototype, improvements suggested by users, and so on. This preliminary study does not aim to test hypothesis; we aim to perform a exploratory study. It is assumed that all developers are working on the same version of a shared model. It is important to highlight that it is not a prototype goal to generate a consistent global state of the shared model. It only provides the information about generated changes, which is used by developers to guide their changes over the model copies. All MAIS users have the same role (i.e., developer). There is no coordinator/moderator role; individuals make contributions over the shared model trying to generate a consistent version, discussing and deciding how changes can be implemented. The empirical study’s objective is described below, following the structure presented in [30]: Analyze the MAIS mechanism in an informal concurrent modelling activity, related to changes made in a shared model. Intending to characterize the mechanism usefulness, referring to users’ satisfaction in using it and task applicability. Regarding satisfaction with the performance and efficiency in modeling activities.
In the developer's point of view. Within the OdysseyShare environment context. For the study enactement, ten volunteers were invited. Four of them are computer science undergraduate students at the Federal University of Rio de Janeiro (UFRJ). The other six are Systems Engineering and Computer Science graduate students at UFRJ. Only one volunteer had previous experience in using OdysseyShare environment. All volunteers have some experience in object-oriented modeling. However, no volunteer had previous experience with the MAIS prototype. The instruments used to execute the study were adapted from [17] and involve: (i) a commitment term; (ii) two questionnaires, to be answered by participants; and (iii) a document describing the task, distributed to each participant. All volunteers used OdysseyShare environment (v.1.6.0) to execute the task. Four volunteers were selected to use this environment version combined with the MAIS prototype (v. 1.1.0). Two volunteers’ sessions were used to calibrate the study execution. The following steps summarizes study: (i) each participant signs the commitment document; (ii) they answer the characterization questionnaire; (iii) they read the task description; (iv) if necessary, they listen to an oral explanation of MAIS prototype or OdysseyShare usage; (v) they accomplish the task, and (vi) they fill in the task accomplishment questionnaire. The study task consists of a concurrent software modeling session of a UML class model, where two developers interact over the model at the same time. Each one has some activities to do, and when they finish, a meeting is established to merge their contributions. The document that describes the task presents a brief description of the model elements. The used model was derived from MAIS event representation class model. Two groups of sessions were organized: (i) one with developers that used the prototype, and (ii) a control group without the prototype support. Each pair of developers received the same version of the shared UML class model. In both cases, the changes were made using OdysseyShare environment. Each participant reads the instructions described in the task description document. A verbal explanation about the prototype purpose is done for those who use it. Participants act as developers, interacting concurrently over the shared class model. Changes are registered using the event metaphor, as previously described.
Preliminary Analysis After group (i) session (i.e., MAIS users), an informal meeting was taken to discuss some general points related to the prototype. All volunteers indicated that the prototype should notify them when an important event occurs. They suggested that an important event should call the user’s attention (e.g., blink on the computer screen). This characteristic would remind developers to turn to MAIS interface to observe the shared model evolution. They found the approach very useful, in the sense of situating the possible “conflict areas” on the shared model, concentrating their attention to the classes that they are working with. The same procedure (i.e, an informal meeting after study execution) was taken to the group that didn’t use the MAIS prototype. Due to the task simplicity, the volunteers didn’t externalize the need of a tool to support the task execution. The generated conflicts were reasonable treated by using the OdysseyShare environment alone. Based on the data collected during the informal meetings, the study has demonstrated some points for improvements regarding the prototype: (i) the critical changes for some developer must be highlighted, possibly by playing a sound alarm or blinking on the computer screen as suggested by some participants; (ii) the questions must be revised, in terms of bias that was detected in some points. For example, when the volunteers answer the questions related to the proposed task, they unintentionally give high grades for them. Finnally, (iii) the task should be improved to provide more conflicts betweens copies of the shared model. The number of occurrences and the complexity of the presented conficts turned out to be easy for the execution of the task with or without the MAIS support.
6. Conclusion This paper described the isolation problem among distributed developers that share software models, in particular, UML-based models. In the CSCW research field, the awareness concept is presented as the basis for a technique that is meant to reduce this isolation. To make it possible, change state information related to a shared model is propagated through awareness mechanisms to developers who interact over it. Awareness support is present in groupware tools. However, the task support offered by general groupware is not as complete as the one found in similar single-user applications [16]. Changing a
single-user modeling tool for an equivalent groupware can cause a negative effect in the productivity and the satisfaction of developers. Also, the learning curve for using new tools can be inadequate to the team‘s expectation. This paper proposed an awareness mechanism for change identification on shared models, and a corresponding prototype named MAIS. Both were developed to be general purpose, not being restricted to a specific modeling tool. The kind of models supported by the mechanism is represented using UML notation. The MAIS awareness mechanism monitors contributions made in the local workspace of each user. It is non-obtrusive, using an event metaphor [22] to propagate this information to every developer involved. The information overload characteristic is considered when change information is presented. MAIS mechanism is able to identify local changes that were not yet committed in the central version control repository. The developers are notified in cases of potential modeling conflicts, enabling preventive actions [24]. Three procedures are considered by MAIS mechanism to present the shared model evolution information: (i) classification, (ii) grouping, and (iii) filtering of events. Filters are established to reduce information overload related to changes on shared software model. The mailbox metaphor is applied in this procedure. Events already processed by the enduser are presented in a different area of the user interface. Another concept adopted in filtering is the “awareness of awareness”. The event processing information can be accessed by the other developers. New actions can be driven according to this kind of information. One of the main contributions of this paper is the design and implementation of an independent and nonobtrusive mechanism that collects and distributes change information related to copies of a shared software model. The collected events are available to be used by other tools, being possible to do some data analysis outside the mechanism. The use of software models allows to detect inconsistencies in initial phases of the software lifecycle, especially when these models are described in a well-formed language such as UML. The relevance and change aware information is obtained in the interaction process over a shared model, not impacting the developer's workflow. The observation study highlights the importance of notifing developers about changes. This can be done by using some kind of alarm. This feature was reported by all developers, because sometimes they “forget” the existence of the tool. MAIS prototype behaves as
expected, offering a global notion of contributions over the shared model and identifying the critical “pieces” of the shared model that each developer works on. As future work, we consider the need of exploring new ways of awareness information presentation, representing the evolution of the shared model. There is the need to complete our work by searching for some patterns of change information that could be useful on the detection of conflicts and decision making. These patterns can help the identification of a non explicit ability of a team member and provision of information about productivity and quality of the produced artifacts. Some kind of automation for conflicts detection needs to be designed and implemented. A case study must be applied in an industrial setting. We also realized that it is necessary to review the proposed task in order to have more conflicts situations, to observe the prototype behavior in this context. A quantitative approach will be adopted in a next version of this study, and training on the modeling tool will be prepared.
7. References [1] ALTMANN, J., POMBERGER, G., 1999, "Cooperative Software Development: Concepts, Model and Tools" Proceedings of the Technology of Object-Oriented Languages and Systems, pp. 194-209, Santa Barbara, California, United States, August. [2] ARAÚJO, R. M., 2000, “Extending the Software Process Culture - A Groupware and Workflow-Based Approach”, DSc. Thesis, COPPE-UFRJ, Rio de Janeiro, RJ, Brazil. [3] BOULILA, N., DUTOIT, A. H., BRUEGGE, B., 2003, "D-Meeting: an Object-Oriented Framework for Supporting Distributed Modeling of Software" International Workshop on Global Software Development, International Conference on Software Engineering, pp. 34-38, Portland, Oregon, United States, May. [4] CARRIERO, N., GELERNTER, D., 1989, "Linda in context", Communications of ACM, v. 32, n. 4, pp. 444-458. [5] DAVID, J. M. N., BORGES, M. R. S., 2001, "Selectivity of Awareness Components in Asynchronous CSCW Environments". In: Proceedings of 7th International Workshop on Groupware (CRIWG 2001), pp. 115-124, Darmstadt, Germany, September. [6] DE SOUZA, C. R. B., BASAVESWARA, S. D., REDMILES, D. F., 2002, "Supporting Global Software Development with Event Notification Servers". In: Proceedings of 24th International Conference on Software Engineering, International Workshop on Global Software Development, pp. 9-13, Orlando, Florida, United States, May. [7] DOURISH, P., BELLOTTI, V., 1992, "Awareness and coordination in shared workspaces" Proceedings of the 1992 ACM conference on Computer-supported cooperative work, pp. 107-114, Toronto, Ontario, Canada.
[8] FARSHCHIAN, B. A., 2001, "Integrating geographically distributed development teams through increased product awareness", Information Systems., v. 26, n. 3, pp. 123-141 [9] FROEHLICH, J., DOURISH, P., 2004, "Unifying Artifacts and Activities in a Visual Tool for Distributed Software Development Teams". In: Proceedings of 26th International Conference on Software Engineering, pp. 387396, Edinburgh, United Kingdom, May. [10] GIGASPACES, 2006, "Gigaspaces Grid Server". In: http://www.gigaspaces.com/docs/doc/index.htm, Accessed in 22/04/2006. [11] GRUNDY, J., HOSKING, J., 2002, "Engineering plugin software components to support collaborative work", Software: Practice and Experience, v. 32, n. 10, pp. 9831013 [12] GUTWIN, C., GREENBERG, S., 2001, "A Descriptive Framework of Workspace Awareness for Real-Time Groupware", Computer Supported Cooperative Work, v. 11, pp. 411-446, Kluwer Academic Publishers. [13] HERBSLEB, J. D., MOITRA, D., 2001, "Guest Editors' Introduction: Global Software Development,", IEEE Soft., v. 18, n. 2, pp. 16-20, IEEE Computer Society Press. [14] JAVASPACES, 2006, In: http://java.sun.com/developer/Books/JavaSpaces. Accessed in 22/04/2006. [15] KOBYLINSKI, R., CREIGHTON, O., DUTOIT, A., et al., 2002, "Building awareness in global software engineering: using issues as context" International Workshop on Global Software Development, pp. 18-22, Orlando, Florida, United States. [16] LI, D., LI, R., 2002, "Transparent sharing and interoperation of heterogeneous singleuser applications". In: Proceedings of the 2002 ACM Conference on Computer Supported Cooperative Work, pp. 246-255, New Orleans, Louisiana, United States. [17] MANGAN, M. A. S., ARAÚJO, R. M., KALINOWSKI, M., et al., 2002, "Towards the Evaluation of Awareness Information Support Applied to Peer Reviews". In: Proceedings of 7th Conference on Computer Supported Cooperative Work in Design (CSCWD´2002), pp. 49-54, Rio de Janeiro, Brazil, September. [18] MANGAN, M. A. S., BORGES, M. R. S., WERNER, C. M. L., 2004, "Increasing Awareness in Distributed Software Development Workspaces". In: Proceedings of 10th Groupware: Design, Implementation, and Use, v. 3198, pp. 84-91, San Carlos, Costa Rica, September. [19] MEIRE, A., BORGES, M. R. S., ARAÚJO, R. M., 2003, "Supporting Collaborative Drawing with the Mask Versioning Mechanism". In: Proceedings of 9th Groupware: Design, Implementation, and Use (CRIWG 2003), v. 2806, pp. 208- 223, Autrans, France, September. [20] MOLLI, P., SKAFA-MOLLI, H., OSTER, G., et al., 2002, "SAMS: Synchronous, Asynchronous, Multi-
Synchronous Environments". In: Proceedings of 7th International Conference on Computer Supported Cooperative Work in Design (CSCWD 2002), pp. 80-84, Rio de Janeiro, RJ, Brazil, October. [21] ODYSSEY, 2006, "OdysseyShare Project". In: http://reuse.cos.ufrj.br/odyssey, Accessed in 22/04/2006. [22] PRINZ, W., 1999, "NESSIE: an awareness environment for cooperative settings". In: Proceedings of the 6th European Conference on Computer Supported Cooperative Work, pp. 391-410, Copenghagen Denmark. [23] ROSA, M. G. P., BORGES, M. R. S., SANTORO, F. M., 2003, "A Conceptual Framework for Analyzing the Use of Context in Groupware". In: Proceedings of 9th Groupware: Design, Implementation, and Use, v. 2806, pp. 300-313, Autrans, France, October. [24] SARMA, A., NOROOZI, Z., VAN DER HOEK, A., 2003, "Palantír: raising awareness among configuration management workspaces". In: Proceedings of 25th International Conference on Software Engineering (ICSE), pp. 444-454, Portland, Oregon, United States, May. [25] SCHÜMMER, T., SCHÜMMER, J., 2001, "Tools for XP Development - Support for Distributed Teams in eXtreme Programming". In Succi, G. and Marchesi, M.,eXtreme Programming Examined, Addison Wesley. [26] SOHLENKAMP, M., 1998, Supporting Group Awareness in Multi-User Environments through Perceptualization, Msc Dissertation - Fachbereich Mathematik, Informatik der Universität - Gesamthochschule - Paderborn. [27] TAM, J., GREENBERG, S., 2004, "A Framework for Asynchronous Change Awareness in CollaborativelyConstructed Documents". In: Proceedings of 10th Groupware: Design, Implementation, and Use, v. 3198, pp. 67-83, San Carlos, Costa Rica, September. [28] TAM, J., MCCAFFREY, L., GREENBERG, S., 2000, Change Awareness in Software Engineering Using Two Dimensional Graphical Design and Development Tools. Report 2000-670-22, Department of Computer Science, University of Calgary, Alberta, Canada. [29] VIDOT, N., CART, M., FERRIÉ, J., et al., 2000, "Copies convergence in a distributed real-time collaborative environment". In: Proceedings of the 2000 ACM Conference on Computer Supported Cooperative Work, pp. 171180,Philadelphia, Pennsylvania, United States. [30] WOHLIN, C., RUNESON, P., HÖST, M., OHLSSON, M.C., REGNELL, B., WESSLÉN, A., 2000, Experimentation in Software Engineering: an Introduction, Kluver Academic Publishers, Norwell, Massachusets. [31] ZAFFER, A., SHAFFER, C., EHRICH, R., et al., 2001, NetEdit: A Collaborative Editor. Report TR-01-13, Computer Science, Virginia Tech, United States.
Exploring Coordination Structures in Open Source Software Development
Chintan Amrit, J.H. Hegeman and Jos Van Hillegersberg University of Twente, The Netherlands {c.amrit, j.h.hegeman, j.vanHillegersberg}@utwente.nl,
Abstract Coordination is difficult to achieve in a large globally distributed project setting. The problem is multiplied in open source software development projects, where most of the traditional means of coordination such as plans, system-level designs, schedules and defined process are not used. In order to maintain proper coordination in open source projects one needs to monitor the progress of the FLOSS project continuously. We propose a mechanism of display of SocioTechnical project structures that can locate the coordination problems in open source software development. Using the tool TESNA (TEchnical and Social Network Analysis) that we have developed; we cluster the software and produce a display of the different software clusters as well as the people working on its constituting software classes. We then demonstrate the technique on a sample FLOSS project that is on the brink of becoming inactive.
forge, only 12.24% of the projects had attained stable status (has a stable version of their software) when we last checked in July 2007. For an IT professional or FLOSS project leader it seems to be crucial to know the status of the open source project in order to contribute or recommend the project [4]. To this extent we provide a set of STSCs which can be checked in order to see the coordination inconsistencies of the work being done in an FLOSS project. deSouza et al recognize socio-technical patterns of work assignment among the open source community members [7]. In this paper, we extend this research further by identifying socio-technical coordination problems, what we call Socio-Technical Structure Clashes or STSCs [8] based on some of these patterns. We provide a theoretical framework along with a technique for the identification of such STSCs. We then show the occurrence of the FLOSS STSCs in one open source project called JAIM, in order to demonstrate the technique.
1. Introduction
2. OSS Community Structure
Distributed self-organizing teams develop most Free/Libre Open Source Software (FLOSS). Developers from all over the world rarely meet face to face and coordinate their activity primarily by means of computer-mediated communications, like e-mail and bulletin boards [1, 2] . Such developers, users along with the associated user turned developers of the software form a community of practice [3]. The success or failure of open source software depends largely on the health of the health of such open source communities [4, 5]. Most of the literature on open source software development attests its success and only a relatively small but growing number of empirical studies exist that explain how these communities actually produce software [2, 6, 7]. Also, not everything is ok with open source development projects. Out of 153579 projects registered in source
Although there is no strict hierarchy in open source communities, the structure of the communities is not completely flat. There does exist an implicit role based social structure, where certain members of the community take up assume certain roles by themselves based on their interest in the project [3]. According to Crowston and Howison a healthy open source community has the structure as shown in Figure 1 with distinct roles for developers, leaders and users. Core Developers: Core developers are responsible for guiding and coordinating the development of a FLOSS project. These developers are generally involved with the project for a relatively long period, and make significant contributions to the development and evolution of the FLOSS system.
Figure 1: A healthy open source community (taken from [4]). In those FLOSS projects that have evolved into their second generation there exists a council of core members that take the responsibility of guiding development. Such a council replaces the single core developer in second-generation projects like Linux, Mozilla, Apache group etc. Project Leaders: The Project Leader is generally the person responsible for starting the FLOSS project. This is the person responsible for the vision and overall direction of the project. Co-developers: Also known as peripheral developers, occasionally contribute new features and functionality to the system. Frequently, the core developers review their code before inclusion in the code base. By displaying interest and capability, the peripheral developers can move to the core. Active Users: Active users contribute by testing new releases, posting bug reports, writing documentation and by answering the questions of passive users. Each FLOSS community has a unique structure depending on the nature of the system and its member population. The structure of the system differs on the percentage of each role in the community. In general, most members are passive users, and most systems are developed by a small number of developers [2].
3. STSCs in FLOSS projects A Socio-Technical Structure Clash (STSC) occurs if and when a Socio-Technical Pattern exists that indicates that the social network of the software development team does not match the technical dependencies within the software architecture under development. STSCs are indicative of coordination
problems in a software development organization. Some of these problems (or STSCs) concerning development activities have been collected and described by Coplien et al. including a set of what they call Process Patterns to deal with these coordination problems. As the term process patterns is also used in business process management and workflow, we prefer to use the term Socio-Technical Patterns to refer to those patterns involving problems related to both the social and technical aspects of the software process [8]. de Souza et al. identify the following 2 socio-technical patterns by mining software repositories [7]:
Core Periphery Shifts: In a healthy FLOSS project the peripheral developers more from the periphery of the project to the core, as their interest and contribution in the project increases [4, 7, 9] Code Ownership: In a healthy FLOSS project, the ownership of important code changes from a group of developers to one single developer [7, 10]
Therefore, the STSCs based on these SocioTechnical Patterns would be: 1. 2. 3.
If the developers in the periphery do not move towards the center core If the developers in the core move to the periphery of the project If the ownership of important modules are shared by a large group of developers with no developer taking sole responsibility
From now on, we would refer to these STSCs as FLOSS STSC 1, 2 and 3 respectively.
4. Detection of STSCs in FLOSS In order to detect STSCs related to FLOSS projects we used a clustering algorithm based on the algorithm by Fernandez [11] and later on used by MacCormack et al.[12]. We implemented this algorithm (see Appendix) to cluster the software components into 10 clusters, in such a way that the clustered cost given by:
Figure 2: Class clustering of the JAIM software
5. Empirical Data was less than one. The resulting software clusters were as shown in Fig 2. We then included the author information of the components (extracted from the project’s software repository (SVN)) in the same diagram and displayed the authors of the individual code modules as authors of the respected clusters (in which the code modules lay), as seen in Fig 4. As this clustering method is based on the dependencies between, the software components, the central cluster would represent the most dependent components of the software, or in other words the software core. Thus, the structure of the clustered software graph would represent the actual core and periphery of the software architecture. It has to be noted that this break up of core and periphery is based on software dependencies and could be different from that which was designed (especially in commercial software development, which generally follows traditional process of designing, developing and testing cycles). In this paper we trace the co-evolution of the project and the communities [9] and show the method of detecting FLOSS related STSCs by looking at the author-cluster figure (Fig 4-7) at equal intervals in the development lifetime of the project.
In order to show the occurrences of the three STSCs we searched Sourceforge and selected a project called JAIM. The reason behind selecting JAIM was that it has a low activity percentage for the last year, and has no write activity in the repository (SVN) after 2006 (Fig 3). The public forums had 4 messages of which two were welcome messages. The mailing lists were empty. So were the Bug reports, support requests, patches and feature requests. This lack of activity showed that the project was heading towards becoming inactive. Therefore, we wanted to investigate the task structures over the period of the project, and see if we can find the three STSCs in this project. TESNA can only display the dependencies between java modules, hence any of the .html documentation or java script files cannot be seen in the class cluster displays. Therefore, developers working on any of the non-java files will appear to be unconnected in the author-cluster displays. The software releases did not change the dependencies between the components in the releases 3 through 10, so the call graph and consequently the cluster graph of the software remained the same. So we just had to add the changed
Figure 3: Subversion activity of JAIM (taken from Sourceforge) file(s) is not in java, it’s an .html or java script file which would mean that root is a peripheral or coauthor information in the TESNA tool in order to get developer for this revision. the picture of which author was changing which From figure 4 to 7, we see the occurrence of FLOSS module, belonging to the particular cluster. STSC 1 (section 2) as the peripheral developer root does not move to the core. 6. Discussion 1
Using the tool TESNA that we have developed we generated the author-cluster diagrams. We analysed the various write revisions in the repository (SVN) in order to detect STSCs mentioned in section 3. The latest revision of the project was 10, so we analysed revisions at equal intervals namely revisions 3, 5, 7 and 10. We have used TESNA to analyse the author-cluster diagrams qualitatively. We think approach is best suited in detecting such STSCs. The first thing we notice in the author-cluster diagrams is that only 3 developers contributed to the development in the revisions 3, 5, 7 and 10 we observed namely, coolestdesignz, root and dingercat though 6 developers were listed as the developers in the project had 6 developers listed. Of these developers coolestdesignz is listed as the project administrator. In revision 3 (Fig 4), we notice the developer coolestdesignz altering files in the core cluster 3 and the peripheral cluster 6. The developer root is also visible but is not visible changing any file in any cluster in the diagram as he/she would have changed/contributed to a non-java file. Since the
1
http://tesnatool.googlepages.com
We notice FLOSS STSC 2 as core cluster developers coolestdesignz and dingercat move to the peripheral region, as coolestdesignz disappears after revision 3 (Fig 4), while dingercat moves from being a core developer to being a co-developer in revision 10 (Fig 7). FLOSS STSC 3 can be seen between revisions 3 and 5 (Fig 4 and 5) where coolestdesignz as well as dingercat modify the core cluster with no single developer responsible for the modules in the core cluster.
Figure 4: Class Clusters along with Author information for revision 3
Figure 5: Class Clusters along with Author information for revision 5
Figure 6: Class Clusters along with Author information for revision 7
Figure 7: Class Clusters along with Author information for revision 10
7. Conclusion In this paper, we have tried to come up with STSCs based on FLOSS literature. We have showed a
technique (a clustering based display mechanism) that can be used to detect STSCs in FLOSS projects. We have tried to demonstrate this technique by detecting STSCs in an open source project JAIM. The project JAIM is in the beta stage of development and has all the signs of joining the ranks of an inactive project in the Sourceforge database. Through the detection of STSCs, we plan to inform the project leader (of JAIM for example) as well as potential interested developers on the health of the open source project. Though, there are other ways of detecting the health of an open source community [4, 5], the techniques they use do not display the actual task allocation of the FLOSS project.
In this paper, we display a technique using the actual mining of data from the code repositories to see the actual contributions of the developers. The greater the number of STSCs found in the project the worse would be its health. Future work could involve the identification and detection of many more STSCs in different open source projects enabling project managers to manage the FLOSS development process in a better way.
9.
References 1.
2.
3.
4.
5.
6.
7.
8.
Raymond, E., The Cathedral and the Bazaar. Knowledge, Technology, and Policy, 1999. 12(3): p. 23-49. Mockus, A., R.O.Y. T Fielding, and J. D Herbsleb, Two Case Studies of Open Source Software Development: Apache and Mozilla. ACM Transactions on Software Engineering and Methodology, 2002. 11(3): p. 309-346. Ye, Y. and K. Kishida, Toward an Understanding of the Motivation of Open Source Software Developers. 2003. p. 419429. Crowston, K. and J. Howison, Assessing the Health of Open Source Communities. 2006, IEEE Computer Society Press Los Alamitos, CA, USA. p. 89-91. Crowston, K., H. Annabi, and J. Howison, Defining Open Source Software Project Success, in International Conference on Information Systems. 2003. Yamauchi, Y., et al., Collaboration with Lean Media: how open-source software succeeds. 2000, ACM Press New York, NY, USA. p. 329-338. de Souza, C., R. B., J. Froehlich, and P. Dourish, Seeking the source: software source code as a social and technical artifact, in GROUP '05: Proceedings of the 2005 international ACM SIGGROUP conference on Supporting group work. 2005: New York, NY, USA. p. 197--206. Amrit, C. and J. Hillegersberg, Mapping Social Network to Software Architecture to Detect Structure Clashes in Agile Software Development, in 15th European Conference of Information Systems. 2007.
10.
11.
12.
Ye, Y. and K. Kishida. Toward an understanding of the motivation Open Source Software developers. in 25th International Conference on Software Engineering. 2003: IEEE Computer Society Washington, DC, USA. Coplien, J., O. and N. Harrison, B. , Organizational Patterns of Agile Software Development. 2004: Upper Saddle River, NJ, USA. Fernandez, C.I.G., Integration Analysis of Product Architecture to Support Effective Team Co-location. 1998, MIT: Boston, MS. MacCormack, A., J. Rusnak, and C.Y. Baldwin, Exploring the structure of complex software designs: An empirical study of open source and proprietary code. Management Science, 2006. 52(7): p. 1015-1030.
Appendix Clustering Algorithm: clusters findClusters (param inputDSM) { Set clusters = one cluster for each module; int cost = calculate initial total cost; int failedattempts = 0; Do { m = a random module from inputDSM; For every element c from clusters { calculate bid of c for m; } cmax = highest bidding cluster; best_bid = bid from cmax; If (best_bid > 0) { Reassign m to cmax; For every element c from clusters { If (c is empty) remove c; } cost = cost – best_bid; failedattempts = 0; } else { failedattempts++; } } while (failedattempts