Development of a statistical model for discrimination of rupture status in posterior communicating artery aneurysms Felicitas J. Detmer, Bong Jae Chung, Fernando Mut, Michael Pritz, Martin Slawski, Farid Hamzei-Sichani, David Kallmes, et al. Acta Neurochirurgica The European Journal of Neurosurgery ISSN 0001-6268 Acta Neurochir DOI 10.1007/s00701-018-3595-8
1 23
Your article is protected by copyright and all rights are held exclusively by Springer-Verlag GmbH Austria, part of Springer Nature. This eoffprint is for personal use only and shall not be self-archived in electronic repositories. If you wish to self-archive your article, please use the accepted manuscript version for posting on your own website. You may further deposit the accepted manuscript version in any repository, provided it is only made publicly available 12 months after official publication or later and provided acknowledgement is given to the original source of publication and a link is inserted to the published article on Springer's website. The link must be accompanied by the following text: "The final publication is available at link.springer.com”.
1 23
Author's personal copy Acta Neurochirurgica https://doi.org/10.1007/s00701-018-3595-8
ORIGINAL ARTICLE - VASCULAR NEUROSURGERY - ANEURYSM
Development of a statistical model for discrimination of rupture status in posterior communicating artery aneurysms Felicitas J. Detmer 1 & Bong Jae Chung 1 & Fernando Mut 1 & Michael Pritz 1,2 & Martin Slawski 3 & Farid Hamzei-Sichani 4 & David Kallmes 5 & Christopher Putman 6 & Carlos Jimenez 7 & Juan R. Cebral 1 Received: 3 April 2018 / Accepted: 11 June 2018 # Springer-Verlag GmbH Austria, part of Springer Nature 2018
Abstract Background Intracranial aneurysms at the posterior communicating artery (PCOM) are known to have high rupture rates compared to other locations. We developed and internally validated a statistical model discriminating between ruptured and unruptured PCOM aneurysms based on hemodynamic and geometric parameters, angio-architectures, and patient age with the objective of its future use for aneurysm risk assessment. Methods A total of 289 PCOM aneurysms in 272 patients modeled with image-based computational fluid dynamics (CFD) were used to construct statistical models using logistic group lasso regression. These models were evaluated with respect to discrimination power and goodness of fit using tenfold nested cross-validation and a split-sample approach to mimic external validation. Results The final model retained maximum and minimum wall shear stress (WSS), mean parent artery WSS, maximum and minimum oscillatory shear index, shear concentration index, and aneurysm peak flow velocity, along with aneurysm height and width, bulge location, non-sphericity index, mean Gaussian curvature, angio-architecture type, and patient age. The corresponding area under the curve (AUC) was 0.8359. When omitting data from each of the three largest contributing hospitals in turn, and applying the corresponding model on the left-out data, the AUCs were 0.7507, 0.7081, and 0.5842, respectively. Conclusions Statistical models based on a combination of patient age, angio-architecture, hemodynamics, and geometric characteristics can discriminate between ruptured and unruptured PCOM aneurysms with an AUC of 84%. It is important to include data from different hospitals to create models of aneurysm rupture that are valid across hospital populations. Keywords Cerebral aneurysm . Posterior communicating artery . Hemodynamics . Morphology . Rupture . Prediction
This article is part of the Topical Collection on Vascular Neurosurgery Aneurysm Electronic supplementary material The online version of this article (https://doi.org/10.1007/s00701-018-3595-8) contains supplementary material, which is available to authorized users. * Felicitas J. Detmer
[email protected] 1
2
3
Bioengineering Department, Volgenau School of Engineering, George Mason University, 4400 University Drive, Fairfax, VA 22030, USA Department of Bioengineering, University of Utah, Salt Lake City, UT, USA Statistics Department, George Mason University, Fairfax, VA, USA
4
Department of Neurological Surgery, University of Massachusetts, Worcester, MA, USA
5
Department of Radiology, Mayo Clinic, Rochester, MN, USA
6
Interventional Neuroradiology Unit, Inova Fairfax Hospital, Falls Church, VA, USA
7
Neurosurgery Department, University of Antioquia, Medellin, Colombia
Author's personal copy Acta Neurochir
Introduction The posterior communicating artery (PCOM) is a common site for aneurysm development. Aneurysms at this location account for approximately 25% of all intracranial aneurysms [1]. They have a larger rupture risk than aneurysms at other locations [2] such as the middle cerebral artery (MCA) or other segments of the internal carotid artery (ICA) [3, 4]. As such, clinicians often need to decide whether or not to treat PCOM aneurysms, but reliable aneurysm-specific parameters to guide and support these decisions are lacking. Previously published prediction models for aneurysm rupture include the PHASES score [5] and a score developed in Japanese cohorts [6]. Furthermore, a multivariate logistic regression model for discrimination between ruptured and unruptured aneurysms based on hemodynamic and morphological parameters has been presented [7]. The three models were developed from data of aneurysms at different locations. Furthermore, both the PHASES and the Japanese score do not include hemodynamic and morphological information (besides aneurysm size). The multivariate model is based on a comparatively small sample size and has not been validated so far. In a previous study, we found that hostile hemodynamic conditions characterized by strong and concentrated inflow jets, concentrated regions of elevated wall shear stress (WSS), oscillatory WSS, and complex unstable flow patterns were associated with rupture of PCOM aneurysms and that such conditions were more commonly found in bifurcation-
Table 1
type angio-architectures [8]. In the current paper, we extend that prior work by creating and evaluating models that discriminate between PCOM aneurysm rupture status based on numerous demographic, anatomical, geometrical, and hemodynamic features. Once validated in the future with prospective longitudinal data, these models could potentially be used to improve current risk assessment of PCOM aneurysms.
Methods Patient and image data All aneurysms at the PCOM from our database of imagebased cerebral aneurysm models, included in a previous publication [8], were analyzed. Our database includes patient and image data of patients who underwent cerebral angiography. The cohort’s characteristics are summarized in Table 1. There were 300 patients from 6 different hospitals harboring 322 PCOM aneurysms with known rupture status. After exclusion of fusiform aneurysms, infundibula, and one further case because it was the only case in one of our angio-architecture groups (see BStatistical modeling^ sub-section), the sample size was reduced to 289 aneurysms in 272 patients. The overall prevalence of ruptured aneurysms for the 289 aneurysms was 49% (142 ruptured and 147 unruptured). Of the 272 patients, 17 had two PCOM aneurysms (2 ipsilateral, 15 bilateral, see Fig. 1 in the Online Supplementary Material for the
Cohort characteristics
Whole cohort (cases with known rupture status and location; fusiform aneurysms excluded)
Cohort used for this study
Number of patients Number of aneurysms (ruptured/unruptured) Patient age (mean ± SD) (of 1065 patients with known age)
1265 1931 (558/1373) 56.21 ± 13.82
Patients with multiple aneurysms Gender ratio (of 1076 patients with known gender)
358 810 F, 266 M
Number of patients with SAH Distribution by location
558 ACA = 65 (3.37%) ACOM = 278 (14.40%) BA = 136 (7.04%) ICA = 741 (38.37%) MCA = 354 (18.33%) PCOM = 312 (16.16%) VA = 45 (2.33%) 272 289 (142/147) 59.09 ± 14.26 17 193 F, 41 M 161
Number of patients Number of PCOM aneurysms (ruptured/unruptured) Patient age (mean ± SD) (of 232 patients with known age) Patients with multiple PCOM aneurysms Gender ratio (of 234 patients with known gender) Number of patients with SAH
ACA anterior cerebral artery, ACOM anterior communicating artery, BA basilar artery, ICA internal carotid artery, MCA middle cerebral artery, PCOM posterior communicating artery, VA vertebral artery
Author's personal copy Acta Neurochir
ipsilateral cases). The majority of aneurysms in our database came from three contributing hospitals: (1) Mayo Clinic (mayo), (2) Mt. Sinai Medical Center (sinai), and (3) Inova Fairfax Hospital (inova). At these three hospitals, there were 40 PCOM aneurysms out of a total of 256 aneurysms from all locations (16%, mayo), 77 out of 417 (18%, sinai), and 198 out of 1298 (15%, inova). The prevalence of rupture status at the time of presentation of PCOM aneurysms for these hospitals was 41% (mayo), 51% (sinai), and 52% (inova). Unfortunately, patient gender and age information were not available for the mayo cases.
Hemodynamic modeling Patient-specific computational fluid dynamic (CFD) models were constructed from 3D angiographic images [9]. The trunk of the ICA down to the cavernous segment was included in order to appropriately describe the inflow into the aneurysm. Arteries were cut perpendicularly to their axes for subsequent inlet and outlet definition. The vessels were modeled by unstructured grids with a maximum element size of 0.2 mm. For the CFD simulations, pulsatile flow conditions derived from phase-contrast MR measurements in healthy subjects [10] were scaled with a power-law of the inlet vessel area [11] and applied as inflow boundary conditions at the proximal ICA using the Womersley solution [12]. Outflow boundary conditions were set as pressure and flow outlets, consistent with Murray’s law. Blood was modeled as a Newtonian fluid with a density of 1.0 g/cm3 and a viscosity of 0.04 P. Vessel walls were approximated as rigid. The 3D incompressible Navier-Stokes equations were numerically solved with an in-
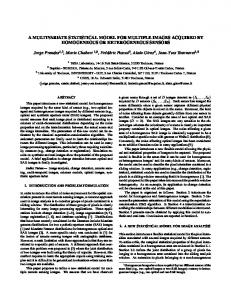
Fig. 1 Illustration of selected shape parameters (NSI, non-sphericity index; BL, bulge location; MLN, mean surface curvature; Awidth, aneurysm width; Aheight, aneurysm height). Top panel: Aneurysms with low
house finite element solver [13]. Two cardiac cycles with a heart rate of 60 beats per minute were computed with 100 time steps per cardiac cycle. For the hemodynamic characterization, results from the second cycle were used.
Post-processing In a post-processing step, hemodynamic and morphological variables previously used to compare hemodynamic conditions in ruptured and unruptured PCOM aneurysms were automatically calculated from the computed flow field and the 3D geometrical model of the aneurysm [14–17]. A total of 22 hemodynamic and 25 geometrical parameters were computed (see Tables 2 and 3 in the Online Supplementary Material as well as Fig. 1 for an illustration of selected shape parameters).
Statistical modeling Prediction models were fitted to the data using logistic group lasso regression [18]. This approach of regularized regression results in models where, depending on the magnitude of a tuning parameter, certain regression coefficients are set to exactly zero. Hence, only variables with a non-zero coefficient are retained in the final model. Since the penalty term of the lasso regression penalizes more complex models (models including more variables), lasso regression can also be used for model fitting in situations where the sample size is comparably small relative to the number of variables [19]. Tenfold cross-validation was used to select the aforementioned tuning parameter. In this step, the data were split in training and validation sets for each of the tenfolds, and the optimization
values of respective variable. Bottom panel: Aneurysms with high values of respective variable. For the definition of all shape parameters see the Online Supplementary Material and the references therein
Author's personal copy Acta Neurochir
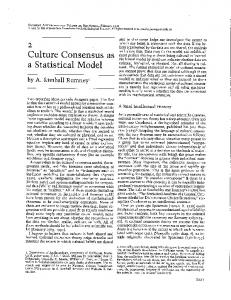
Fig. 2 Illustration of defined angio-architectures. Type 1, True PCOM; Type 2, At ICA-PCOM bifurcation; Type 3, PCOM from fundus; Type 4, PCOM proximal/detached; Type 5, PCOM proximal/attached; Type 6,
No PCOM visible in 3DRA; Type 7, PCOM distal/detached, Type 8, PCOM distal/attached
parameter achieving on average the highest area under the curve (AUC) of the receiver operating characteristic (ROC) curve in the validation set was selected for the final model. All 22 hemodynamic and 25 morphological parameters as well as patient age were used for model fitting. Additionally, patient gender and previously defined angio-architecture classes [8] were included as categorical variables and coded by dummy variables with a sum-to-zero constraint (see Table 1 in the Online Supplementary Material and Fig. 2 for an illustration of the types of angio-architectures). The columns of the feature matrix of the continuous parameters were centered and standardized to unit-norm. The sub-feature matrix for the dummy variables for the angio-architectures was standardized using a singular value decomposition [20]. As only one aneurysm belonged to angio-architecture type 8, this case was excluded for model fitting. Since gender and age were missing from the mayo data, the sample size was reduced to 245 aneurysms for training a Bcomplete model^ including all variables. For this reason, a second model was created omitting these two variables but using the entire sample of 289 aneurysms.
was evaluated. The goodness of fit was visually estimated by means of calibration plots [22]. As part of the visualization, observed outcomes were regressed on the predicted probability using the loess algorithm with a span parameter of 0.75 [23]. First, the model was internally validated by 160 repetitions of tenfold nested cross-validation [24]. For each repetition, the process of model fitting was performed in part of the data (training set) and evaluated on the left-out data (validation set). Based on the evaluation of the fitted models in each of the cross-validation samples, the optimism in the AUC was estimated and subtracted from the AUC for the final model [22]. Moreover, it was noted for how many of the cross-validation samples each of the variables was retained in the fitted models. The relative frequency of retention in the cross-validation models can be seen as an indicator for the importance of a variable. Secondly, for the model excluding patient information, a split-sample approach was used to mimic external validation. Aneurysms of patients from one of the three hospitals with the largest numbers of data were excluded for model fitting and subsequently used for model evaluation. All statistical analysis was performed with scripts written in the R language.
Statistical model evaluation The model’s performance was evaluated as previously described [21]. Briefly, its discrimination for rupture status at presentation and goodness of fit were assessed. Each model’s discrimination was measured by the AUC of the ROC curve. An Boptimal threshold^ for classification was selected as the probability corresponding to the point on the ROC curve with the smallest distance to (0,1). Based on this threshold, the model’s accuracy
Results Complete model The results from the evaluation and validation of the fitted models are summarized in Table 2.
Author's personal copy Acta Neurochir Table 2
Summary of the results for models fitted for subsamples based on hospitals
Model Variables
Hospital excluded
Sample size AUC
AUC nested CV AUC of left-out data Ssize left-out
1
Hem, morph, gender, age, angioarch mayo (missing data) 245
0.8359 0.7547
–
–
2
Hem, morph, angioarch
–
289
0.7920 0.7297
–
–
2a 2b
Hem, morph, angioarch Hem, morph, angioarch
mayo sinai
250 217
0.7679 0.6936 0.7928 0.7361
0.5842 0.7081
39 72
2c
Hem, morph, angioarch
inova
118
0.7933 –
0.7507
168
The column BAUC nested CV^ refers to the AUC of the model after subtracting the estimated optimism by nested cross-validation. The sample size (Ssize) of the left-out data used for evaluation of the models by the split-sample approach is given in the last column Hem hemodynamic variables, morph morphological variables, angioarch angio-architectures
The best discrimination was achieved for the complete model (model 1) including patient information (gender and age) in addition to hemodynamic and morphological parameters, as well as angio-architecture (AUC = 0.8359, after correction for optimism AUC = 0.7547). Based on the ROC, the Boptimal threshold^ for classification of an aneurysm as ruptured or unruptured was 0.46. For this threshold, the sensitivity was 0.84, the specificity 0.73, positive predictive value (PPV) 0.77, negative predictive value (NPV) 0.81, and the misclassification error 0.21. If all aneurysms having a predicted probability greater than the Bdefault threshold^ of 0.5 are classified as ruptured, the specificity increases to 0.76, but the TPR is reduced to 0.78 and the misclassification error increases to 0.23. The PPV remains the same and the NPV decreases to 0.76. Both thresholds are indicated in Fig. 3. The calibration plot for this model (Fig. 3, right) shows a reasonable fit to the data, although the fitted line deviates slightly from the 45° straight line corresponding to perfect goodness of fit. The final model retained the following variables (variables having non-zero coefficients): maximum and minimum wall shear stress (WSS), shear concentration index (SCI), maximum and mean oscillatory shear index (OSI), WSS in the parent vessel (WSSves), peak velocity (Vmax), aneurysm height, width, bulge location (BL), non-sphericity index
Model excluding gender and age The model excluding gender and age (model 2) achieved an AUC of 0.7920 (Table 2). For the Boptimal threshold^ of 0.47, the TPR, FPR, and misclassification error were 0.76, 0.30, and 0.27, respectively. The coefficients for this model are listed in Supplementary Table 4 and the calibration plot in Supplementary Fig. 2 (top left). In contrast to model 1 that includes gender and age for model fitting, the aneurysm neck size (Nsize), the POD entropy describing temporal flow stability (podent), and the volume-to-ostium ratio (VOR) had
0.8 0.6
Outcome
0.0
0.2
0.4 0.0
0.2
0.4
0.6
0.8
1.0
Calibration Plot Model 1
1.0
ROC Curve Model 1 (AUC=0.84)
Sensitivity
Fig. 3 ROC curve (left) and calibration plot (right) for model 1 (complete model). The circle and triangle on the ROC curve indicate the value corresponding to a classification threshold of 0.46 and 0.5, respectively. The circles at the top and the bottom of the calibration plot show the observed data. Observed outcome grouped by deciles is depicted as triangles and represented by the loess smoother with the dashed line. For a perfectly calibrated fit, all triangles and the loess smoother would lie on the 45° line
(NSI), and the mean aneurysm surface curvature (MLN). The coefficients for these variables are listed in Table 4 in the Online Supplementary Material. The relative frequencies of variable retention in the cross-validation samples are presented in Fig. 4. The minimum frequency of all variables having non-zero coefficients in the final model was higher than the maximum frequency of all variables with coefficients of zero (0.44 vs. 0.29, indicated by the black horizontal line in Fig. 4). Among the variables retained in the model, OSImax and NSI had the highest frequency of selection during nested cross-validation (in 100% of the models).
0.0
0.2
0.4
0.6
1−Specificity
0.8
1.0
0.0
0.2
0.4
0.6
Predicted Probability
0.8
1.0
Author's personal copy Acta Neurochir
1.0 0.8 0.6 0.4 0.2
I Vm ax W SS m ax W SS m W in SS ve s
SC
N SI SI m a O SI x m ea n O
BL M LN
ag Ah e e an igh t gi oa rc h. Aw id th
Average Selection in Nested CV
Retained Variables
0.0
Fig. 4 Relative frequency of inclusion of variables in samples from nested cross-validation for variables retained in the final model (top) and variables that dropped out in the process of model fitting (bottom). The definitions of the variables can be found in Tables 2 and 3 in the Online Supplementary Material
1.0 0.8 0.6 0.4
Aa
re a AsAR As iz pe e Avct o co B l re F le n de CR pt h E geGA I nd A G er H LN W R IC IP I R KE M W LS SS M A no AA N rm a N rea di N am s po pod ize de en nu t m Si Q ze R SR Vd VD Vm ia ax m M VE ea n W V SS V O O W m R SS e noan rm
0.2 0.0
Average Selection in Nested CV
Non−Retained Variables
non-zero coefficients, whereas WSSmax, OSImean, and aneurysm height were not retained in model 2.
Effects of patient population To evaluate the effects of different hospital populations, three models excluding gender and age (models 2a, 2b, and 2c) were fitted by omitting data from each of the three hospitals in turn (see Table 2). The sample sizes for each of these models were 250, 217, and 118, respectively. The coefficients for these models are listed in Table 4 in the Online Supplementary Material. Variables that were included in all fitted models (including models 1 and 2) were OSImax and NSI. The model built after omitting the mayo data (model 2a) had an AUC of 0.7679, but when applied to the mayo data that had been left out, the AUC was only 0.5842 indicating reduced discrimination on this external population. In contrast, the models omitting sinai (model 2b) and inova (model 2c) data had AUCs of 0.7928 and 0.7933, respectively; when applying these models to the left-out data, the AUCs were 0.7081 and 0.7507, respectively. The calibration plots for these models when evaluated in the left-out data are presented in Supplementary Fig. 2. These plots indicate a suboptimal fit of model 2a, while reasonably good fits for models 2b and 2c.
Discussion The results of this study suggest that statistical models based on a combination of patient information, angio-architecture, hemodynamics, and geometric characteristics can discriminate between ruptured and unruptured PCOM aneurysms with an AUC of 84%.
Effects of patient’s age and gender In our study, younger age associated with higher rupture risk, consistent with previous studies of PCOM aneurysms [25]. The general association of age and rupture is not clear in the literature. Older age is assigned higher risk in the PHASES score [5] and was associated with higher risk of aneurysm growth in a recent study [26]. However, other studies suggested higher risk for younger patients in anterior communicating aneurysms [27], middle cerebral artery aneurysms [28], and in general [29]. It is known that females have a higher incidence of aneurysms both in general and particularly in those located at the PCOM [30]. The association between gender and risk of aneurysm rupture, however, is not clear in the literature [29, 31]. Our results indicate that considering gender does not improve the discrimination of ruptured and unruptured PCOM aneurysms. Hence, other than gender-related mechanisms seem to be important for aneurysm rupture at this location.
Author's personal copy Acta Neurochir
Effects of angio-architectures Angio-architectures types 1–3 and 5 (true PCOM aneurysms and aneurysms involving the PCOM origin or bifurcation) associated with higher rupture risk, while types 4, 6, and 7 (resembling sidewall aneurysms) associated with lower probability of rupture. The frequency of inclusion of angio-architectures in the nested cross-validation samples was 0.76, indicating that angio-architectures are important for discrimination. To verify this finding, a model was fitted excluding angio-architectures. This model resulted in a reduction of the AUC to 0.8263.
Effects of geometry Holding all other variables fixed, a higher probability of being ruptured was associated with larger bulge location and more elongated shape (less spherical), in agreement with previous studies [32, 33]. In our sample, a higher rupture risk was also associated with smaller aneurysm height and width, in contrast to previous studies suggesting increased rupture risk with increasing PCOM aneurysm size [34, 35]. However, in a previously performed univariate analysis in our data, ruptured PCOM aneurysms were significantly larger compared to unruptured aneurysms, which is consistent with the literature and current clinical knowledge. This finding demonstrates a difficulty when interpreting the association of a variable with rupture in a multivariate model since the corresponding regression coefficient quantifies the change of risk when all other variables are kept constant. In contrast to the model constructed from aneurysms at several locations by Xiang et al. [7], size ratio was not retained in our final model.
Effects of hemodynamics The probability of rupture increased with the mean WSS in the parent vessel and with higher aneurysm peak velocity and maximum WSS and OSI, as well as with lower minimum WSS and mean OSI, suggesting that focalized elevations of WSS and OSI surrounded by lower values may constitute hostile hemodynamic environments that predispose aneurysms to rupture. Lower normalized WSS (WSSnorm) associated with rupture in two previous studies of PCOM aneurysms [34, 36] and in one study including several locations [7]. However, as a result of the modeling fitting process, WSSnorm was not retained in our final model. In the model of Xiang et al. [7], higher mean OSI was associated with higher rupture probability, but in our model, mean OSI was included only in 50% of the nested crossvalidation samples and with a negative association. In contrast, maximum OSI was retained in all models with a positive association, suggesting that this is an important parameter. In one previous multivariate model of PCOM aneurysms based on hemodynamics and morphology [33], the rupture probability increased with the area under low shear (LSA) and inflow
angle, while another study found significant differences in LSA between ruptured and unruptured PCOM aneurysms [36]. In our study, inflow angle was not considered and LSA was not retained in the final model. Figure 5 illustrates the above-discussed finings with four cases. The two unruptured aneurysms at the left have low predicted rupture probabilities (4.7 and 10.8%, respectively, based on model 1). Both of them have an angio-architecture of the lower-risk type 6, a more regular shape, which is also indicated by a low NSI, and are exposed to lower and more regular flow conditions characterized particularly by a lower maximum OSI (see Table 3). In contrast, the two ruptured aneurysms at the right have predicted probabilities of 86.4 and 97.7%, respectively. They have a type 2 angio-architecture, which is associated with a higher rupture risk. Moreover, they are more complex in shape and exposed to higher flow conditions.
Model evaluation Before applying a prediction model in clinical practice, internal and external validations of the model are essential. In this study, models were internally validated using nested crossvalidation and a split-sample approach to mimic external validation. The results from the cross-validation suggested that the retention of variables for the fitted models is reasonably stable with respect to small changes in the data. The results of the split-sample approach showed that the discrimination power of the models was reduced when applied to the left-out data, especially for the mayo data. This suggests that differences in the hospital populations may affect the performance of the models when applied to a different population, and that in particular, the mayo population may be different from the inova and sinai populations. In fact, the overall rupture prevalence (including all locations) of our inova and sinai datasets is 31% which is significantly different (p = 0.002, chi-squared test) from 21% for the mayo dataset. When restricted to PCOM aneurysms, the rupture prevalence were 52% for inova, 51% for sinai, and 41% for mayo. However, these differences were not statistically significant, most likely due to the small sample size of the mayo PCOM dataset. These differences may reflect the different admission and referral practice patterns at different hospitals. These findings indicate that it is important to include data from different hospitals to create generic statistical models of aneurysm rupture that are valid across populations. Compared to a previously developed model by Xiang et al. [7] as well as univariate models only using aneurysm size or NSI, the model’s discrimination was remarkably higher (see Fig. 6). This result indicates that applying the model could have additional value over using only aneurysm size, NSI for quantifying shape complexity, or the model reported in [7] when deciding on treatment of an unruptured aneurysm. Furthermore, when applying a recently developed model for aneurysms at various locations [21] to the PCOM cohort
Author's personal copy Acta Neurochir
Fig. 5 Illustration of cases with low (a, b) and high (c, d) predicted probabilities of being ruptured based on model 1. Top panel: WSS distribution at half of the cardiac cycle. Bottom panel: Blood flow
velocities at half of the cardiac cycle. The predicted probabilities and selected aneurysm characteristics are shown in Table 3
here, the AUC was with 0.79 lower than the AUC of the final model 1. This finding suggests that having a location-specific model including information that is specific to this location, like angio-architectures, could potentially improve rupture risk assessment compared to a more general model. In this regard, this study aimed at developing a statistical model for discriminating rupture status in PCOM aneurysms. Aneurysms of the anterior communicating artery (ACOM) have a comparable prevalence and risk of rupture [5], indicating a potential for a similar study in those aneurysms. This study focused on PCOM aneurysms motivated by our previous findings [8]. Furthermore, the different types of angioarchitectures are more clearly defined for these aneurysms. Future work could include the development of a statistical model for ACOM aneurysms as well.
between ruptured and non-ruptured aneurysms at the time of presentation to the hospital. In contrast, for the training of a predictive model, longitudinal data would be necessary. Nowadays, these data are, however, difficult to obtain and always inherently biased since high-risk aneurysms get treated so that follow-up data of these cases are not available. Therefore, based on the implicit assumption that ruptureprone aneurysms resemble aneurysms that have already ruptured, the presented model can be used as a Bsurrogate^ for a predictive model. Aneurysms classified as Bunruptured^ or Blow risk^ with our model should be observed during follow-up to identify possible changes that could increase the predicted rupture risk. To assess the performance of our model in terms of rupture prediction, its validation in prospective longitudinal data is planned in the future. Besides a thorough external evaluation of the presented model, it is important to provide clinicians with means for applying the model in a clinical setting. Therefore, a webbased tool that allows clinicians the application of the model to new cases will be developed. In addition to
Clinical considerations The presented Bprobability models^ were developed and validated using cross-sectional data. They thus discriminate Table 3
Characteristics of illustrated cases in Fig. 5
Case
Prob.
Angio-type
NSI
OSImax
WSSves [dyne/cm2]
Asize [cm]
Patient age [years]
a b c d
0.0473 0.1083 0.8636 0.9778
6 6 2 2
0.1659 0.1795 0.2707 0.2737
0.0317 0.2159 0.3497 0.3431
12.5408 34.2509 77.2606 148.0400
0.3559 1.0198 0.7472 0.6548
57 81 31 42
Prob probability of being ruptured based on model 1
Author's personal copy Acta Neurochir
ROC Curves − Comparison 1.0
Conclusions
0.6 0.4 0.2
Sensitivity
0.8
Statistical models of PCOM aneurysm rupture based on aneurysm hemodynamics, morphology, angio-architecture, and patient age can discriminate between ruptured and unruptured PCOM aneurysms with an AUC of 84%. It is important to include data from different hospitals to create such models of aneurysm rupture that are valid across different hospital populations. Future work will include the external validation of the developed models.
0.0
Asize (AUC=0.64) NSI (AUC=0.71) Model Xiang (AUC=0.67) Model 1 (AUC=0.84) 0.0
0.2
0.4
0.6
0.8
1.0
1−Specificity
Fig. 6 Comparison of ROC curves for the presented model, a model reported by Xiang et al. [35] and univariate models for aneurysm size and NSI
providing clinicians purely with the predicted rupture probabilities for a new case, this interface will include visualizations of the specified input parameters for facilitating their interpretation and to illustrate the computed results. After a prior evaluation with clinicians, such a tool could eventually enable the application of the presented model in a clinical setting. To enable other groups the validation of the proposed model, the Transparent Reporting of a multivariable prediction model for Individual Prognosis Or Diagnosis (TRIPOD) [37] was followed for this publication. Besides addressing the Bstandard CFD assumptions,^ the current study could be enhanced in several ways. Patient characteristics other than age and gender (e.g., hypertension, smoking, family history, etc.) were not studied due to lack of data for some cases. No validation with the split-sample approach was possible for the complete model due to lack of patient information (age) in the mayo data. This study is based on data of aneurysms that were assessed by 3D cerebral angiography. Consequently, aneurysms that were only imaged by means of MR angiography or CT angiography as well as undiagnosed aneurysms and aneurysms with fatal ruptures are inherently excluded from our dataset, resulting in a selection bias. Future multi-center studies with larger and more comprehensive samples from multiple hospitals and populations should be conducted to evaluate and further improve the predictive models, which in turn should be tested on longitudinal datasets.
Funding This study was funded by the National Institutes of Health/ National Institute of Neurological Disorders and Stroke (NIH-NINDS, grant no. R21NS094780).
Compliance with ethical standards Conflict of interest The authors declare that they have no conflict of interest. Ethical approval All procedures performed in studies involving human participants were in accordance with the ethical standards of the institutional and/or national research committee and with the 1964 Helsinki declaration and its later amendments or comparable ethical standards. For this type of study, formal consent is not required.
References 1.
Golshani K, Ferrell A, Zomorodi A, Smith TP, Britz GW (2010) A review of the management of posterior communicating artery aneurysms in the modern era. Surg Neurol Int 1:88 2. Morita A, Kirino T, Hashi K, Aoki N, Fukuhara S, Hashimoto N, Nakayama T, Sakai M, Teramoto A, Tominari S, Yoshimoto T (2012) The natural course of unruptured cerebral aneurysms in a Japanese cohort. N Engl J Med 366:2474–2482 3. Cebral JR, Raschi M (2013) Suggested connections between risk factors of intracranial aneurysms: a review. Ann Biomed Eng 41: 1366–1383 4. Weir B, Disney L, Karrison T (2002) Sizes of ruptured and unruptured aneurysms in relation to their sites and the ages of patients. J Neurosurg 96:64–70 5. Greving JP, Wermer MJ, Brown RD, Morita A, Juvela S, Yonekura M, Ishibashi T, Torner JC, Nakayama T, Rinkel GJ, Algra A (2014) Development of the PHASES score for prediction of risk of rupture of intracranial aneurysms: a pooled analysis of six prospective cohort studies. Lancet Neurol 13:59–66 6. Tominari S, Morita A, Ishibashi T, Yamazaki T, Takao H, Murayama Y, Sonobe M, Yonekura M, Saito N, Shiokawa Y, Date I, Tominaga T, Nozaki K, Houkin K, Miyamoto S, Kirino T, Hashi K, Nakayama T, for the Unruptured Cerebral Aneurysm Study Japan Investigators (2015) Prediction model for 3-year rupture risk of unruptured cerebral aneurysms in Japanese patients. Ann Neurol 77(6):1050–1059 7. Xiang J, Natarajan SK, Tremmel M, Ma D, Mocco J, Hopkins LN, Siddiqui AH, Levy EI, Meng H (2011) Hemodynamicmorphologic discriminants for intracranial aneurysm rupture. Stroke 42:144–152 8. Chung BJ, Doddasomayajula R, Mut F, Detmer F, Pritz MB, Hamzei-Sichani F, Brinjikji W, Kallmes DF, Jimenez C, Putman CM, Cebral JR (2017) Angio-architectures and hemodynamics
Author's personal copy Acta Neurochir
9.
10.
11.
12. 13.
14.
15.
16.
17. 18. 19. 20. 21.
22. 23.
24. 25.
26.
characteristics of posterior communicating artery aneurysms and their association with rupture status. AJNR Am J Neuroradiol in press: Cebral JR, Castro MA, Appanaboyina S, Putman CM, Millan D, Frangi AF (2005) Efficient pipeline for image-based patient-specific analysis of cerebral aneurysm hemodynamics: technique and sensitivity. IEEE Trans Med Imag 24:457–467 Ford MD, Alperin N, Lee SH, Holdsworth DW, Steinman DA (2005) Characterization of volumetric flow rate waveforms in the normal internal carotid and vertebral arteries. Physiol Meas 26: 477–488 Cebral JR, Castro MA, Putman CM, Alperin N (2008) Flow-area relationship in internal carotid and vertebral arteries. Physiol Meas 29:585–594 Taylor CA, Hughes TJR, Zarins CK (1998) Finite element modeling of blood flow in arteries. Comp Meth App Mech Eng 158:155–196 Mut F, Aubry R, Löhner R, Cebral JR (2010) Fast numerical solutions of patient-specific blood flows in 3D arterial systems. Int J Num Meth Biomed Eng 26:73–85 Byrne G, Mut F, Cebral JR (2014) Quantifying the large-scale hemodynamics of intracranial aneurysms. AJNR Am J Neuroradiol 35:333–338 Ma B, Harbaugh RE, Raghavan ML (2004) Three-dimensional geometrical characterization of cerebral aneurysms. Ann Biomed Eng 32:264–273 Mut F, Löhner R, Chien A, Tateshima S, Viñuela F, Putman CM, Cebral JR (2011) Computational hemodynamics framework for the analysis of cerebral aneurysms. Int J Num Meth Biomed Eng 27: 822–839 Raghavan ML, Ma B, Harbaugh RE (2005) Quantified aneurysm shape and rupture risk. J Neurosurg 102:355–362 Meier L, van de Geer S, Buhlmann P (2008) The group lasso for logistic regression. J R Stat Soc Ser B Stat Methodol 70(1):53–71 Bühlmann P, van de Geer S (2011) Statistics for high-dimensional data: methods, theory and applications. Springer, New York Simon N, Tibshirani R (2012) Standardization and the Group Lasso Penalty. Stat Sin. https://doi.org/10.5705/ss.2011.075 Detmer FJ, Chung BJ, Mut F, Slawski M, Hamzei-Sichani F, Putman CM, Jimenez CM, Cebral JR Development and internal validation of an aneurysm rupture probability model based on patient characteristics and aneurysm location, morphology, and hemodynamics. Submitted Manuscript Steyerberg EW (2009) Clinical prediction models. Springer, New York Austin PC, Steyerberg EW (2014) Graphical assessment of internal and external calibration of logistic regression models by using loess smoothers. Stat Med 33(3):517–535 Varma S, Simon R (2006) Bias in error estimation when using cross-validation for model selection. BMC Bioinformatics 7(91) Zhang Y, Jing L, Liu J, Li C, Fan J, Wang S, Li H, Yang X (2016) Clinical, morphological, and hemodynamic independent characteristic factors for rupture of posterior communicating artery aneurysms. J Neurointerv Surg 8:808–812 Backes D, Rinkel GJE, Greving JP, Velthuis BK, Murayama Y, Takao H, Ishibashi T, Igase M, terBrugge KG, Agid R, Jääskeläinen JE, Lindgren AE, Koivisto T, von Und Zu Fraunberg M, Matsubara S, Moroi J, Wong GKC, Abrigo JM, Igase K, Matsumoto K, Wermer MJH, van Walderveen MAA, Algra A, Vergouwen MDI (2017) ELAPSS score for prediction of risk of growth of unruptured intracranial aneurysms. Neurology 88(17):1600–1606
27.
Matsukawa H, Uemura A, Fujii M, Kamo M, Takahashi O, Sumiyoshi S (2013) Morphological and clinical risk factors for the rupture of anterior communicating artery aneurysms. J Neurosurg 118(5):978–983 28. Wang G-X, Yu J-Y, Wen L, Zhang L, Mou K-J, Zhang D (2016) Risk factors for the rupture of middle cerebral artery bifurcation aneurysms using CT angiography. PLoS One 11(12):e0166654 29. Juvela S, Poussa K, Lehto H, Porras M (2013) Natural history of unruptured intracranial aneurysms: a long-term follow-up study. Stroke 44:2414–2421 30. Hamdan A, Barnes J, Mitchell P (2014) Subarachnoid hemorrhage and the female sex: analysis of risk factors, aneurysm characteristics, and outcomes: clinical article. J Neurosurg 121(6):1367–1373 31. Wermer MJH, van der Schaaf IC, Algra A, Rinkel GJE (2007) Risk of rupture of unruptured intracranial aneurysms in relation to patient and aneurysm characteristics: an updated meta-analysis. Stroke 38(4):1404–1410 32. Dhar S, Tremmel M, Mocco J, Kim M, Yamamoto J, Siddiqui AH, Hopkins LN, Meng H (2008) Morphology parameters for intracranial aneurysm rupture risk assessment. Neurosurgery 63:185–197 33. Lv N, Wang C, Karmonik C, Fang Y, Xu J, Yu Y, Cao W, Liu J, Huang Q (2016) Morphological and hemodynamic discriminators for rupture status in posterior communicating artery aneurysms. PLoS One 11:e0149906 34. Duan G, Lv N, Yin J, Xu J, Hong B, Xu Y, Liu J, Huang Q (2016) Morphological and hemodynamic analysis of posterior communicating artery aneurysms prone to rupture: a matched case-control study. J Neurointerventional Surg 8(1):47–51 35. Huhtakangas J, Lehecka M, Lehto H, Jahromi BR, Niemelä M, Kivisaari R (2017) CTA analysis and assessment of morphological factors related to rupture in 413 posterior communicating artery aneurysms. Acta Neurochir. https://doi.org/10.1007/s00701-0173263-4 36. Xu J, Yu Y, Wu X, Wu Y, Jiang C, Wang S, Huang Q, Liu J (2013) Morphological and hemodynamic analysis of mirror posterior communicating artery aneurysms. PLoS One 8:se55413 37. Collins GS, Reitsma JB, Altman DG, Moons KG (2015) Transparent reporting of a multivariable prediction model for individual prognosis or diagnosis (TRIPOD): the TRIPOD statement. BMC Med 13(1):1
Comments This manuscript investigates whether a geometry and flow-based risk assessment could improve our ability to identify aneurysms at risk of rupture from the currently available risk factor-based scoring and practice. The major limitation of this study is the case-control type study design comparing ruptured and unruptured aneurysms, which setting is prone to bias because the geometry and flow conditions of an aneurysm that has ruptured may have been very different before the rupture. In spite of this limitation, the results of this study are highly interesting and contribute significantly to our knowledge on risk factor for aneurysm rupture and demonstrate that a detailed analysis of geometry and flow conditions may help to identify those aneurysms in which aberrant flow conditions will trigger pathological wall remodelling that eventually leads to rupture. Juhana Frosen Finland