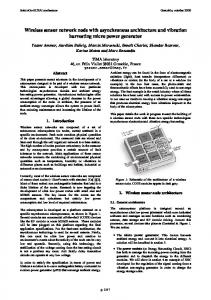
pulses with a preset threshold value. The analytical background of ultrasonic pulse generation and transmission through a metal mold is presented. The study is ...
DEVELOPMENT OF A WIRELESS PRESSURE SENSOR WITH REMOTE ACOUSTIC TRANSMISSION Li Zhang, Charles B. Theurer, Robert X. Gao, and Department of Mechanical and Industrial Engineering University of Massachusetts Amherst, MA 01003 David O. Kazmer Department of Plastics Engineering University of Massachusetts Lowell, MA 01854 ABSTRACT Development of a wireless pressure sensor is motivated to reduce package size and cost, improve lifecycle robustness, and thereby facilitate the widespread use of in-process sensors. Many net shape processes exhibit significant transient pressures during the production cycle, which may be used to selfenergize a remote sensor through the piezoelectric (PE) effect. The pressure information inside the cavity is measured by means of a train of ultrasonic pulses. The pressure is obtained by multiplying the number of pulses with a preset threshold value. The analytical background of ultrasonic pulse generation and transmission through a metal mold is presented. The study is an integral part in the development of a wireless acoustic sensor for in-situ injection molding machine cavity pressure measurement and process condition monitoring. 1. INTRODUCTION The rapid development of wireless technology in recent years has enabled sensors to be placed within a mechanical component or system under investigation and communicate with the receiver via electromagnetic waves [1-3]. In the operation of net shape manufacturing process, wireless sensor would greatly improve process monitoring and control by enabling arbitrary placement and ease of installation, since no structural modification to the mold are necessary. Consequently, both installation and maintenance costs would be greatly reduced. Injection molding is one net shape manufacturing process, widely used to manufacture polymeric components with complex geometry to tight specifications. To achieve high product quality
while maintaining low rejection rates, on-line monitoring and control of temperature and pressure variations during the injection molding process is necessary. Traditionally, cavity pressure sensors are mounted in the mold and connected to external data processing devices by cables, as shown in Fig. 1(a). Various holes and channels need to be machined on the mold to accommodate the cables for sensor installation. Furthermore, the number of sensors that can be installed in a mold is restricted by economic and geometrical constraints. In comparison, using wireless sensors as illustrated in Fig. 1(b) has the inherent advantage of less mold structure modification and lower installation cost.
Fixed Mold
Movable Mold Cabled Sensor Receiver
Nozzle
Cavity
a) Cabled sensor
Cooling Line
Ultrasonic Wave
Hole
Wireless Sensor
b) Wireless sensor
FIGURE 1. SCHEMATICS OF CABLED SENSOR AND WIRELESS SENSOR INSTALLED IN A MOLD.
Metal molds completely enclose the cavity, providing electromagnetic shielding that prevents communication of process data using RF-based signal transmission. Ultrasound presents an alternative to electromagnetic waves for injection molding data transmission. As a mechanical wave, ultrasounds can propagate through the metal without limitation from the electromagnetic shielding effect. Ultrasonic technology has long
2. DIGITIZATION OF MELT PRESSURE In order to realize the concept of wireless mold data transmission, two design constraints must be considered. First, the sensor itself must supply the energy required for signal generation and transmission. Secondly, the signal transmitted wirelessly through the mold steel to the data receiver must be of sufficient signal-to-noise ratio to maintain information content. During the molding cycles, the change in melt pressure inside the cavity is typically 100-200 MPa. This pressure differential is sufficient to energize the piezoceramic sensor to produce a charge output proportional to the pressure differential. To minimize energy consumption, this pressure differential will be discretized to provide a series of acoustic pulses rather than a continuous signal. A typical cavity pressure curve is illustrated in Fig. 2. As the cavity pressure increases with the propagation of the melt front past the sensor location, the converted energy from a piezoceramic element will exceed a preset threshold value. A micro switch then serves to digitize the analog pressure curve, and relay the charge to a secondary piezoceramic transmitter, which subsequently generates ultrasonic pulses. The total number of pulses is a measure of the inprocess melt pressure. The switch and transmitter is designed to provide a different signal for the identification of a step decrease in cavity pressure. Thus, the current cavity pressure value is obtained by multiplying the number of ultrasonic pulses with the preset threshold value. After each measurement cycle, the charge on the primary piezoceramic element drops to zero, making the system ready for the next measurement cycle. It is noted that the preset threshold represents the smallest measurement unit. While smaller threshold provides higher measurement
resolution, it must be large enough to ensure sufficient energy for the secondary piezoceramic element to generate an ultrasonic pulse, and also allow time for some decay of the acoustics signal between pulses. As such, there is a maximum ramp rate determined by the specified resolution and measurement cycle time.
1
100
Cavity Pressure (MPa)
been used for non-destructive testing and evaluation (NDT/NDE) of material properties [5]. For this application, the PE effect and inverse PE effect are being utilized in an integrated fashion. Upon load application from the injected polymer melt, a primary piezoceramic element will generate electrical charges proportional to the melt pressure. The charge will in turn be applied to a secondary piezoceramic element that subsequently vibrates and emits ultrasound signals. This paper is focused on the study of the fundamental mechanism of ultrasonic pulse generation using a piezoceramic transmitter as well as the use of ultrasonic pulses for wireless injection molding process data transmission.
90 80
2
70 60 50 40 30 20 10 0
1
2
3
4
5
Time (Second)
1) Observed, and 2) Digitized FIGURE 2. DIGITIZATION OF CAVITY PRESSURE.
As shown in Fig. 3, the wireless sensor can be installed directly from the parting plane of the mold, without removal of the mold from production. A receiver located on the side of the mold will receive the ultrasound signal that propagates through the mold steel, and transmit pressure changes to a data acquisition system. Fig. 4 illustrates the design of the molding pressure sensor, which consists of three basic components: 1) a primary PE stack (pressure actuator) for energy extraction, 2) a micro switch and threshold setting unit, and 3) a secondary PE disk (ultrasonic transmitter) for ultrasonic pulse generation. Melt Front
Ultrasound
Mold
Receiver
FIGURE 3. INSTALLATION OF A WIRELESS ULTRASOUND SENSOR ON THE MOLD.
V
I
Insulation Layer Primary PE Stack
(a)
Z V
Z1 V1
Housing
0 Micro Switch
Z2 V2
z
d DZ
D0
Secondary PE
(b)
FIGURE 4. CONFIGURATION OF WIRELESS SENSOR. (c)
3. ULTRASONIC PULSE GENERATION Governed by the inverse PE effect, a PE element will change its form (contract/expand) when subject to an electrical field. This property has been utilized for ultrasound generation purpose [5-7]. An alternating electrical field with constant amplitude applied to a thin piezoceramic disk will generate sinusoidal waves. However, from the energy conservation perspective, generating an oscillating electrical field is energy consuming, and thus not suitable for the proposed selfenergizing sensor design. In comparison, a short burst containing only several cycles of waves is considered to be a better carrier for the pressure information. Burst generation is also compatible with the on-and-off operation of the micro switch for threshold generation. The generation of electrical charges is based on the electrical-mechanical interaction within the PE material, e.g. a piezoceramic disk, and can be described by the relationship between two electrical and mechanical variables: e D (1) E=− S S+ S ε ε and T = c E S − eE (2) where T is the mechanical stress developed within the piezoceramic material, S is the corresponding mechanical strain, D is the electric displacement, E is the electric field, cE is the elastic constant of the piezoceramic material, e is the PE stress constant, and εS is the permittivity constant. Equation 1 indicates that the electrical field in piezoceramic material is influenced not only by the electric displacement, but also by the applied stress. Equation 2 indicates that the mechanical strain in a piezoceramic material is induced not only by the applied stress, but also by the applied electrical field. Those equations describe the interaction between mechanical and electrical variables within a piezoceramic material, which facilitates modeling of the response of PE disk under excitation of an electric field.
0
d
z
0
d
z
IV
I II
(d)
0
III d
z
IV
I III 0
(e)
II d
z
FIGURE 5. RESPONSE OF A PE TRANSMITTER TO AN IMPULSIVE ELECTRONIC EXCITATION.
In Figure 5 [8], a PE disk is shown sandwiched by two boundary materials. Both materials have the same acoustic impedances and sound speeds as the transmitter i.e. Z1 = Z2 = Z and V1 = V2 = V. As a result, no signal reflections would occur at the interfaces between the transmitter and the boundary materials. To investigate the generation of ultrasound signals within a PE, Newton’s second law is applied: ∂ 2u z ∂T (3) =ρ ∂z ∂t 2 ∂T represents the force exerted by the where ∂z electric field to the PE disk in the z direction, ρ is ∂ 2u z the density of the disk, and is the ∂t 2 acceleration of the molecules within the PE disk along the z direction. Eliminating E from Eq. (1) and substituting T in Eq. 3 yields [8]: ∂ 2u e 2 ∂ 2u e ∂D z (4) ρ 2z − (c E + S ) 2z = − S ∂z ∂t ε ε ∂z This can be written in a more compact form [8]: ∂ 2u z 1 ∂ 2 u z 1 k 2 ∂D z (5) = − e 1 + k 2 ∂z v 2 ∂t 2 ∂t 2 k=
e2
is the electromechanical c Eε S coupling coefficient describing the efficiency of electrical-mechanical energy conversion, v is the where
where k T2 =
k2 1+ k2
and Dz is shown in Fig. 5(b).
Eqation (6) shows that under impulsive excitation, the PE disk generates two mechanical displacement waves, one propagating along the +z direction and the other along the -z direction, as shown in Fig. 5(c). The velocity of the displacement wave propagating +z direction is then given by [8]: tv − z tv − z + d (7) ) −δ ( )] v z (t , z ) = −v 0 [δ ( d d where v 0 =
vk T2 D0
. Therefore, there are two 2e stress impulses generated by each of the displacement wave. From the definition of acoustic impedance, Z = T / v , the stress waves propagating +z direction is given as: tv − z tv − z + d ) −δ ( )] (8) T z (t , z ) = −v 0 Z [δ ( d d Figure 5(d) shows the stress waves for the time td/v. In the case that the materials are acoustically homogenous along the z direction, there are no reflections exist at the interfaces. Therefore only two stress impulses are produced in each direction and half of the energy is lost to the negative transmitting waves.
2Z 2 Z2 − Z and t 2 = (10) Z2 + Z Z2 + Z 2Z 2Z t3 = and t 4 = (11) Z1 + Z Z2 + Z where t is the transmission coefficient and r is the reflection coefficient. Coefficients with subscript 1 are for the stress waves traveling from the PE disk to material type 1, whereas coefficients with subscript 2 are for the stress waves traveling from PE disk to material type 2. The coefficients t3 and t4 are for stress wave propagating from material type 1 to the PE disk and from material type 2 to the PE disk, respectively. As a result, a series of impulses will be produced and the response in the region of z>d will consists of a series of alternating decaying pulses. Concentrating on z=d, the pattern of the pulse in the time domain is given as: r2 =
Tz (t ) = v0 Z {t2δ (t ) −
∞
∑ (r r )
n −1
[t3t2δ (tv − (2n − 1)d )
12
n =1
+t 4 t 2 r1δ (tv − 2nd )]}
(12)
According to Eq. (12), pulse pattern is dependent on the impedances of materials. Two examples are plotted in Fig. 6. Noted in the first case, Z1=0 represents the impedance of air. Normalized Amplitude
When the energy on the primary PE element exceeds the threshold, the switch provides a current spike on the secondary PE disk. By approximation, this current spike can be represented as an impulsive excitation to the PE. The impulse response is obtained by solving Eq. (5). The solution is given in [8] as: tv − z ⎧ D ( ), z > d dk T2 ⎪⎪ z d (6) u z (t , z ) = − ×⎨ tv + z 2e ⎪ Dz ( ), z < 0 ⎪⎩ d
a portion of each incident wave to be reflected at the interfaces, whereas the other portion passes through the interfaces. For the system shown in Fig. 5(a), the reflection and transmission coefficients at the two interfaces are given by: 2Z1 Z −Z and t1 = (9) r1 = 1 Z1 + Z Z1 + Z
2
Z1=0 Z2/Z=0.3
1 0 -1 -2 -3 0
1
2
3
4
5
6
7
8
Normalized Time Normalized Amplitude
sound speed within the PE transmitter, and Dz is the electric displacement resulting from the current applied to the PE disk.
1.5
Z1/Z=0.6 Z /Z=0.3 2
1.0 0.5 0.0 -0.5 -1.0 -1.5
The impedances of the various materials along the propagation path of stress waves will generally not be identical. This mismatch causes
0
1
2
3
4
5
6
7
8
Normalized Time
FIGURE 6. ULTRASONIC PULSE PATTERNS
The duration of the pulses can be adjusted by using materials with different impedance, e.g. by changing the backing material of the transmitter to obtain pulses with various time lengths. Because of the low impedance of air, an air-backed transmitter would provide the longest ultrasonic pulses and maximum power transfer. However, very long pulse is undesirable if high sensor resolution is required. Figure 7 shows a portion of the cavity pressure curve. Two consecutive ultrasonic pulses are generated when the pressure drops by 20MPa. The slope of the pressure curve determines the interval between the two adjacent ultrasonic pulses. When the ultrasonic pulse lasts longer than the interval, the second pulse will be generated before the first one dies out, causing signal interference. This interference will present difficulty to the receiver to distinguish them properly. Hence, proper design of the backing material is required to generate ultrasonic pulses with suitable time length.
1
⎧⎪ 1 ⎡ ⎤ ⎫⎪ a P(r ,0) = 2 ρcU sin ⎨ kr ⎢ 1 + ( ) 2 − 1⎥ ⎬ (13) r ⎪⎩ 2 ⎢⎣ ⎥⎦ ⎪⎭ where r is the distance from the transmitter surface to a point along the axial axis, a is the radius of the PE disk, k is the wave number, ρ is density, U is the amplitude of vibration at the disk surface, and c is the speed of ultrasound in the medium. It can be seen that the pressure along the axis of the disk fluctuates between 0 and 2ρcU. This region is called the near field. As the distance r increases, the maxima and minima of the pressure become more widely spaced. The last maximum pressure marks approximately the end of the near field. However, if r is large enough such that r/a>>1 and r/a>>ka, the pressure along the z-axis can be simplified as: a 1 P(r ,0) = ρcU ka (14) 2 r This means the ultrasonic pressure exhibits a monotonically decreasing behavior with a 1/r dependence. This region is called the far field. A typical profile of near field and far field is shown in Fig. 8. The extent of the near field is estimated that the distance from the various portion of the disk surface to a point on the axial axis must not differ more than one half wavelength. This defines the near field as:
1 D2 (15) 4 λ where D is the diameter of the piezoceramic disk and λ is the wavelength of the generated ultrasonic pulses. Because of the non-stable pressure distribution in the near field, it is easy for the receiver placed within the near field of the piezoceramic disk to receive fluctuating, weak signals. Therefore, for the injection mold cavity pressure measurement with fixed thickness of the mold, the piezoceramic transmitter needs to be designed to have a near field shorter than the thickness of the injection mold. Rn ≈
2
1) Long pulse, with interference 2) Short pulse, no interference
FIGURE 7. LONG PULSE AND SHORT PULSE.
4. BEHAVIOR OF ULTRASONIC PULSE The ultrasonic pulse is not transmitted uniformly in every direction through the mold steel. The distribution of the ultrasound pressure is dependent on the propagation direction, and has an effect on the placement strategy of the remote signal receiver. For mathematical modeling of the ultrasonic pressure distribution, the surface of the PE disk can be divided into infinitesimal elements, each acting as a simple point source. Because of signal interference, the pressure distribution exhibits certain patterns along and across the disk axial axis. The axial variation in pressure produced by the PE disk face is given by [9]:
Near Field
Far Field
r/a
FIGURE 8. SCHEMATIC OF NEAR FIELD AND FAR FIELD ALONG THE DISK AXIAL AXIS.
The pressure varies not only along the axial axis of the piezo disk but also across the axial axis, thus exhibiting a strong angular dependence, called the beam pattern. An example of the pattern is illustrated in Fig. 9, which shows the relative strength and angular dependence of the ultrasonic pressures. The pressure maxima is located on the disk axial axis. With the increase of the angle, the pressure decreases and drops to zero at angle α. The range within the angle α defines the main lobe. Further increasing the angle will result in a pressure increase to its second peak, after which the pressure drops again to zero. This pattern will repeat with the increase of angle, but the value of the peak pressure decreases significantly. For a selfenergized sensor design, reducing energy consumption and maximizing signal strength on the receiver side are of top priority. As observed from the beam pattern, locations for the receiver to receive the strongest ultrasonic signals are along the axis of the piezoceramic disk. As illustrated in Fig. 9, assuming the ultrasonic pulse intensity level along the axial axis of the PE disk is 0 dB, and the intensity level at angle θ is –10 dB. In order to receive a signal of intensity level higher than –10dB, the receiver must be located within a circle with Ttan(θ) radius and centered on the axial axis of the PE disk, where T is the thickness of the injection mold steel. Emitter Mold
−10dB
T
Transmitter Bulk Wave
Receiver
Surface Wave
FIGURE 10. EXPERIMENT CONFIGURATION.
The transmitter/receiver contains a single piezoceramic disk with the diameter D of 0.9 cm. Upon excitation using an impulsive electrical field of 10 Volts, the transmitter produced a bulk ultrasonic pulse, which transmitted longitudinally through the plate, as shown in Fig. 11, pulse number 1. This pulse lasted 60µs. For the wireless acoustic sensor design, in order to avoid interference and achieve higher resolution, the pulse length will be decreased by using backing material with higher acoustic impedance. Note that a shorter pulse also means lower energy contained in the signal, therefore the higher resolution is obtained at the cost of signal-tonoise ratio. As seen from Fig. 11, the frequency f of a generated ultrasonic pulse is about 330 kHz. Knowing that the longitudinal sound velocity v in aluminum is about 6,350 m/s, the pulse wavelength is then obtained as λ = v / f ≈ 1.9 cm . Upon substitution of D and λ into Eq. 18, the extent of the near field for this acoustic sensor is about 1 mm, which is far smaller than the thickness of a typical injection mold plate. Therefore, the amplitude of received pulse will exhibit a dependence on the inverse of thickness of the mold plate, as described in Eq. 17. 20µs/div
0dB α θ
24mV
Ttan(θ) Receiver
1
2
FIGURE 9. RECEIVER LOCATION.
5. EXPERIMENTAL STUDY Experiments have been conducted to investigate the generation and reception of ultrasonic pulses. A square aluminum plate 30cm long and 4cm thick was used. A PE transmitter is installed on the center of the plate, whereas the receiver is placed at the opposite side, as shown in Fig 10. The PAC C-101_HV Pulser and Micro80 acoustic sensors have been used in the experiment.
60 µs
60µs
FIGURE 11. RECEIVED ULTRASONIC PULSES: 1) BULK WAVE, 2) SURFACE WAVE.
The transmitter also generated a pulse transmitting transversely along the plate surface, as shown in Fig. 11, pulse number 2. In general, the speed of surface wave is approximately half of the speed of the bulk wave. Therefore the bulk
Existence of a surface transmitting ultrasonic pulse affect the accuracy of measurement in that the receiver may recognize it as the next signal, which represents a false change of the melt pressure by a different preset value. Therefore, elimination of surface pulse is required. As the surface pulse transmits along the surface of the plate and the bulk pulse transmits directly through the plate, the transmitting distance of surface pulses is far greater than that of the bulk pulses. Because of scattering, the pressure of the pulse is proportional to the distance, and then the surface pulse has greater attenuation than the bulk pulse, as shown in Fig. 11. Therefore, appropriate setting of detecting threshold can eliminate the surface pulse. An experiment has been conducted to evaluate the attenuation of surface transmitting pulse. The transmitter and the receiver were installed on the same surface of the aluminum plate, with the location of the receiver fixed and that of the receiver movable. The amplitude of received surface pulse dropped as the receiver moved away from the transmitter, following the theoretical function of inverse proportional to the distance squared, as shown in Fig. 12. Furthermore, because the high-pressure polymer melt itself presents significant damping to the surface transmitting pulse, its effect will be further reduced. Use of a receiver that is insensitive to surface wave further reduces the influence of signal interference. 35
where Ax is the amplitude of the pulse at distance x away from the transmitter and A0 is the amplitude measured at x=0. Another experiment was conducted to investigate the influence of beam pattern. The transmitter was fixed on the center of one side of the aluminum plate, and the receiver was installed on the opposite side. As the receiver moved radially away from the center (at this position, the receiver is located along the axial axis of the transmitter), the amplitude of received pulses fluctuated. The data is plotted in Fig. 13. Locations for maximum signal reception are the center and 4.5cm away from the center. This characteristic of received signal restricted the placement of receiver. A transmitter with wider main lobe will simplify the placement of receiver, and thus suitable for the case of multiple sensors and single receiver configuration. 35 30 25 20 15 10 5
0
30
Amplitude (mv)
Ax = A0e−0.08 x
0
Attenuation of Surface Pulse Mean Value Fitted Curve
25
Then an analytical model to describe the attenuation of the surface wave is obtained as:
Amplitude (mv)
ultrasonic pulse arrives at the receiver about 70 µs earlier than the surface pulse.
1
2
3
4
5
6
Distance to the Center (cm)
FIGURE 13. INFLUENCE OF BEAM PATTERN.
20 15 10 5 0 0
5
10
15
20
25
Distance (cm) FIGURE 12. ATTENUATION OF SURFACE PULSE AS A FUNCTION OF DISTANCE.
6. CONCLUSION Several fundamental aspects related to the design and signal transmission mechanism for a new type of wireless acoustic sensor for injection molding cavity pressure measurement is introduced. The sensor will measure the change of pressure by means of a train of ultrasonic pulses. A piezoceramic disk in the mold cavity is used to generate the ultrasonic pulses. The analytical background of ultrasonic pulse generation by the piezoceramic disk under impulsive current excitation is discussed. The results provide guidelines for the design of self-
energized sensor and wireless acoustic sensor for injection molding process monitoring. Experimental studies have been conducted, and the results verified the mechanism of ultrasonic pulse generation and transmission. Further numerical and experimental studies are being conducted for the prototyping of a realistic measurement system. ACKNOWLEDGEMENT The authors gratefully acknowledge funding provided to this research by the National Science Foundation under award DMI-9988757. REFERENCES [1] Bulst, W.-E., Fischerauer, G., and Reindl, L., 1998, "State of the Art in Wireless Sensing with Surface Acoustic Waves", Proceedings of the 1998 24th Annual Conference of the IEEE Industrial Electronics Society, Vol. 4, pp. 2391-2396. [2] Buff, W., Klett, S., Rusko, M., Ehrenpfordt, J., and Goroll, M., 1998, "Passive Remote Sensing for Temperature and Pressure Using SAW Resonator Devices", IEEE Transactions on Ultrasonics, Ferroelectrics, and Frequency Control, Vol. 45, pp. 13881392. [3] Wang, C. and Gao, R., April, 2000, "A virtual instrumentation system for integrated bearing condition monitoring", IEEE Transactions on Instrumentation and Measurement, Vol. 49, No. 2, pp. 325-332. [4] Asher R. C., 1997, Ultrasonic Sensors for Chemical and Process Plant, Institute of Physics, London. [5] Redwood, M., 1961, “Transient Performance of a Piezoelectric Transducer”, The Journal of The Acoustical Society of America, Vol. 33, No. 4, pp. 527-536. [6] Stuetzer, O. M., 1967, “Piezoelectric Pulse and Code Generator”, IEEE Transactions on Sonics and Ultrasonics, Vol. Su-14, No. 2, pp. 75-88. [7] Monma, H., Yoshida, Y., Imano, K., Inoue, H., and Murata, K., 2000, “A Study on the Conditions for Generation of Monopole Ultrasonic Pulse by PE Polymer Film Transducers”, Jpn. J. Applied Phys., Vol. 39, pp. 3139-3143. [8] Ristic, V. M., 1983, Principles of Acoustic Devices, Chap. 5, John Wiley & Sons, New York.
[9] Kinsler, L. E., Frey, A. R., Coppens, A. B., and Sanders, J. V., 1982, Fundamentals of Acoustics, John Wiley & Sons, New York. [10] Orzechowski, S., Paris, A., and Dobbin, C., 1998, "A Process Monitoring and Control System for Injection Molding using Nozzlebased Pressure and Temperature Sensors", Proceedings of the 1998 56th ANTEC, Vol. 1, pp. 424-428 [11] Yamaguchi, K., Yagami, H., and Fujii, T., 1986, “New Method of Time Domain Analysis of the Performance of Multilayered Ultrasonic Transducers”, IEEE Transactions on Ultrasonics, Ferroelectrics, and Frequency Control, Vol. UFFC-33, No. 6, pp. 669-678. [12] Hossack, J. A., Auld, B. A., 1993, “Improving the Characteristics of a Transducer Using Multiple Piezoelectric Layers”, IEEE Transactions on Ultrasonics, Ferroelectrics, and Frequency Control, Vol. 40, No. 2, pp. 131-139 [13] Randeraat, J. V. and Setterington R. E., 1974, PE Ceramics, Mullard limited, London. [14] Matthys, R. J., 1983, Crystal Oscillator Circuits, John Wiley & Sons, New York. [15] Frederick, J. R., 1965, Ultrasonic Engineering, John Wiley & Sons, New York. [16] Carlin, B., 1960, Ultrasonics, McGraw-Hill, New York.