International Journal of Applied Information Systems (IJAIS) â ISSN : 2249-0868. Foundation of ... In recent time, the wireless sensor network technology has found ... low-power radio frequency transceivers, to a remote master controller for ...
International Journal of Applied Information Systems (IJAIS) – ISSN : 2249-0868 Foundation of Computer Science FCS, New York, USA Volume 7– No. 3, May 2014 – www.ijais.org
Development of a Wireless Sensor Network for Monitoring Environmental Condition on a Farmland Ganiyu R. A.,
Arulogun O. T.,
Okediran O. O.,
Department of Computer Science and Engineering, Ladoke Akintola University of Technology, Oyo State, Nigeria.
Department of Computer Science and Engineering, Ladoke Akintola University of Technology, Oyo State, Nigeria.
Department of Computer Science and Engineering, Ladoke Akintola University of Technology, Oyo State, Nigeria.
All Authors are correspondent Authors ABSTRACT In recent time, the wireless sensor network technology has found its implementation in precision agriculture as a result of the need for high productivity. This paper focuses on the development of a wireless sensor network on agricultural environment to monitor environmental conditions and deduce the appropriate environmental parameters required for the high yield of crop production on a given farmland. The developed wireless sensor network is built around sensor nodes and a master microcontroller (PI16F648A) that takes in the data sent from the nodes for upload into a personal computer (PC). Each node has sensors to monitor environmental conditions such as temperature, relative humidity and light intensity which are important environmental factors in an agricultural set-up. The DHT11 sensor is used to sense and provide calibrated digital outputs for the measured temperature and relative humidity while a calibrated light dependent resistor (LDR) is configured to the light intensity sensor unit. The outputs from these sensors are processed by the microcontroller and sent wirelessly, using low-power radio frequency transceivers, to a remote master controller for storage. The deployment of the developed wireless sensor network on a named farmland shows that the aforementioned could be efficiently utilized to provide an up-todate and accurate measurement of agricultural environmental parameters necessary for plant protection and sustainable crop production. Thus, the developed wireless sensor network replaces the traditional method of predicting environmental parameters required on a given farmland.
General Term Wireless Sensor Technologies
Keywords Environmental parameters, Microcontroller, Farmland
Wireless
sensor,
Network,
1. INTRODUCTION A wireless sensor network (WSN) consists of spatially distributed autonomous sensors to monitor physical or environmental conditions, such as temperature, sound, vibration, pressure, humidity, motion or pollutants and to cooperatively pass their data through the network to a main location [2]. The development of wireless sensor networks was motivated by military applications such as battlefield surveillance; today such networks are used in many industrial and consumer applications, such as industrial process monitoring and control, machine
health monitoring and so on [1]. The WSN is built of "nodes" – from a few to several hundreds or even thousands, where each node is connected to one (or sometimes several) sensors. Each such sensor network node has typically several parts: a radio transceiver with an internal antenna or connection to an external antenna, a microcontroller, an electronic circuit for interfacing with the sensors and an energy source, usually a battery or an embedded form of energy harvesting. A sensor node might vary in size from that of a shoebox down to the size of a grain of dust, although functioning "motes" of genuine microscopic dimensions have yet to be created. The topology of the WSNs can vary from a simple star network to an advanced multi-hop wireless mesh network. In [7], an attempt was made to review experiments carried out on the use of wireless sensors in plantation crop and especially on tea plantation. It was observed that WSN is an effective tool for measuring the environmental parameters and growth factors of tea. Also, [3] proposed to design, develop and implement a wireless sensor network connected to a central node using ZigBee, which in turn is connected to a Central Monitoring Station (CMS) through General Packet Radio Service (GPRS) or Global System for Mobile (GSM) technologies. In the same vein, [4] discussed a framework for wireless sensor networks designed to capture and monitor surface soil moisture level - one of the key contributors of climate change modeling while [5] presented a framework for wireless sensor networks designed to capture and monitor micro-climates in a crop field. In [8], it was stressed that most sensor networks actively monitor their surroundings, and it is often easy to deduce information other than the data monitored. Such unwanted information leakage often results in privacy breaches of the people in the environment. In addition, [6] surveyed a comprehensive review of the available solutions to support wireless sensor network environmental monitoring applications. [10] presented a soil moisture monitoring system which comprises of commercially available soil moisture sensor Decagon EC-5, low power nRF24L01 wireless transceiver, and MPC82G516A microcontroller. Also, [9] investigated and identified how the use of mobile phones in conjunction with WSN enable farmers in Ethiopia monitor and control their farm field. Nevertheless, this paper entails the development of a wireless sensor network for agricultural set-up (a farm). Precisely, the light intensity, humidity and temperature in quarantine would be measured and remotely updated. Measured data from the sensors would be processed by a microcontroller and sent wirelessly, using low-power radio frequency transceivers, to a remote master controller for storage.
28
International Journal of Applied Information Systems (IJAIS) – ISSN : 2249-0868 Foundation of Computer Science FCS, New York, USA Volume 7– No. 3, May 2014 – www.ijais.org
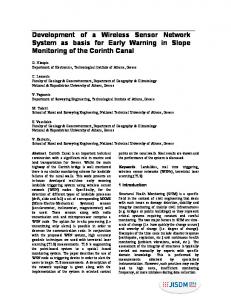
2. RESEARCH METHODOLOGY 2.1 The Design of the Wireless Sensor Network The design of the wireless sensor network is built around sensor nodes wirelessly connected to a master microcontroller that takes in the data sent from the nodes for upload into a personal computer (PC). Each node has sensors to monitor some environmental conditions like temperature, relative humidity and light intensity which are important environmental factors in an agricultural set-up. The DHT11 sensor was used to sense temperature and relative humidity. The DHT11 sensor provides calibrated digital outputs for temperature and humidity. A calibrated light dependent resistor (LDR) was used to implement the light intensity sensor stage. The output from these sensors is processed by the microcontroller, PI16F648A, used in this design. Two nodes are implemented in this design and the processed data from each node is wirelessly transmitted to the master controller. Three parallax 533MHz transceivers were used for the wireless transmission of the data from the nodes to the master controller. The received data is uploaded to a database on a PC by the master microcontroller. Figures 2.1 and 2.2 respectively show the Circuit Diagrams for the Transmitting and Receiving Nodes of the developed Wireless Sensor Network for Monitoring Environmental Conditions on a given farmland.
Figure 2.2: Circuit Diagram for the Receiving Node of the Wireless Sensor Network for Monitoring Environmental Condition on Farmland.
2.1.1 The Sensors Units In this design, sensors were used to take in the environmental conditions (temperature, relative humidity and sunlight intensity) being monitored. These sensors under consideration are analyzed as follows.
2.1.2 The DHT11 sensor
Figure 2.1: Circuit Diagram for the Transmitting Node of Wireless Sensor Network for Monitoring Environmental Conditions on Farmland.
The DHT11 sensor provides calibrated digital outputs for temperature and humidity and is relatively cheaper compared to others in its caliber like the Sensirion sensors, SHT1x/SHT7x, which are very accurate sensors, but are still expensive for hobbyists use. The DHT11 sensor have both temperature and humidity sensors with signal conditioning, ADC, calibration and communication interface all built inside them. The use of smart sensors like the DHT11 greatly simplify the design and reduces the overall cost. The DHT11 sensor with its associated proprietary 1-wire protocol was used and implemented with the PIC16F648A microcontroller, which receive the temperature and humidity values from the sensor. The DHT11 sensor comes in a single row 4-pin package and operates from 3.5 to 5.5V power supply. It can measure temperature from 0-50 °C with an accuracy of ±2°C and relative humidity ranging from 20-95% with an accuracy of ±5%. The sensor provides fully calibrated digital outputs for the two measurements. It has got its own proprietary 1-wire protocol, and therefore, the communication between the sensor and a microcontroller is not possible through a direct interface with any of its peripherals. The protocol must be implemented in the firmware of the MCU with precise timing required by the sensor. Figure 2.3 shows the DHT11 sensor with its pin-out.
29
International Journal of Applied Information Systems (IJAIS) – ISSN : 2249-0868 Foundation of Computer Science FCS, New York, USA Volume 7– No. 3, May 2014 – www.ijais.org Checksum = Last 8 bits of (Integer Byte of RH + Decimal Byte of RH + Integer Byte of Temp. + Decimal Byte of Temp.)
Figure 2.3: DHT11 sensor showing its pin-out. In addition, Figure 2.4 depicts the timing diagrams describing the data transfer protocol between a MCU and the DHT11 sensor. The MCU initiates data transmission by issuing a “Start” signal. The MCU pin is configured as output for this purpose. The MCU first pulls the data line low for at least 18 ms and then pulls it high for next 20-40 μs before it releases it. Next, the sensor responds to the MCU “Start” signal by pulling the line low for 80 μs followed by a logic high signal that also lasts for 80 μs. The MCU pin must be configured to input after finishing the “Start” signal. Once detecting the response signal from the sensor, the MCU should be ready to receive data from the sensor. The sensor then sends 40 bits (5 bytes) of data continuously in the data line. While transmitting bytes, the sensor sends the most significant bit first.
In order to send a bit of data, the sensor first pulls the line low for 50 μs. Then it raises the line to high for 26-28 μs if it has to send “0″, or for 70 μs if the bit to be transmitted is “1″. So it is the width of the positive pulse that carries information about 1 and 0 as shown in Figure 2.5. At the end of the last transmitted bit, the sensor pulls the data line low for 50 μs and then releases it. The DHT11 sensor requires an external pull-up resistor to be connected between its Vcc and the data line so that under idle condition, the data line is always pulled high. After finishing the data transmission and releasing the data line, the DHT11 sensor goes to the low-power consumption mode until a new “Start” signal arrives from the MCU (microcontroller unit) as shown in Figure 2.6.
Figure 2.5: Timing difference for transmitting "1s" and "0s"
Figure 2.6: Start, Response and Data signals in sequence
2.1.3 Light sensor stage Figure 2.4: "Start" and "Response" signals The 40-bit data from the sensor has the following structure. Data (40-bit) = Integer Byte of RH + Decimal Byte of RH + Integer Byte of Temp. + Decimal Byte of Temp. + Checksum Byte
The light sensor stage was implemented using a calibrated Light Dependent Resistor (LDR). The resistance of the LDR varies with the intensity of light falling on its surface. This change in resistance when implemented in a voltage divider network as shown in Figure 2.6 is converted into a change in voltage as input to the internal ADC of the MCU. Figure 2.7 depicts the diagram of Light Sensor stage.
For DHT11 sensor, the decimal bytes of temperature and humidity measurements are always zero. Therefore, the first and third bytes of received data actually give the numeric values of the measured relative humidity (%) and temperature (°C). The last byte is the checksum byte which is used to make sure that the data transfer has happened without any error. If all the five bytes are transferred successfully then the checksum byte must be equal to the last 8 bits of the sum of the first four bytes. That is,
30
International Journal of Applied Information Systems (IJAIS) – ISSN : 2249-0868 Foundation of Computer Science FCS, New York, USA Volume 7– No. 3, May 2014 – www.ijais.org V+(5V)
10kΩ
to MCU
LDR
Figure 2.7: Light Sensor Stage
2.2 Analogue to Digital Conversion Most of the sensors return the sensed data as voltage. The strength of physical parameter measured is reflected in the level of voltage returned. In order to use this analog data (voltage) in digital world, it has to be converted into digital equivalent. This process is called Analog to Digital Conversion or ADC. The ADC device has complex design of resistor ladders and networks that sequentially divide the input voltage into discreet levels and then return the value as digital number. Since interaction with digital world is quite common for microcontrollers, PIC 16F648A has 5 channels of ADC input. The pins associated with analog inputs are also used for other purposes in order to use them as analog certain registers have to be set. They enable microcontroller to recognize not only whether some pin is driven to logic zero or one (0 or +5V), but to precisely measure its voltage and convert it into numerical value, i.e. digital format.
2.3 The ADCON0 Register The ADCON0 register selects two main things. First it selects which channel or pin to use to sample the analog signal and secondly the speed of conversion, also called TAD. The TAD depends on the source of clock signals. Figure 2.8 shows the orientation of the ADCON0 register. R/W-0
R/W-0
ADCS1
ADCS0
R/W-0 CHS2
R/W-0
R/W-0
CHS1
CHS0
R/W-0 GO/DONE
R/W-0 _
bit 7
R/W-0 ADON bit 0
Figure 2.8: Orientation of the ADCON0 register. The Chanel Select CHS0 - CHS2 are three bits which select the I/O pin to sample. The ADCS0 and ADCS1 bits determine the TAD. The ADON bit powers up the converting module, GO/DONE bit when set to 1 starts conversion. It remains 1 while conversion is going on, when conversion is complete and data has been transferred to ADRES registers, this bit is automatically cleared indicating completion. Figure 2.9 shows the internal architecture of the ADC stage in the MCU (PIC16F648A).
Figure 2.9: Internal Architecture of the ADC Stage in the MCU (PIC16F648A)
2.4 The Microcontroller (PIC16F648A) Microcontrollers (also known as embedded controllers) are microcomputers. Unlike personal computers, microcontrollers are computers that are designed to carry out a specific function [11]. The microcontroller named PIC16F648A is employed in the development of a wireless sensor network on agricultural environment to monitor environmental conditions and deduce the appropriate environmental parameters required for the high yield of crop production on a given farmland. The PIC16F648A belongs to a class of 8-bit microcontrollers of RISC architecture. It is an 18 pin dual in-line package chip. The PIC16F648A is a tiny but complete computer. It has a CPU (central processing unit), program memory (PROM), working memory (RAM), and two input-ports. The CPU is the "brain" of the computer. It reads and executes instructions from the program memory. As it does so, it can store and retrieve data in working memory (RAM). CPUs make a distinction between "registers" located within the CPU and "RAM" outside it; the PIC does not, and its generalpurpose working RAM is also known as registers." On the 'F648, there are 68 bytes of general-purpose RAM, located at addresses C to hex 4F. Besides the general-purpose memory, there is a special "working register" or register" where the CPU holds the data its working on. There are also several special function registers each of which controls the operation of the PIC in some way. The program memory of 'F648 consists of flash EPROM; it can be recorded and erased electrically, and it retains its contents when powered off. Program memory (FLASH)- for storing a written program. Since memory made in FLASH technology can be programmed and cleared more than once, it makes this microcontroller suitable for device development. EEPROM - data memory that needs to be saved when there is no supply. It is usually used for storing important data that must not be lost if power supply suddenly stops. Many other PICs require ultraviolet light for erasure and are not erasable if you buy the cheaper version without the quartz window. The chip, however, is always erasable and
31
International Journal of Applied Information Systems (IJAIS) – ISSN : 2249-0868 Foundation of Computer Science FCS, New York, USA Volume 7– No. 3, May 2014 – www.ijais.org
RA2/AN2/Vref RA3/AN3/CMP1 RA4/T0CKI/CMP2 RA5/MCLR/VPP VSS RB0/INT RB1/RX/DT RB2/TX/CK RB3/CCP1
1
18
2
17
3
16
4
15
5
PIC16F648A/P 14
6
13
7
12
8
11
9
10
2.6 Power Supply Unit A step down transformer is used to step down the 220VAC to 12VAC. The 12VAC is rectified to obtain a dc voltage required to power the digital circuitry. Since the microcontroller requires a 5-volt supply, a voltage regulator (78L05) is used to regulate the rectified, filtered 12VDC to 5VDC desired. Figure 2.12 shows the power supply unit for the design.
220VAC
12VAC
reprogrammable. There are two input- output ports, port A and port B, and each pin of each port can be set individually as an input or an output. The bits of each port are numbered, starting at 0. In output mode, bit 4 of port A has an open collector (or rather open drain); the rest of the outputs are regular CMOS. The CPU treats each port as one 8-bit byte of data even though only five bits of port A are actually brought out as pins of the IC. PIC inputs are CMOS-compatible; PIC outputs can drive TTL or CMOS logic chips: Each output pin can source or sink as long as only one pin is doing so at a time. The PIC16F648A under consideration is depicted in Figure 2.10. It has a total of 18 pins. It is most frequently found in a DIP18 type of case but can also be found in SMD case which is smaller from a Dual in Package (DIP). SMD is an abbreviation for Surface Mount Devices suggesting that holes for pins to go through when mounting, are not necessary in soldering this type of a component.
1
78L05 3
+5VDC
2 2200µF
100µF
RA1/AN1 RA0/AN0 RA7/OSC1/CLK IN RA6/OSC2/CLK OUT VDD RB7/PGD
Figure 2.12: Power Supply Unit Using a 240V transformer on a 50Hz supply and transformer secondary r.m.s voltage output is 12V.
RB6/PGC RB5 RB4/PGM
Figure 2.10: The pin out orientation of the PIC16F648A
2.5 The Transceiver As shown in Figure 2.11, the Nordic RF transceiver was used to transmit the received signals wirelessly from the sensor nodes to the master microcontroller. The transmitter transmits with a frequency of 533Hz. It consists of a transmitting and receiving module. The frequency of this transceiver can be varied between 315MHz to 415MHz.
The total voltage drop, , for the two diodes involved in the rectification process in either of positive or negative cycles,
Actual peak voltage value,
Change in peak voltage value over the discharge period,
The filter capacitor should not discharge down to 6V in accordance with the input voltage specification of the voltage regulator. Change in time over the discharge period, Total current consumption for this design is not expected to exceed 600mA Hence the value of the filter capacitor is obtained thus: μ To provide a safety margin, the capacitor value chosen is twice the calculated value which implies a value 2154.4µF. The nearest available capacitor on sale is of value 2,200µF is used as the filter capacitor.
2.7 The Implementation of the Developed Wireless Sensor Network
Figure 2.11: The Transceiver
The implementation of this project was done on the breadboard. The power supply was first derived from a bench power supply. To confirm the workability of the circuits before the power supply stage was soldered, the implementation of the design on bread board was successful explored. It met the desired aims with each stage performing as designed.
32
International Journal of Applied Information Systems (IJAIS) – ISSN : 2249-0868 Foundation of Computer Science FCS, New York, USA Volume 7– No. 3, May 2014 – www.ijais.org
2.7.1 Soldering, casing and boxing The various circuits and units of this project were soldered in tandem to meet desired workability of the project. The power supply stage was first soldered before the microcontroller, digital (seven segment) display and transistor switching stages were done. The soldering of the project was done on a Veroboard, and was soldered on two Vero boards. The first Vero board contains the power supply stage, the microcontroller stage with the temperature detection stage and the second Vero board contains transistor switching. Figure 2.13 shows the soldering and component arrangement on the various Vero board. Veroboard has the power supply stage which includes the rectification stage, filtering stage and the voltage regulation stage; and the microcontroller stage.
Figure 2.15: Isometric View of the Transmitting Unit
2.7.2 User interface for wireless sensor for agriculture’s application The user interface has two nodes, namely Node 1 and Node 2. These nodes specify the required data or parameters (Humidity, Light intensity and Temperature) which vary by different logged times as shown in Figure 2.16. These itemized information can be collected by logging time intervals usually in minutes which can be more or less in the range of five minutes to an hour in which the time logged in automatically synchronizes with the microcontroller. Figure 2.13: Components layout on Vero-board The next phase of the project construction is the casing of the project. This project was coupled to a plastic casing. The casing material being plastic designed with special perforation and vents. Figure 2.14 depicts the isometric view of the design receiving unit while Figure 2.15 depicts the isometric view of the transmitting unit.
Figure 2.16: User Interface
2.7.3 Testing
Figure 2.14: Isometric View of Receiving Unit
Stage by stage testing was done according to the block representation on the breadboard, before soldering of circuit commenced on Vero board. The process of testing and implementation involved the use of some test and measuring equipments stated below.
33
International Journal of Applied Information Systems (IJAIS) – ISSN : 2249-0868 Foundation of Computer Science FCS, New York, USA Volume 7– No. 3, May 2014 – www.ijais.org i)
Bench Power Supply: This was used to supply voltage to the various stages of the circuit during the breadboard test before the power supply in the project was soldered. Also during the soldering of the project the power supply was still used to test various stages before they were finally soldered. ii) Oscilloscope: The oscilloscope was used to observe the ripples in the power supply waveform and to ensure that all waveforms were correct and their frequencies accurate. The waveform of the oscillation of the crystal oscillator used was monitor to ensure proper oscillation at 12MHz. iii) Digital Multi-meter: The digital multi-meter basically measures voltage, resistance, continuity, current, frequency, temperature and transistor . The process of implementation of the design on the board required the measurement of parameters like, voltage, continuity, current and resistance values of the components and in some cases frequency measurement. The digital multimeter was used to check the output of the voltage regulators used in this project.
3. CONCLUSION AND RECOMMENDATIONS 3.1 Conclusion In conclusion, it can be deduced that the project which is the design and construction of the wireless sensor network for agricultural set-up was designed considering some factors such as economic application, design economy, availability of components and research materials, efficiency, compatibility and portability and also durability. The project factored into its implementation, the use of sensors, transceivers, and power supply unit. The performance of the project after test met design specifications. However, the general operation of the project and performance is dependent on the user who is prone to human error such as entering wrong timing. Also, the operation is dependent on how well the soldering is done, and the positioning of the components on the Vero-board. If poor soldering lead is used, the circuit might form dry joint early and in that case the project might fail. Also if logic elements are soldered near components that radiate heat, overheating might occur and affect the performance of the entire system. Other factors that might affect performance include transportation, packaging, ventilation, quality of components, handling and usage. The construction was done in such a way that it makes maintenance and repairs an easy task and affordable for the user. The designed wireless sensor network for monitoring environmental condition on farmland involves research in both microelectronics and embedded system design.
3.2 Recommendations For the purpose of the future research, development of a wireless sensor network on agricultural environment to monitor environmental conditions on a given farmland can be improved upon. The following areas were highlighted for this purpose. i) A higher scale integrated circuit can be used so that other means of authentication could be used to cut
ii)
across to the less privileged in the society (for example, visually impaired individual). It can also be recommended that the future research should be geared towards evaluation and simulation of three environmental parameters under consideration.
4. REFERENCES [1] George, (2004): Wireless Sensor Networks: Application in Agriculture, University of Georgia. [2] Lewis, G. and Jeremy, E. (2004): A software environment for developing and deploying wireless sensor network, Proc. Conf. USENIX Annual Technical Conf., Boston, USA. [3] Satyanarayana G. V. and Mazaruddin S. D. (2013): Wireless Sensor Based Remote Monitoring System for Agriculture Using ZigBee and GPS, Conference proceeding on Advances in Communication and Control Systems, pp. 110- 114. [4] Jayashree L. S., Yamini V. K. and Priya R. M. (2010): A Communication Efficient Framework for Soil Moisture Monitoring using Wireless Sensor Networks, Vol. 1, No. 16, pp. 17-27. [5] Ghobakhlou A., Shanmuganthan S. and Sallis P. (2009): Wireless Sensor Networks for Climate Data Management Systems, 18th World IMACS / MODSIM Congress, Cairns, Australia, pp. 959-965. [6] Luís M. L. O and Joel J. P. C. R. (2011): Wireless Sensor Networks: a Survey on Environmental Monitoring, Journal of Communications, Vol. 6, No. 2, pp. 143-151. [7] Nabarun B., Lahari S., Abhra P., Jayanta K. R. and Rajiv M. B. (2012): Decision support system for tea plantation management using wireless sensor Network, Two and a Bud 59, Vol.2 pp. 89-92. [8] Madhav B. and Anagha R. (2012): Wireless Sensor Network: A Promising Approach for Distributed Sensing Tasks, Excel Journal of Engineering Technology and Management Science, Vol.1, No. 1, pp. 1-9. [9] Elias E. D. (2013): Wireless Farming: a mobile and Wireless Sensor Network based application to create farm field monitoring and plant protection for sustainable crop production and poverty reduction, Master Thesis, Department of Computer Science, School of Technology, Malmö University. [10] Wen-Yaw C., Jocelyn F. V. and Janine T. (2013): Wireless Sensor Network Based Soil Moisture Monitoring System Design, Position Papers of the 2013 Federated Conference on Computer Science and Information Systems, pp. 79–82. [11] Ganiyu R. A., Arulogun O. T., Adetunji A. B. and Okediran O. O. (2011): Development of a GSM Based Household Power Management System, British Journal of Science, Vol. 1, No. 2, pp. 1-14.
34