DEVELOPMENT OF AN AUTOMATED DYNAMIC CONE PENETROMETER FOR.
EVALUATING SOILS AND PAVEMENT MATERIALS. Final Report.
DEVELOPMENT OF AN AUTOMATED DYNAMIC CONE PENETROMETER FOR EVALUATING SOILS AND PAVEMENT MATERIALS
Final Report Project: FLDOT-ADCP-WPI #0510751
by Frazier Parker Mike Hammons Jim Hall
Highway Research Center Auburn University, Alabama
for Florida Department of Transportation Gainesville, Florida
July 1998
.'
ACKNOWLEDGMENTS
This report Was prepared by the Auburn University Highway Research Center and Applied Research Associates, Inc. in cooperation with the State of Florida Department of Transportation and the U. S. Department of Transportation. The opinions, findings and conclusions expressed in this publication are those of authors and _not necessarily those of the Florida Department of Transportation.
ABSTRACT
The correlation between the resistance to the penetration of cone penetrometers has historically been used to estimate in situ soil and paving material strength. This report reviews the literature related to the use of dynamic cone penetrometers (DCP) for evaluating soil and paving material strength. Manually driving the penetrometer, recording blows versus penetration, and extracting the device is a somewhat tedious process. Automation of this process means more efficient and cost effective data collection, and the design, fabrication and operation of an automated dynamic cone penetrometer (ADCP) is described. Demonstration and calibration tests with the ADCP in typical Florida paving materials and subgrade soils were conducted. Analysis of the data from these tests demonstrates the strength of Florida paving materials and subgrade soils can be readily estimated with data from the ADCP and existing correlations.
Additional research to establish
relationships between laboratory/design strength parameters and field strength parameters estimated with the ADCP will be required to effectively utilize the ADCP for construction control.
ii
TABLE OF CONTENTS
ACKNOWLEDGMENTS ............. ....... .. ........... .. .. .. ... .... ....... . ABSTRACT .. . . .. . .... .. ...... .. ........................... .. ............. ii TABLE OF CONTENTS . . . . . . . . . . . . . . . . . . . . . . . . . . . . . . . . . . . . . . . . . . . . . . . . . . . .. iii LIST OF TABLES ............... ..... ....... . ..... . .......... ... ............ v LIST OF FIGURES . . . . . . . . . . . . . . . . . . . . . . . . . . . . . . . . . . . . . . . . . . . . . . . . . . . . . . . .. vi INTRODUCTION ........................................................... 1 Background ......... .. ...... ....... .................... . .. ... ........ ... 1 Automation ................. ... .......................... . .............. 2 Correlations ................................. .... ....................... 4 Applications .............. .. ...................... ..... .... ............. 8 OBJECTIVE .. .. ........................................................... 9 SCOPE ................................................ . ............... . .. 9 ADCP DESIGN AND FABRICATION ............ . .. ............................ 10 Design Criteria .................................... ..... . ....... ...... .. 10 Design Considerations ................................................... 11 Trailer ........ .... .................................................... 14 Mast ...... .......................... . ....... .......... .......... ... . . 14 Hammer Lift Mechanism ....... ....... . ....... . ........ ......... .......... 16 Hammer Catch/Release Mechanism ........................................ 17 Carriage Positioning .............. ........... ..... . ...................... 17 Depth Measurement ................... .... . ........................... .. 18 Penetrometer ................... ............ . . . .......... .. ...... ...... 20 Control and Data Acquisition System ..... .. ................................. 20 Power Supplies .... .... .. . ........ . ... ..... .......... . .................. 21 ADCP OPERATION ..... .................. .. ............. ... .. ........ ..... 22 Preparation ......... ............................................. .. .... 22 DCP Probe Assembly . ... . . ....... . ............... ......... .... .... ...... 22 Operating Procedure ................ .... . . . ............. . .. . .. .. ........ 24 Transporting Procedure ......... ...... ... ................................ 26 Battery Charging Procedure ............ ........ . .. ..... .............. ..... 27 Routine Maintenance Procedures ...... . .......... .. ....... .. ............ .. 27 TEST PIT AND FIELD STUDIES .. . .. . ........................................ 28 Test Pit Descriptions ............. ... ..... .... ............... ....... . ..... 28 Field Test Descriptions ... . ............... .. .............................. 31 DCP Testing .. ............... ... .................. ... ... ............... 31
iii
ANALYSIS .............................................................. . 35 Pavement Strength Profiles .... ..... ........ ........... .... . . . ..... ....... 35 Correlations of DCPI and LBR ................ . ...... . ...... . .............. 40 Reduced Hammer Drop Height ..................... ... .................... 46 Effects of Confinement ... ....... ......... ... ........ . .. ....... ........ ... 50 Effects of Moisture and Density ....... . ................................ .. .. 52 CONCLUSIONS AND RECOMMENDATIONS ..... . . ....... ..... ........ ........ 57 REFERENCES . . ................... .... ..................... . ........ . .... 58
iv
LIST OF TABLES
Table 1. Test Pit Studies ... . .. ... . . . . . . ...... . . . .... .. . . . ... . .. ... .. ... .. ... 28 Table 2. Laboratory and Field LBR Data .... . .... .. . . . . . .. . . .. . ....... . . . .. . .... 30 Table 3. Field Studies ............. .......... ....... ... . . .. ............ .. ... 31 Table 4. LBR Predicted from DCPI . . . . . .. ... ... . .... . .. . .. ... . ............... . 33 Table 5. LBR Data Demonstrating Effect of Surcharge Pressure ... . .. .. . ... . . .. . . ... 34 Table 6. DCP Depth Required to Measure Surface Layer Strength . . .. ........ , . ... . . 53
v
LIST OF FIGURES
Figure 1.
Oual Mass OCP ... ...... . .... .. . .. ...... .... ....... .... ........ . . . 3
Figure 2.
Various Correlations for Estimating CBR from OCPI . .............. . . . . . .. 5
Figure 3.
CBR vs DCPI Correlation Adopted from Webster Grau and Williams (5) .... ... 7
Figure 4.
Schematic of ADCP .... .. .......... .. .... .. .. . . ........ .... . . ..... 12
Figure 5.
Photograph of ACOP Trailer Prepared for Conducting Test .... . ......... . . 13
Figure 6.
Rear View of ADCP Trailer . ...... .. .. ................... . .......... 15
Figure 7.
Close-up Photograph of the Carriage Components During Test Conduct ..... 19
Figure 8.
OCP Probe Assembly Diagram .... ............. .. . .. . . .... ..... . . . .. 23
Figure 9.
Test Pit Layout .......................... ...... ... ........... ... .. 29
Figure 10. Strength Profile for Test Pit Series 1, West Section, A-2-4 Clayey Sand ... ... 37 Figure 11. Strength Profile for Test Pit Series 2, East Section, A-2-4 Marl ....... ...... 37 Figure 12. Strength Profile Test Pit Series 2, West Section A-1-b Coarse Sand ... ...... 38 Figure 13. Strength Profile for 1-75, A-3 Sand Subgrade Section ................. . . .. 38 Figure 14. Strength Profile for 1-75 Limerock Base Section .... . ........ ...... ...... 39 Figure 15. Strength Profile for SR 326, Limerock Base and Limerock Stabilized Subgrade 39 Figure 16. Comparison of Automated Manual DCP Penetration Resistance in A-2-4 Soil ...... ...... ..... ... .. ............. .............. .. .. 42 Figure 17. Comparison of Automated and Manual DCP Penetration Resistance in Limerock Base and Stabilized Subgrade, Test Pit Series 2, Center Section ... 42 Figure 18. Comparison of DCPI from Automated and Manual DCP ........ . . .... .. .. 43 Figure 19. Comparison of Average LBR Computed with Manual and Automated DCPI ... 44 Figure 20. Comparison of Data for Florida Soils and Paving Materials with CBR/OCPI Correration. . .. . .. ...... .... ..... . .. . . .... .. . ... ... .. . .. 45 Figure 21. Comparison of DCPI for Full and Half Drop Heights . ............ .... ... . . 48 Figure 22. Comparison of DCPI for Full and Quarter Drop Heights ....... .. .. ... .. . .. 49 Figure 23. Effects of Vertical Plate Pressure on LBR Measured with DCPI . . . . ....... .. 51 Figure 24. Effects of Limerock Base Layer on Strength of A-1-b Sand .. .............. 52 Figure 25. Effect of Saturation on Stability of Compacted Samples of Sandy Clay (after Seed (14)) .... .. ...... . . . ..... .... ...... ..... ....... . . . .... 55 Figure 26. Adjustment of Field LBR for Saturation ...................... . ......... 57 vi
INTRODUCTION Background
There is a direct correlation between the strength of soil and paving materials and the resistance to their penetration by solid objects, in particular cone penetrometers. This correlation has historically been used to estimate in situ soil and paving material strength by measuring penetration resistance. Fenwick (1) describes military applications of the airfield cone penetrometer and the trafficability cone for decisions regarding operations of aircraft and vehicles on unsurfaced soils. The devices are pushed by hand into the soil and the required force measured. This process limits the strength of soils and depths which can be evaluated.
In addition, there can be
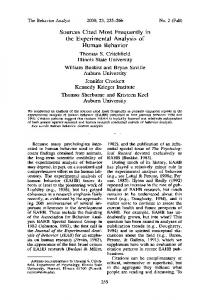
considerable variability between operators and correlations with soil strength properties, such as CBR, are generally poor. Croney and Croney (2) report a hand held cone penetrometer used in England to check uniformity of subgrade construction and to indicate in situ CBR. Correlations are found reasonable for fine grained soils but not for granular soils. Driving a device, i.e., dynamic cone penetrometer (DCP), alleviates many of the deficiencies of systems that are manually pushed into soil or paving materials. The device remains relatively simple in design and operation, but permits testing soils and paving materials with a full spectrum of strength to depths that are typically considered sufficient. Operator variability is reduced and correlations with strength parameters are more accurate. The concept for currently used DCP's was originally formulated and developed in South Africa (3,4). The DCP consists of a steel rod with a cone at one end which is driven into the pavement structure and subgrade by means of a sliding hammer. Material strength is indicated by the penetration achieved (usually in millimeters) per hammer blow. The cone has an angle of 30 degrees with a diameter of 20 mm. The hammer mass is 8 kg with a drop height of 575 mm. The
1
version of the OCP adopted for automation contains several modifications proposed by researchers at the Waterways Experiment Station, Vicksburg, MS (5). Modifications, illustrated in Figure 1, include a cone angle of 60 degrees and the option to use a 4.6 kg hammer for weaker soils. Automation Operating the OCP, particularly extracting the cone, can be physically arduous and the collection and manipulation of data tedious and time consuming. These restrictions tend to limit testing that can be reasonably accomplished with the OCP and has lead to efforts to automate the operation, data collection and analysis procedures, i.e., the automated dynamic cone penetrometer (AOCP). Livneh, Ishai and Livneh (6) describe an AOCP developed by the Israeli Institute of Technology. The AOCP consists of a pneumatic system for raising the OCP weight, a vertical frame with wheels for carrying the OCP hammer lifting and release mechanism and the penetration rod. The weight is lifted to the proper height by the pneumatic cylinders and released to fall freely at the prescribed drop height. Ese, Myre, Noss and Vaerness (7) describe an AOCP fabricated in Norway. In the Norwegian design, the OCP is suspended by a chain mounted onto a wheel to insure a vertical orientation. The hammer is lifted by two pneumatic shuttle cylinders which follow as the rod penetrates into the subgrade. Penetration is measured by a rotary encoder on the chain wheel and sent to a PC. The pneumatic cylinders operate the hammer in reverse direction to remove the rod at completion of a test.
2
Handle Hammer (8 or 4.6 kg)
E E It) ...... It)
-Anvil
E Q)
E :c
o
.~
16 mm diam Steel Rod
~2,
~-Cone
THE CONE
~
Cone Angle 60 deg
~20mm Figure 1. Dual Mass DCP
3
Managing Technology Incorporated of Overland Park, Kansas designed and fabricated an AOCP for the Minnesota Oepartment of Transportation.
The trailer-mounted device uses
hydraulic cylinders to erect the test frame and to automatically lift the hammer. The hammer falls freely, and the number of hammer blows and penetration for each blow are automatically recorded on a laptop computer. The design and fabrication of the AOCP by Vertek for this project is described later in the Oesign and Fabrication chapter. Correlations Correlations for estimating subgrade soil and paving material strength from cone penetration resistance are most often in the form of equations for CBR as a function of OCP Index (penetration per blow). The following are examples of empirical correlations where OCP Index (OCPI) is expressed in units of millimeters per blow: Log (CBR) = 2.62 - 1.27 Log (OCPI) . . . . . . . . . . . . . . . . . . . . . . . . . . . . . . . . . . . .. (1) (Ref. 4) Log (CBR) (Ref. 8)
= 2.56 - 1.15 Log (OCPI) . . . . . . . . . . . . . . . . . . . . . . . . . . . . . . . . . . . ..
(2)
CBR = 269/0CPI . . . . . . . . . . . . . . . . . . . . . . . . . . . . . . . . . . . . . . . . . . . . . . . . . . .. (3) (Ref. 9) Log (CBR) (Ref. 10)
=2.20 - 0.71 [Log (OCPI)t
Log (CBR) (Ref. 11)
= 2.81
5
•• • ••• • .• • • • • •. . . • • • • • • • • • • • • •• •• •
(4)
- 1.32 Log (OCPI) . . . . . . . . . . . . . . . . . . . . . . . . . . . . . . . . . . . .. (5)
Log (CBR) = 2.669 - 1.065 Log (OCPI) . . . . . . . . . . . . . . . . . . . . . . . . . . . . . . . . . .. (6) (Ref. 7) The above correlations are graphically displayed in Figure 2, which illustrates their similarity.
4
100
."'-
""'" ~
~ ,
100
"""'l~
~~
~ ~~ ~
""""
""~ """ ~
~~~ ~
~
~
I~ ~
r'(
~~~
~~
,--..,
~
'-'
~
e
10
r-r-r-r--
-a- Log(CBR) =2.62-1.27*Log(DCPI) -+- Log(CBR)
,~
"'" '" "
=2.56-1. 15*Log(DCPI)
r--
-Ar--
~ "f 0-.. ,,~
'" "'~ '~"
f--
01
~ ~
CBR =269IDCPI
=2.20-0.71 *[Log(DCPI»),,1.5
-Log(CBR)
-
---.- Log(CBR) =2.81-1.32*Log(DCPI)
~
~ "r'-.. ~
~ """ ~
""" '" ~
~ ~ ~~ " ~ ~0 ~
~
1" N~ ~
""
--e- Log(CBR) =2.669-1.065*Log(DCPI) I
1
""" "
~
I ~~
I-
1
10
10 DCP Index, mmlblow Figure 2. Various Correlations for Estimating CBR from OCPI
,
1
100
The following correlation, proposed by Webster, Grau and Williams (5), was adopted for use in the analysis software for the AOCP developed by Vertek: CSR
= 292/(OCPI)1 .12
.......... ......... ... .. ............ ... . .. ..... . (7)
The above equation is shown in Figure 3 along with the data used for its development. Comparison with Figure 2 indicates similarity with those correlations. Also shown in Figure 3 are the following relationships for high plasticity clay soils (CH) and low plasticity clay soils (CL) with CSR
rt,,/HA~~I:R DR
JJ
(4)
(10.1 LBS'>
SE1' SCREIJ ANVIL (IIELDED TO BOT. ROD) (3)
BOTTOM ROD (2)
TIP
(tl
Figure 8. DCP Probe Assembly Diagram
23
Operating Procedure 1. Obtain utility clearance prior to conducting any test. 2. Locate trailer near or at test location. 3. Tilt front trailer jack 90° and lower to ground to stabilize front of trailer. 4. Unlock and open environmental/security enclosure lid to full extension. 5. Remove rear panel of environmental/security enclosure and store in a secure location. 6. Release EMERGENCY STOP button located on the carriage assembly and place INVERTER SWITCH in the "ON" position and MAIN POWER SWITCH in the "ON" position. 7. Lower both rear trailer jacks until both trailer wheels are off the ground. 8. Loosen two clamping handles on the mast main pivot shaft. 9. Using the MAST RAISE AND LOWER ROCKER SWITCH, located on the side of the right rear jack, raise the DCP mast to vertical position. 10.
Close main enclosure lid.
11.
Use BULLSEYE LEVEL located on the lower right corner of the carriage assembly to plumb the DCP mast by adjusting the height of the two rear jacks and angle of the DCP mast.
12.
Open the right hand enclosure and install portable personal computer. Make sure all electrical connections are plugged in properly and secured.
13.
Open the left hand or electronics enclosure. Move the AC POWER switch and the DC POWER switch to their "ON" positions.
14.
Raise carriage assembly to the highest load position by switching CARRIAGE AUTO/MANUAL rocker switch to "MANUAL" and press "UP" on the CARRIAGE UP/DOWN rocker switch. When carriage stops moving upward, release rocker switch.
15.
Switch CARRIAGE AUTO/MANUAL switch to "AUTO" and close enclosure door. Door should remain closed for entire test to prevent dust and debris from damaging electronics.
16.
Remove lower clamping assembly on the carriage assembly by removing the two thumb screws.
17.
Load the DCP probe assembly into the carriage assembly by sliding the handle portion of the probe up through the upper clamping assembly and resting anvil of the probe on the lower plate of the carriage assembly.
24
18.
Install lower clamping assembly to hold probe in proper location and secure all thumb screws.
19.
Locate probe assembly by sliding mast back and forth to proper location and secure position by tightening the two clamping handles.
20.
Boot computer in the right hand enclosure. Double click on the ADCP icon on the main screen and follow instructions as provided by the computer. The main screen gives the operator the option of starting a test, exiting the software, or retracting the rod. The operator is also prompted to select the measurement system to use, English or metric. The software will display the selected units but will save the data to file in metric only. The software returns to this screen between tests. Selecting EXIT or pressing F1 will put the DCP in shutdown configuration and exit the software. F1 may be used anytime during the test (but is not recommended.). Pressing F9 will pause the operation of the DCP. The operator then has the option of continuing or ending the test. F9 may be used anytime during the test and is the recommended method of stopping.
21.
Select START to begin a test. The User Input Screen is displayed. The following information is written to the header of the data file. Filename
The name of the data file for this test. A new filename must be entered for each test. Any duplicate filename will overwrite an existing file.
TestlD
Any information concerning the test which needs to be placed in the data file.
Operator Test Information Soil Type
22.
Weight Type
OCP mass being used.
Drop Height
The height in mm which the weight is to be dropped.
Max Depth
The maximum depth in mm for the test. This is an end condition and the test will be stopped when this depth is reached. Additional blows can be added after the test has stopped if further penetration is desired.
Max Blows
The maximum number of blows. This is an end condition and the test will be stopped when the specified number of blows has been reached.
Select START TEST to begin the test. The DCP will initialize itself by lowering the DCP rod to the ground and positioning the carriage. The motor will seek home position below the weight. The computer screen will display "LOWERING TO GROUND" or "HOMING". Once the system in initialized, the test will automatically begin.
25
23.
The weight will be lifted and dropped and the Blow Count, Depth in mm, and time will be written to the data file every cycle. The current depth in mm (or inches) and blow count is displayed in the screen as the test is running. The test will continue until paused by the operator, the maximum depth is reached, or the maximum blow count is reached. If the system is paused using F9, the operator has the option of continuing the test or ending the test by selecting the appropriate button on the screen.
23.
If the maximum depth is reached the test is stopped and the operator will be prompted to end or continue the test. To continue, the operator must specify a new maximum depth. If the maximum blow count is reached the test is stopped and operator will be prompted to end or continue the test. To continue, the operator must specify a new maximum blow count.
24.
Once the test is ended, the operator is prompted to retract the rod, the data file is closed, and the software returns to the main screen.
Transporting Procedure 1. Remove portable computer from the right hand enclosure, close and secure door. 2. Switch both AlC AND D/C POWER switches located in the left hand enclosure to the "OFF" position. Close and secure enclosure door. 3. Remove the DCP probe assembly from the carriage assembly. Disassemble probe assembly and return to transport location provided on the inside of the enclosure. The lower anvil assembly must be placed in first with the anvil end being against the rear of the enclosure. Then place upper handle assembly in location with handle end against the front of the enclosure. Secure in place with clamps and thumb screws provided. Slide weight onto transport rod and secure in place with cotter pin provided. 4. Loosen the mast clamping handles and locate mast between two red lines engraved in the mast main pivot shaft. This is very important so that there is no obstruction to cause injury or damage when mast is lowered. 5. Open main enclosure lid to full extension. 6. Raise rear trailer jacks as far as they will go to prevent damage during transport. 7. Lower mast by pushing downward on the mast raise/lower rocker switch located on the side of the right rear trailer jack. Lower mast until mast rests on rubber pad provided. 8. Switch the INVERTER and MAIN POWER switch to the "OFF" position.
9. Push in the EMERGENCY STOP button located on the main carriage assembly. This ensures that all power has been shut down.
26
10.
Replace enclosure rear panel.
11.
Close and secure main enclosure lid to prepare the trailer for transport.
Battery Charging Procedure
1. Open main enclosure lid to full extension and release the EMERGENCY STOP button by turning the button and causing it to pop out. This turns on the emergency stop solenoid which enables the inverter/charger to charge the battery. 2. Close and secure main enclosure lid. 3. Plug in 110 VAC power chord to the receptacle provided on the front right corner of main enclosure. This will charge the on board battery. Routine Maintenance Procedures
Trailer Maintenance 1. Check ball coupler for operation. 2. Check safety chains for damage or wear. 3. Grease main axle bearings (grease fittings provided on both ends of axle). 4. Keep battery fully charged. 5. Keep lights running properly.
Main Mast Maintenance 1. Apply light coat of 30W oil to main pivot shaft. 2. Apply light coat of 30W oil to carriage slide shafts. 3. Apply light coat of 30W oil to guide surface for main carriage on main wide-flange beam . 4. Grease main screw mechanism for lowering and raising the carriage assembly. 5. Check belts for damage or wear. 6. Weight release finger should slide freely.
27
TEST PIT AND FIELD STUDIES A series of test pit and field studies were conducted to demonstrate features and capabilities of the ADCP and to calibrate predictive correlations for typical Florida paving materials and subgrade soils. Field studies were conducted on pavement construction projects and test pit studies were conducted at the Florida DOT State Materials Office in Gainesville. Test Pit Descriptions The Florida DOT test pit facility is designed for constructing and testing soils and paving materials under controlled conditions.
The concrete pit is located in a building and has
dimensions shown in Figure 9. The soils and/or paving materials were spread and compacted in 5 - 6 in. lifts on an A-3 sand subgrade. Three sections (East, Center and West), comprised of different soils or paving materials, were constructed and tested in two series as outlined in Table 1. Water content, density and LBR tests were conducted as each lift of soil or paving material Table 1. Test Pit Studies Description
Series
Section
1
East
1
Center
A-2-4 Clayey Sand
1
West
A-2-4 Clayey Sand
2
East
A-2-4 Marl
2
Center
2
West
2
West Modified
A-2-4 Sand with Rock
12 in. Limerock Base on 12 in. Limerock Stabilized A-3 Sand A-1-b Coarse Sand 5 in. Limerock Base on A-1-b Coarse Sand
was placed. Averages from these tests are shown in Table 2. Similar data from laboratory tests and tests conducted in trenches excavated after completion of DCP testing (designated as "At Testing") are also tabulated in Table 2.
28
8'
West
~
8'
Center
8'
8'
East
__________________________________________
~ ~l
Plan
--------------------------------------------~, - ~ ~
..
-
- - - - _ PreILared-..Soils~nd Pavinz-MaterialL - - - - (5"- 6" Lifts)
20-24"
,~
~------------------------------------------~I -~ J~
A - 3 Sand Subgrade (LBR= 20)
L-__________________________________________
Elevation
Figure 9. Test Pit Layout
29
36"
~, _ ~
'If
Table 2. Lab Laboratory
As Constructed
At Testing
Soil Classification
w,O/o
Y.-I' pcf
LBR
w,%
Yd , pcf
LBR
w,%
YrI' pcf
LBR
Test Pit, Series 1, East Section
A-2-4 (13)*
9.2
119.2
45
7.3
96.3
10
5.8
39
Test Pit, Series 1, Center Section
A-2-4 (13)
7.1
119.5
75
7.4
97.4
32
5.1
Test Pit, Series 1, West Section
A-2-4 (29)
10.3
121.7
75
9.8
96.6
27
6.9
1-75, LR Base Section
L R Base
-
--
--
--
1-75, LR Base Section
Stab. s.9.
-
--
83
--
1-75, Stab. s.9. Section
Stab. s.9.
-
-
83
1-75, Sand s.9. Section
A-3
-
-
--
----
--
-----
A-2-4 (24)
8.5
128.7
126
124.1
40
Test Pit, Series 2, Center Section
LR Base
10.3
122.2
129
121.8
30
Test Pit, Series 2, Center Section
LR Stab. s.9., A-3 (8)
9.5
113.5
52
113.4
24
A-1-b (1)
11.3
105.7
26
104.7
7
LR Stab. s.9.
--
---
--
-----------
--------------
Description
Test Pit, Series 2, East Section
Test Pit, Series 2, West Section SR326, LR Base & Stab. s.g.
-
121 LR Stab. s.9. 12 SR26, LR Base & Stab. s.9. *Values in parentheses following classifications are % passing #200 sieve.
30
70 72
---
-
--
104 79 55
--35 71 32 52
---
Field Test Descriptions Testing was conducted on pavement construction projects on 1-75 in Hamilton County, on SR326 near Ocala, and on SR26 near Gainesville. Pertinent project features are tabulated in Table 3. The three sections on the 1-75 projects were completed to specifications through the limerock base, stabilized subgrade and unstabilized subgrade as described in Table 3. The distinguishing feature of the SR 326 project section was that the top 6 in. lift of a 12 in. limerock base was in place, but specified density had not been achieved. Two sections on the SR 26 project had 10 and 7 in. limerock base layers. Specified density had been achieved in the 10 in. limerock base layer, but not in the 7 in. limerock base layer. Limited laboratory moisture, density and LBR data for the stabilized subgrade layers on the field projects are included in Table 2. Field LBR values, run at the time of ADCP testing, are shown for the 1-75 limerock base and sand subgrade sections. No field LBR tests were run on the 1-75 stabilized subgrade section, the SR 326 project or the SR26 project. Table 3. Field Studies Location
Section
Description
1-75
LR Base
12.5 in. LR Base over 12" Stab. s.g.
1-75
Stab. s.g.
12 in. Stab. s.g.
1-75
Sand s.g.
A-3 Sand Subgrade
SR326
LR Base
12 in. LR Base over 12 in. LR Stab. s.g. Top 6 in. lift of LR Base not @ specified density.
SR326
10 in. LR Base
10 in. LR Base over 12 in. LR Stab. s.g.
SR326
7 in. LR Base
7 in. LR Base over 12 in. LR Stab. s.g. LR Base not @ specified density.
DCP Testing Manual and automated DCP tests were conducted in the test pits. The DCP was driven full depth through the 20-24 in. of prepared soil or paving material into the sand subgrade. Average 31
LBR values predicted with Equation 11 are summarized in Table 4. Averages for the entire and middle half depth are shown, except for the series 2, West Section, A-1-b sand. Consistent increases in LBR with depth that reflect the influence of confinement were observed for sands. For the A-1-b sand, averages for the top 6" and 12" are shown for comparisons. Only the ADCP was run during the field tests. At sections containing base and/or stabilized subgrade, the DCP was driven through the paving layers into the subgrade. At the 1-75, A-3 sand section, the DCP was driven approximately 24 in. (600 mm). Average LBR values predicted with Equation 11 are shown in Table 4 for the field sections. As with the test pit studies, averages for full and middle half depths are shown. An exception is the 1-75, A-3 sand subgrade section where averages for the top 6 and 12 in. are shown. To determine if the effects of confinement from overlaying material could be simulated, a series of ADCP tests were run through 3/4 in. dia. holes in 1 and 2 ft. dia. steel plates placed on the surface. The 1 ft. dia. plates were first used on the 1-75 field studies and no apparent effect observed. The 2 ft. dia. plates were added for the Series 2 Test pit studies. The plates were stacked to provide surcharge pressures of 0.21 to 0.84 psi. LBR data illustrating the influence of the plates are summarized in Table 5. After completion of DCP testing on the Series 2 West Section, A-1-b sand, a 5 in. limerock base was constructed to determine if its effects would be different from approximately 0.35 psi pressure from plates. The average LBR from these tests is also shown in Table 5.
32
Table 4. LBR Predicted from DePI
LBR from Automated DCP
Description
LBR from Manual DCP
Full Depth
Middle Half
Full Depth
Middle Half
Test Pit, Series 1, East Section
28
26
32
29
Test Pit, Series 1, Center Section
46
47
50
52
Test Pit, Series 1, West Section
72
82
71
82
1-75, LR Base Section, LR Base
48
64
--
--
1-75, LR Base Section, Stab. s.g.
48
48
--
-
1-75, Stab. s.g ., Section, Stab. s.g .
8
9
--
--
1-75, Sand s.g., Section, A-3 Sand
9*
12**
--
-
Test Pit, Series 2, East Section, Marl
53
59
49
60
Test Pit, Series 2, Ctr. Sec., LR Base
92
90
84
87
Test Pit, Series 2, Ctr. Sec., Stab. s.g.
70
73
80
83
Test Pit, Series 2, West Sec., A-1-b Sand
7*
13**
3*
7**
SR 3226, Top 6" LR Base, No Density
80
82
--
--
SR 3226, Bot. 6" LR Base, Density
134
140
--
SR 3226, LR Stab. s.g.
51
50
--
---
SR 26, 10" LR Base, No Density
103
97
--
--
SR 26, LR Stab. s.g.
120
127
SR 26, 7" LR Base, No Density
65
66
---
SR 26, Stab. s.g.
31
26
--
---
*Top 6" (150mm) **Top 12" (300mm) Sands show consistent increase in LBR with depth reflecting effects of increased confining stress.
33
Table 5. LBR Data Demonstrating Effect of Surcharge Pressure LBR
l' Dia. Plate
2' Dia. Plate
With No. Plates
0.21 psi
0.42 psi
0.84 psi
0.28 psi
0.49 psi
5" LR Base
51
44
-
54
-
-
--
1-75, Stab. s.g. Sec., Stab. s.g.
8
10
10
9
--
-
--
1-75, Sand s.g. Sec., A-3 Sand
8
8
10
9
-
-
Test Pit Series 2, East Sec., Marl
63 92
--
---
62
Test Pit Series 2, Center Sec., LR Base
---
-
80
-
-
Description 1-75, LR Base Sec., LR Base
14 10 Test Pit Series 2, West Sec., A-1-b 10 15 Sand LBR values are for 12" LR Base and sta. s.g. layer thicknesses and for the top 12" of subgrades.
34
25
ANALYSIS Data from test pit and field studies were analyzed to demonstrate features and capabilities of the AOCP and to calibrate correlations for predicting strength of typical Florida paving materials and subgrade soils. The following sections will 1. Examine some of the features of pavement strength with depth profiles that may be detected with the AOCP, 2. Compare data from test pit and field studies with correlations for predicting soil and paving material properties from OCPI, 3. Investigate reduced hammer drop heights for soft and weak soils, and 4. Examine the effects of confinement, moisture content and density on strength parameters estimated with OCPI.
Pavement Strength Profiles Changes in resistance as a cone penetrometer is driven through a pavement structure can provide a strength profile with depth. Typically strength increases as pavement layers are sequentially added above the subgrade. This increasing strength is partially due to increased material quality, but the improved compaction that can be achieved as succeeding layers are placed is also a factor. For granular or cohesionless materials, confinement and, therefore, depth also affects strength. For cohesive materials, confinement has minimal effect on strength. Figures 10 and 11 are plots of ADCP derived LBR versus depth for Test Pit Series 1, West Section, a clayey sand with 29% passing the #200 sieve and Series 2, East Section, a marl with 24% passing the #200 sieve. These plots illustrate typical profiles for cohesive soils that have relatively uniform strength with depth. The strength profiles, particularly Figure 10, also illustrate low strength at the top and bottom which is typical for soil and paving materials placed and compacted in layers. The first lift may not achieve complete compaction because of shifting and yielding of the subgrade. Subsequent layers are better compacted as their foundations become stiffer. The top lift may be weaker
35
because it has received compaction energy only during its compaction, whereas, lower layers receive additional energy from the compaction of above layers. In addition, the top layer has no confinement which may reduce strength. Figures 12 and 13 illustrate typical strength profiles for cohesionless soils. The indicated increase in strength with depth reflects the obvious increase in confinement with depth. Figure 13 also illustrates the ability of the ADCP to detect abrupt changes in strength that may occur at cutlfill boundaries. Figures 14 and 15 illustrate strength profiles through limerock base and stabilized subgrade layers. Specified density had been achieved in all layers in Figure 14, and the profile illustrates the increase in strength achieved as layers are added. The weaker portions, top and bottom, of the 12 Y2 in. limerock base are thought to accurately reflect lack of confinement and or compaction, but are typical of good and acceptable limerock base construction. Subsequent placement and compaction of asphalt concrete binder and surface layers would strengthen the top portion of the limerock base layer and it would provide the structural capacity expected of a 12 Y2 in., LBR
= 100 base course.
The predicted LBR profile through the limerock base layer raises an issue that must be addressed in order to use the ADCP for acceptance during construction. Criteria as to what is acceptable must be set. This will require additional study, but examination of profiles from three field projects suggest the top and bottom 10 to 20% of a layer should not be considered, ie, layer acceptance should be based on achievement of minimum acceptable strength (for example LBR
= 100) in the middle 60 to 80% of a layer. The LBR variation through the limerock base layer in Figure 15 provides a clear illustration of the ability of the ADCP for detecting noncompliant construction. Required density had been achieved in the lower 6 in. lift and this is reflected by LBR
36
~
100. Required density had not been
LBR,% 10 0 100
50
,
100
~
200
""--
300 E E s!
..
~ ::::::J
,. .J-
400 500
C=-.
Q.
.!
~L
600
L--
T
A·2·4
Clayey Sand
~ A·3
Sand Subgrade
l
700 800 900 1000
Figure 10. Strength Profile for Test Pit Series 1, West Section, A-2-4 Clayey Sand
LBR,% 50
10
100
o 100 200
.J -
L
300 E E s!
..
Ie:=: ~
400
~
500
C r'--,
Q.
GI
C
600
r--'
700
T A·2·4 Marl
~ A·3
Sand Subgrade
BOO 900 1000
Figure 11. Strength Profile for Test Pit Series 2, East Section, A-2-4 Marl
37
LBR,% 1
o
10
5
.,
200
~
300
-
400
0- ..,-
A-1-b Coarse Sand
~
~
- .-
.s: 500 Cl.
c!
T
I
100
E E
100
50
~
600
,.
A-3 Sand Subgrade
Ic
700 800 900 1000
Figure 12. Strength Profile Test Pit Series 2, West Section A-1-b Coarse Sand
LBR,% 5
0 100 200 300 E E
50
10
'-- -1.
T
:-1
~ ~
A-3 Sand Fill
\1
r
400
.s: 500
a
c!
100
!
iL 'L .....,
CuI
600 I
700
[
800 900 1000
Figure 13. Strength Profile for 1-75, A-3 Sand Subgrade Section
38
LBR,% 50
10
100
o L
100
LR Base
200
r-
300 Lf-
E E
..
S£ Q. QI
C
t
S'
400
Stab. Subgrade
e::. .... I-
500
l.---r
6' Stab. Subgrade
SOO
I~
700
r-- ~
800 900
+
12-1/2 '
C
-
lr'
"
1000
Figure 14. Strength Profile for 1-75 LT Base Section
LBR,% 50
10
100
0
L>-- L-
100
i-
200
6" LR Base
300 E
400
..
500
!
SOO
r
r
,~ t-'
E
S£ Q.
6' LR Base Not at Density
6' Stab. Subgrade
S~ ...--'
l
700 r-
S' Stab. Subgrada
h..
p
800 900 1000
Figure 15. Strength Profile for SR 326, Limerock Base and Limerock Stabilized Subgrade
39
achieved in the upper 6 in. lift and this is reflected by lower LBR values. Similar issues of acceptance criteria must be addressed for stabilized subgrade layers. The strength of the stabilized subgrade in Figure 14 decreases with depth which is commensurate with decreased compaction efficiency. Average LBR for the top 6 in. stabilized subgrade layer is about 70 and 55 for the bottom 6 in. layer. These are greater than the required LBR
= 40, but
there is one increment near the bottom of the lower 6 in. layer that has LBR < 40. Figure 15 provides a second example. The rate of decrease in strength with depth is greater. The average LBR for the top 6 in. lift of the stabilized subgrade is about 50 and 25 for the bottom 6 in. lift. In addition, most LBR values for the bottom 6 in. lift are less than 40. The question that must be addressed in order to set criteria for construction acceptance is: what minimum requirements will assure structural capacity expected of a 12 in., LBR
=40, layer?
Based on thickness selection methodology, an LBR = 40 measured at the top of the layer may be structurally sufficient. However, additional research is needed to establish requirements for structural adequacy. Possible criteria that is successively more rigorous might include: 1. Average LBR > 40 for the top 6 in. lift, 2. Minimum LBR> 40 for the top 6 in. lift, 3. Average LBR > 40 for the total 12 in. layer, or 4. Minimum LBR > 40 for the total 12 in. layer. An additional factor that must be considered in setting acceptance criteria is the relationship between laboratory LBR, which is the basis for structural layer thickness design, and field LBR estimated with the ADCP. This issue will be addressed in a subsequent section. Correlations of DCPI and LBR The correlation, Equation 7 on page 6, suggested by Webster, Brown and Porter (12), is recommended for estimating CBR from measured DCPI. Equation 10 can be used to convert Equation 7 to Equation 11 for predicting LBR. As noted earlier, Equation 7 was developed with 40
manual OCPI but data from this study indicates OCPI obtained with the Florida OOT AOCP may also be used to estimate CBR/LBR. Manual and automated OCP tests were conducted in six of the test pit sections; manual tests were not performed in the Series 2, West Modified Section. Oata from these tests were analyzed and show no appreciable difference between manual and automated OCPI. It is, therefore, concluded that automated OCPI can be used in Equation 11 to estimate LBR. Average plots of blows versus penetration were made for the six test pit sections. Figure 16 and 17 are typical examples that illustrate little difference between cone penetration resistance measured with the manual and automated OCP. The terms nm and na indicate the number of manual and automated tests, respectively, averaged to produce the curves. Oata for all six test pit sections are summarized in Figures 18 and 19. Manual and automated OCPI for the 5 to 6 in. lifts used to construct the soils or paving materials in the test pits are plotted in Figure 18 about a line of equality. The data is further condensed in Figure 19 where average LBR's for the entire depth of each soil or paving material is plotted about a line of equality. The LBR's were computed with Equation 11 and are included in Table 4. The relevance of Equation 11 to Florida soils and paving materials is illustrated in Figure 20. Note that CBR rather than LBR is plotted with OCPI. The CBR's plotted in Figure 20 were measured at about the same time AOCP testing was conducted. Corresponding LBR's are tabulated in Table 2. Values are averages from several tests. For the test pits, trenches were excavated after the AOCP testing and CBRlLBR tests conducted at several depths. For example, the LBR =39 (CBR =31) for Test Pit, Series 1, East Section is the average of 11 tests conducted on 4 - 5 in. lifts of soil comprising the section. The corresponding OCPI = 9.9 mm/blow was obtained by averaging six AOCP tests over the full 20 in. depth of the section. Overall, Figure 20 indicates reasonable agreement between Equation 7 and data for Florida soils and paving materials. Therefore, no modifications are recommended.
41
Blows
0
20
40
60
80
100
120
0 100
-Automated -Manual
200 c: 0
~
-
300
nm= 6 na =6
-
Q)
c: Q)
Q..
400 500 600 700
Figure 16. Comparison of Automated Manual DCP Penetration Resistance in A-2-4 Soil Blows
0
50
150
100
200
250
0 -Automated
100
------ Manual nm =2 na = 3
200 c: 0
300
0';:;
-... 400 n:I
Q)
c: Q)
a. 500 600 700 800
Figure 17. Comparison of Automated and Manual DCP Penetration Resistance in Limerock Base and Stabilized Subgrade, Test Pit Series 2, Center Section
42
40
a..
0
o
35
•
30
a:s ~
ffi
25
~
E 20 0
.... '-
~
c.u
~ 15
"0 C
a.. 10
0 0
5 0 0
5
10
15
20
25
30
35
40
DCP Index from Automated DCP Figure 18. Comparison of DCPI from Automated and Manual DCP
100
80
~
U Q
"C
60
-
11)
~
S
0 ......
< Pi 40 ~
20 -
o
v
o
v 20
v 40
v
60
v
80
100
LBR, Manual DCP
Figure 19. Comparison of Average LBR Computed with Manual and Automated DCPI
44
100
"'" "
""" ~~ :.
50
•3 ~~
• ""1 -. @
CBR= 292/ DCP)"l. 2
,
$
I~
j
1
""
,
~.
~~
w •
~
•2
@
@
@
~ '1It
®
~
~ 0:1 U
•
~ ;"a.i
~
$ $
...
-c. 0.5
•
...0
•
Q
==ftI
0.4
• •
::I:
E
,g
0.3
t
Mean
•
•
=0.60, COV =15.1%
>< II) ."
..5 0.2
a. (.) Q
0.1 0.0 0
100
200
300
400
500
600
Depth, mm • West Pit, Series 1
• Center Pit, Series 1
• East Pit, Series 1
• West Pit, Series 2
Figure 21. Comparison of DCPI for Full and Half Drop Heights.
700
Ratio of Quarter Drops to Full Drop 1.0
a.
...
0.9
0
c :; 0.8 IL
E
...0
0.7
)(
CD
"tJ
.E Do
-
0.6
(,)
C
~
(0
...go ...
0.5 ~
Mean
= 0.30, COY = 17.1%
c
~ III
0.4
;::,
A
"...E 0.31
-
A A A
•
0
A
A
A.
•
A A A
.E
A
•
A
A
)(
CD "tJ
*
A
A
.. A A
A
0.2
Do
(,)
c
0.1 0.0 0
100
200
300
400
500
600
700
Depth, mm A West Pit, Series 2
Figure 22. Comparison of DCPI for Full and Quarter Drop Heights.
800
measured ratios of 0.6 and 0.3 are both somewhat higher and suggest that more energy is lost for full height drops than for partial height drops. Velocity at impact for half and quarter height drops, relative to velocity for full height drops, are V 1f2
and
= -
V
V2
. . ... ...... .. . . . ... . . . . ...... . .. ... . . . . .. . . .. . . .. . . . .... (16)
V
. .. . . . .... ..... . ... . . . . . . .. . . ....... . . ........ .. . . . .. . . . . (17) 2 This means the corresponding ratios of linear momentum transferred to the anvil at impact V1/4
= -
relative to that transferred for full height drops are _1_
=
0.71
and % = 0.5, respectively.
V2
Contrary to energy comparisons, these ratios are somewhat larger than the measured DCPI ratios of 0.6 and 0.3. Effects of Confinement
Confinement from overlying layers increases soil and paving material strength. In laboratory LBR tests the effects of confinement are simulated by surcharge weights placed on samples. This approach was tried on a limited basis for 1-75 sections and Test Pit, Series 2 tests. Data from these tests are tabulated in Table 5 and plotted in Figure 23. Figure 23 shows there was no apparent effect of vertical pressure, up to 0.84 psi, from the 1 or 2 ft. dia. steel plates. A 5 in. limerock base layer was constructed on the A-1-b sand in the West Section of Test Pit Series 2. The ADCP cone was driven through the limerock base and into the sand. Figure 24 is a plot of LBR versus penetration with and without the limerock base layer that demonstrates it's strengthening effect. This is due directly to confinement during ADCP testing as well as some additional compaction in the sand layer as the limerock base layer was placed and compacted. The confinement provided by the limerock base layer would have greatly enhanced the effectiveness of additional compaction energy transmitted to the sand.
50
100
r-----I----
80
I o 1 ft. Diameter Plate
r----.-
• 2 ft. Diameter Plate
r-
.&I
~
~
~
20 -
~ o
I
I
o
0.1
....
~
0.2
0.3
0.4 0.5 0.6 Vertical Plate Pressure, psi
I 0.7
0.8
Figure 23. Effects of Vertical Plate Pressure on LBR Measured with DCPI
51
0.9
5
1
LBR 10
50
100
.- .-
0
"
-
100
.- ...-
I
200
I
~h
E 400 E
..
J:
01
~
- --
h r - - ,•• .
1-
300
,
c.
cCP 500
•
- ..- ,
I
-.
. . ~ -.- -r----:a.
. c
~ ~ Ir-I.
600
L....... 700
L"
~ ~
800
--
900
-
Before Placement of LR
- - - After Placement of LR
Figure 24. Effects of Limerock Base Layer on Strength of A-1-b Sand
~.
-
Based on a limerock density of 120 Iblfe, the vertical pressure from the 5 in. layer was approximately 0.35 psi. The average LBR =25, shown in Table 5, is obviously larger than values for comparable plate pressures. Based on these limited trials, it is concluded that the confining effects of overlying layers cannot be practically simulated with metal plates. Webster, Brown and Porter (12) tried a somewhat different approach. They developed data for determining DCP penetration in various types of soil where predicted CBR's matched measured values at the soil surface. Uniform soil layers were constructed and CBR tests run on the surfaces.
DCP tests were run and CBR's with depth estimated from DCPI's. Depths
determined where CBR's matched CBR's measured at the surface are tabulated in Table 6. The depths are small for soils with strength due primarily to cohesion and increase for soils with strength due primarily to friction. Table 6. DCP Depth Required to Measure Surface Layer Strength, No Overburden (after Webster, Brown and Porter (12» Test Location
Soil Type
Average Penetration Depth Required, in.
WES
CH
1
WES
CL
3
WES
SC
4
WES
SW-SM
4
WES
SM
5
WES
GP
5
WES
SP
11
Effects of Moisture and Density
Density and water content affect soil and paving material strength. For strictly cohesionless soils and paving materials, density is the dominant influence. But for most soils, which have some cohesive component, both water content and density affect strength. 53
Classical
relationships are shown in Figure 25 (14).
Figure 25 indicates there may be significant
differences between samples compacted to the same density but at different water contents, and samples compacted to the same water content and density but tested as compacted or saturated. The data in Table 2 for the test pits also illustrates these differences. Implications of the effects of density and moisture is that a procedure relating field LBR with laboratory/design LBR is required to set acceptance criteria, if the ADCP is to be used for construction quality control/assurance (QC/QA). More specifically, a procedure is required to account for the influence of low water content; low density effects will be correctly reflected in measured DCPI. No tests were run as part of this study to develop required relationships.
However, a
methodology based on laboratory tests is offered for consideration. When developing compaction curves for soil or paving materials, two samples should be compacted at each water content. A soaked (standard procedure) and unsoaked LBR test should be conducted on these samples. From the data thus obtained, usual compaction curves for selecting required field water content and dry density may be selected. In addition, a procedure for setting required field LBR for acceptance, illustrated in Figure 26, can be developed. Soaked and unsoaked LBR are plotted versus as compacted water contents. The difference between the two curves should approximate the difference between as constructed field conditions and design conditions. The proposed procedure will require water content measurements as ADCP tests are conducted. The LBR adjustment, 6 LBR , is selected at the field water content as illustrated in Figure 26. This LBR adjustment is added to the design LBR to obtain the minimum field LBR for
54
100.-----.-----~----~----~----~----~--~
80 Q)
~
>
~ 60 I
""' B
e 40
0 :;::l
~ .....
CI)
20
o ~----~----~----~----~------~----~----~ 122 ~----~----~----~----~----~----~--~
~120 -r-----1-----~~----+_----~~--~~ ---~----~
:i u
""'&118;------+--~9-+-----~----~------~~--~
-o .0 I
'~116 ~------+~----~----~----~------+---~~----~I
5 o
oe- 114 -J--
-m.- \ - - - - - \ - - - - + I
• Samples tested as compacted o Sample tested after saturation
10
11
12
14
13
15
16
17
Water Content - percent
Figure 25. Effect of Saturation on Stability of Compacted Samples of Sandy Clay (after Seed (14))
55
acceptance only when the field water content is less than the optimum water content.
LBR ADCP
~
LBRDesign + ~LBR
• ••• . • • •••• • .• .• • • • • • • • • • • . • • •. . • • • • . . . • • • •
(18)
To efficiently achieve proper compaction, the water content of soils and paving materials should be within a few percentage pOints of the optimum water content. Drying back from compaction water contents will increase strength of most soils and paving materials. This increase in strength will develop in paving layers if they are allowed to dry and will be reflected in LBR estimated with the ADCP. The proposed procedure for adjusting design LBR should somewhat compensate for this, but increases in strength due to drying may be larger than the differences between soaked and unsoaked samples. Therefore, a minimum water content at ADCP testing is proposed to prevent excessive dry back. A second practical reason for setting a minimum water content is so that it is within the range of laboratory water contents. Although no specifics can be offered for selecting ~w, it is suggested that the minimum water content should be based on optimum water content as
Wmin = Wopt - ~w
• • • • • • • • ••• . • •• • • . • • • • • • • • •• • •. • • • • • • • • • • . • • • . • . . • • •
where W min
= minimum water content at ADCP testing
W opt = optimum water content for soil or paving material tested ~w
= water content adjustment.
56
(19)
[] Soaked LBR • Unsoaked LBR
L1LBR
W min
W fie1d
Compaction Water Content
Figure 26. Adjustment of Field LBR for Saturation
57
CONCLUSIONS AND RECOMMENDATIONS
The Florida DOT ADCP provides a practical tool for measuring in situ strength of granular paving materials and soils. The correlation developed by Webster, Grau and Williams (5) is recommended for estimating CBR (LBR) with measured DCPI. For softer soils, half or quarter drop heights may be used and measured DCPI divided by 0.6 or 0.3, respectively to modify them for estimating CBR (LBR). Evaluation of the strength of granular paving materials and subgrade soils in existing pavements is readily accomplished with the Florida DOT ADCP, requiring only access through bound layers. Strength parameters estimated with measured DCPI will accurately reflect actual conditions within pavement structures. Additional research will be required in order to effectively utilize the ADCP for construction control.
Relationships are needed between laboratory/design strength parameters and field
strength parameters in order to set acceptance criteria. In particular, differences in confinement, moisture content, and density must be considered. For satisfactorily constructed paving layers, design conditions may not be achieved for full depths. Criteria is needed to determine acceptable depths of noncompliance at the top and bottom of paving layers.
58
REFERENCES 1.
Fenwick, W. B., "Description and Application of Airfield Cone Penetrometer", Instruction Report No.7, US Army Engineer Waterways Experiment Station, Vicksburg, MS, October 1965.
2.
Croney, P. and D. Croney, The Design and Performance of Road Pavements, Third Edition, McGraw-Hili, New York, 1997.
3.
Van Vuuren, D. J., "Rapid Determination of CBR with the Portable Dynamic Cone Penetrometer", The Rhodesian Engineer, Vol. 7, No.5, September 1969.
4.
Kleyn, E. G., ''The Use of the Dynamic Cone Penetrometer", Transvaal Roads Department, South Africa, July 1975.
5.
Webster, S. L., R. H. Grau and T. P. Williams, "Description and Application of Dual mass Dynamic Cone Penetrometer", Instruction Report GL-92-3, US Army Engineer Waterways Experiment Station, Vicksburg, MS, May 1992.
6.
Livneh, M., I. Ishai and N. A. Livneh, "Carrying Capacity of Unsurfaced Runways for Low Volume Aircraft Traffic", Air Force Engineering and Service Center, Tyndall Air Force Base, FL, February 1992.
7.
Ese, D., J. Myre, P. Noss and E. Vaerness, ''The Use of Dynamic Cone Penetrometer (DCP) for Road Strengthening Design in Norway", Proceedings, Fourth International Conference on Bearing Capacity of Roads and Airfields, Minneapolis MN, July 1994.
8.
Smith, R. B. and D. N. Pratt, "A Field Study of In Situ California Bearing Ratio and DynamiC Cone Penetrometer Testing for Road Subgrade Investigations", Australian Road Research Board 13 (4), December 1983.
9.
Hasim, M. S. B., M. S. B. Mustafa and Z. A. B. M. Kasim, "Quick-Insitu-CBR for Road Engineering from DCP/lnsitu-CBR Relationship Developed in Malaysia", (unknown origin and date).
10. Livneh, M. ''The Use of Dynamic Cone Penetrometer in Determining the Strength of Existing Pavements and Subgrades", Proceedings, Southeast Asian Geotechnical Conference, Bankok, Thailand, 1987. 11. Harison, J. A., "In Situ CBR Determination by DCP Testing USing a Laboratory-Based Correlation", Australian Road Research, Technical Note No.2, December 1989. 12. Webster, S. L., R. W. Brown and J. R. Porter, "Force Projection Site Evaluation Using the Electric Cone Penetrometer (ECP) and the Dynamic Cone Penetrometer (DCP)", Technical Report GL-94-17, US Army Engineers Waterways Experiment Station, Vicksburg, MS, April 1994. 13. "AASHTO Guide for Design of Pavement Structures", American Association of State Highways and Transportation Officials, Washington, DC, 1993. 14. Seed, H. B., "A Modern Approach to Soil Compaction", Proceedings, Eleventh California Street and Highway Conference, Reprint No. 69, The Institute of Transportation and Traffic Engineering, University of California at Berkeley, 1959. 59


![Auburn University Message - Auburn Engineering [PDF]](https://m.moam.info/img/260x300/auburn-university-message-auburn-engineering-pdf_649c20f3098a9e83338b460b.jpg)