DEVELOPMENT OF AN AUTOMATED IMAGE ACQUISITION SYSTEM FOR MONITORING GENE EXPRESSION AND TISSUE GROWTH M. T. Buenrostro−Nava, P. P. Ling, J. J. Finer
ABSTRACT. Automated systems can be used to facilitate continual collection of biological information from a large number of samples over long periods of time. The proper combination of automated systems with fluorescent reporter genes offers the potential for non−destructive analysis of gene expression over time. One of the fluorescent genes more commonly used in many different areas of biology is the green fluorescent protein (GFP) gene from jellyfish. The expression of this reporter gene can be detected in the tissues of any transgenic organism by using a microscope equipped with special illumination and emission filters. The main aim of this work was to develop a computer−controlled automated system to monitor GFP gene expression over time. The automated system consists of a two−dimensional belt−driven positioning table, a custom−designed sample holder, and a charged−coupled device (CCD) camera mounted on a stereomicroscope equipped for GFP fluorescence detection. To precisely control the system, software with custom applications was generated. The automated system was used to monitor the response of GFP−expressing Agrobacterium to plant tissues in vitro. Gene expression and bacterial growth were successfully monitored and quantified using image analysis. Our results showed that bacterial colonies growing in the presence of plant tissue had faster growth than those growing in the absence of plant tissues. Keywords. Analysis of gene expression, Green fluorescent protein, Image analysis, Robotics.
T
he use of fluorescent reporter genes such as the green fluorescent protein (gfp) gene offers new tools for the study of gene regulation in vivo (Haseloff and Amos, 1995). GFP expression can be visualized directly in living tissues without damaging that tissue, making GFP one of the most versatile reporter genes available. Because of the fluorescence properties of GFP, its expression can be easily detected using either digital imaging (Piston et al., 1999) or direct fluorescence detection methods (Grebenok et al., 1997). Although GFP is relatively easy to image, there are only a few reports using image analysis to quantify GFP expression. Maximova et al. (1998) used image analysis and
Article was submitted for review in October 2003; approved for publication by the Biological Engineering Division of ASAE in January 2005. Salaries and research support were provided by State and Federal funds appropriated to The Ohio State University/Ohio Agricultural Research and Development Center. Mention of trademark or proprietary products does not constitute a guarantee or warranty of the product by OSU/OARDC and also does not imply approval to the exclusion of other products that may also be suitable. Journal Article No. HCS−03−23. The authors are Marco Tulio Buenrostro−Nava, Graduate Student, Department of Horticulture and Crop Science, Ohio Agricultural Research and Development Center, Peter P. Ling, ASAE Member Engineer, Associate Professor, Department of Food, Agricultural and Biological Engineering, Ohio Agricultural Research and Development Center, and John James Finer, Professor, Department of Horticulture and Crop Science, Ohio Agriculture Research and Development Center, The Ohio State University, Wooster, Ohio. Corresponding author: John J. Finer, Department of Horticulture and Crop Science, Ohio Agriculture Research and Development Center, The Ohio State University, 1680 Madison Ave., Wooster, OH 44691; phone: 330−263−3880; fax: 330−263−3887; e−mail:
[email protected].
GFP expression to follow the transformation process in different apple cultivars. Color images of randomly selected areas of Agrobacterium−infected leaf explants were taken at 6, 9, 11, 13, 15, 17, and 19 d after infection. Two surges in GFP expression were reported; the first was observed at 9 d post−infection and was correlated with peak transient expression. The second increase in GFP expression was reported to be associated with expression in newly recovered, stably transformed calli. Image collections were performed manually, one at each time point. Nagatani et al. (1997) also used image analysis of individual, manually collected images and quantified the heat−shock response of transgenic rice calli, containing the GFP reporter gene under regulatory control of the maize polyubiquitin promoter. Quantitative analysis of GFP using image analysis of transformed rice callus, acquired at 0, 30, 60, and 120 min after induction of heat−shock, showed that GFP expression, measured as maximum value of pixel intensity, increased 2− to 4−fold with respect to the control. Because these images were manually collected, small inconsistencies in image collection could lead to concomitant errors in image analysis. These reports show the utility of using image analysis and GFP for semi−continual monitoring of gene expression. Even though GFP−expressing samples can be imaged with relative ease, characterization of gene expression and promoter analysis over time requires constant monitoring of large numbers of in vivo samples. For manual image collection, this can be inefficient, labor−intensive, and time−consuming. An automated high− throughput image collection system like the one described in this article would tremendously enhance the ability to acquire consistent and uniform images of the same tissue over time.
Transactions of the ASAE Vol. 48(2): 841−847
E 2005 American Society of Agricultural Engineers ISSN 0001−2351
841
In the area of experimental biology, automated systems have been developed and used to gather information on how plants grow and develop under different environmental conditions. Kacira and Ling (2001) described the use of a computer−controlled motorized circular table and remote sensors to continuously monitor the health and growth of New Guinea Impatiens plants growing under either low or high humidity conditions. Monitoring gene expression and tissue growth in different Petri dishes using an automated system creates different challenges. To quantify GFP expression using image analysis, an automated system should acquire high−quality images in order to avoid artifacts that may interfere with the quantification of the GFP fluorescence (Piston et al., 1999). Possible causes of error include light source degradation over time, condensation formed on Petri dish lids, and varied focal length from target to target and from time to time due to growth of the living organism. Distance between a microscope objective and targets can also vary as a result of growth media thickness variation, tissue size variation, and shrinkage of growth media over time in long−term experiments. Another challenge of the image acquisition process is the precise and consistent placement of target tissues under the microscope objective for image collection. Because of the small field of view under the microscope (1.2 cm2 when set at 1X), the system should have an accurate material handling capability to deliver targeted material for repeatable image acquisition. Additionally, communication between the material handling system and the image acquisition system must be established for synchronized operations. Our main aim was to develop an automated high−throughput imaging system using robotics and image analysis as a non−invasive method to monitor and quantify GFP expression. To test the system, the growth response of a GFP−expressing bacterium to the presence of plant tissue was evaluated.
MATERIALS AND METHODS XY TABLE AND MOTION CONTROL SYSTEM The automated material handling system that was used to position the samples under the camera mounted on a microscope, consisted of a 40.64 × 40.64 cm Plexiglas platform mounted on a 45.70 × 45.70 cm XY belt−driven positioning table (Arrick Robotics, Inc., Hurst, Texas). Figure 1 is a schematic diagram of the GFP gene expression analysis system. The platform was fastened onto two 90° aluminum angles (40.64 cm long, 4 cm base, and 4 cm high), which in turn were attached to a 7.92 × 15.24 cm aluminum frame (Arrick Robotics, Inc., Hurst, Texas). The platform was driven by two stepper motors (MD−2a, Arrick Robotics, Inc., Hurst, Texas). The table contained two limit switches (one for each of the directions, X and Y), which were used to establish a home position to eliminate the accumulation of positioning error (backlash error) from consecutively positioning multiple samples. The home position was recognized by the computer when the limit switch was activated by the platform. To precisely place the platform in the home position, when a limit switch was activated, the motor driving the platform in that direction was set to the forward direction until the switch was deactivated, and then it was moved two additional steps. In order to place each sample under the microscope objective, the platform was moved O and P steps forward from the reference position in the X and Y directions, respectively. After the sample was positioned under the microscope, a delay of 5 s was implemented prior to image acquisition to reduce image blurriness caused by residual sample movement. After saving the image, and before moving to the next position, the platform was directed to the home position to eliminate the accumulation of positioning error (backlash error) (fig. 2).
Figure 1. Diagram (not to scale) of the automated plant growth and gene expression analysis system and data flow: (1) laminar hood, (2) two−dimensional (XY) table, (3) Plexiglas platform, (4) dual step motors and reference switch, (5) CCD camera, (6) dissecting microscope, (7) mercury bulb light source, (8) computer, (9) stepper motor driver, (10) power source for the camera, (11) power supply for the mercury bulb light source, (12) halogen light source, (13) fiber optics bundle, (14) ring light, (15) Petri dish, (16) heavy−duty ball−bearing boom stand, (A) motion control, (B) camera control and image storage, and (C) stepper motor control.
842
TRANSACTIONS OF THE ASAE
Figure 3. Top view (top) and side view (bottom) of the plate fastening and leveling mechanisms of the platform: (A) fastener mechanism, (B) Petri dish, (C) holder, (D) rubber cushion, (E) leveling screws, (F) Plexiglas platform, (G) perforation (not to scale).
Figure 2. Schematic of the main program. A is the number of samples to be analyzed on the XY table, and B is the number of loops. N and M are counters for the number of samples and number of loops, respectively. The algorithm for the main program was written in C++.
The design of the platform was modified several times as the system was developed. Each design change was meant to solve secondary problems that were encountered as the primary problems were reduced or eliminated. The first design consisted of a 45.72 × 45.72 × 5.08 cm piece of Styrofoam, which was fastened to the aluminum frame. Two 5.08 cm high spacers were placed side by side between the platform and the aluminum frame to create a free space between the platform and the motors, which were placed at the same height as the aluminum frame. The platform was covered with a piece of black velvet. Petri dishes, containing the samples, were placed directly on the black velvet. A second platform was made using a 45.72 × 45.72 × 0.5 cm piece of plywood. This platform was attached to the XY table in the same way as the Styrofoam platform and was
Vol. 48(2): 841−847
also covered with a piece of black velvet. To hold the Petri dishes in place, 16 perforations of 6 cm diameter were made in a piece of Plexiglas with the same dimensions as the plywood platform. The perforated Plexiglas was fastened to the top of the plywood platform. Because positioning precision and accumulation of condensation on the covering lids (presented in the Results and Discussion section) appeared to be associated with the design of the plywood platform, a third platform was designed. This third platform consisted of a 45.72 × 45.72 × 0.5 cm piece of Plexiglas, containing 16 perforations of 5.08 cm diameter, evenly distributed in four rows and four columns. In order to adjust the focal distance of different areas of a plate, three plastic screws were placed 120° apart from each other and 5 mm away from the perforation. These screws were also used to lower the Petri dish and maintain the plant tissue in the focal plane as the tissue grew. One 100 × 25 mm Petri dish was placed on top of the tips of the three positioning screws (fig. 3). To tightly hold the plate in its position, a 90° aluminum angle (with a 2.54 cm base and 2.54 cm high) was fastened to the platform, and a plastic fastener screw was horizontally placed to hold the plate against a polypropylene holder as illustrated in figure 3. Two 1.25 cm diameter rubber cushions were attached on the opposite sides of the fastener screw to create some cushioning and eliminate any movement of the plate due to vibration caused by the constant travel of the platform.
843
In order to test the positioning precision of the Plexiglas platform, 16 reference points were evaluated using the positioning table with the platform, with and without backlash error control. For the tests with backlash error control, the platform was directed to the home position before being directed to each reference point. For the tests with no backlash error control, all reference points were successively evaluated under the microscope, without using the home position between points. Images of all reference points were taken under both tested conditions, and the distance deviation of the reference points in pixels was determined. The test was repeated five times. The coordinates of the reference point on the image plane were determined using commercial image analysis software (Visilog, 1997). IMAGE ACQUISITION HARDWARE An air−cooled charged−coupled device (CCD) camera (SPOT−RT, Diagnostic Instruments, Inc., Sterling Heights, Mich.) was mounted on a stereomicroscope (MZFLIII, Leica, Heerbrugg, Switzerland) to acquire images. The camera was selected for its ability to detect low light signals and user accessibility to control gain, binning, and exposure time. Auto gain control was turned off and exposure time was fixed during the study for authentic extraction of spectral features. Images obtained with the SPOT−RT camera have a spatial resolution of 1600 × 1200 pixels. A total of 24 bits per pixel (8 bits per color channel) was used to represent color information. The final image size was 5.76 megabytes. IMAGING PERFORMANCE To evaluate the measurement accuracy of the imaging mechanisms and the possible focusing error due to the location of the object on the platform, a black square of known size (14 mm2) was imaged and measured. The square was drawn with image editor software (Adobe Photoshop, Adobe Systems, Inc., San Jose, Cal.) and printed on a piece of standard white paper using a laser printer. The square was placed in an empty Petri dish, which was consecutively placed on 12 different locations of the platform. The object was focused at each location using the platform focusing screws (fig. 3). Five images of the square were taken at each location (60 images total), and their areas were determined using a commercial image analysis package (Visilog, 1997). LIGHT SOURCE AND MICROSCOPE OPTICS To detect the expression of the GFP gene, the microscope was equipped with one 100 W mercury bulb, an 480/40 nm excitation band−pass filter, and a 510 nm long−pass filter. The GFP used in this study (Finer and Finer, 2000) had an excitation maximum at 489 nm and an emission maximum at 511 nm. The excitation filter allowed the passage of blue light produced by the mercury bulb, eliminating the light in the UV, green, and red spectra. The high−intensity blue light was then focused on the specimen expressing GFP. The purpose of the long−pass filter was to block the residual blue light used to excite the GFP and allow passage of the green light emitted by the GFP when excited. The long−pass filter also allowed passage of any visible light above 510 nm, which could be useful for detecting fluorescent proteins other than GFP, which may have longer−wave emissions (Baird et al., 2000). In addition to the mercury light source, the system contained a 90 W halogen lamp (GE Quartzline, Cleveland,
844
Ohio) light source that could be used to illuminate the objects under the microscope. The light was transmitted from the light source to the object through a glass fiber bundle to a 66 mm diameter (Schott−Fostec, LLC, Auburn, N.Y.) ringlight, which was attached to the 1X objective of the microscope. CULTURE CONDITIONS To keep the contents of the Petri dishes under aseptic conditions, the automated system was placed in a vibration− free isolation table−style laminar airflow hood (Microzone Co., Ottawa, Ontario, Canada). This hood was located in a culture room, where the temperature was maintained at 25°C ±1°C. To precisely control the illumination of the samples, the laminar hood was enclosed in a dark environment to isolate the objects of study from external illumination. For photoperiodic illumination of plant samples for long−term studies, a set of two 40 W fluorescent plant growth lamps were placed in the hood, and the samples were illuminated with a light intensity of 10 mmol m−2 s−1 (photosynthetic active radiation). The lamps were controlled by a timer, which automatically turned the lights off while the automated system was collecting images and back on when the system was in the standby mode between image collection cycles. INOCULATION WITH GFP−EXPRESSING AGROBACTERIUM GFP−expressing Agrobacterium (Finer and Finer, 2000) was inoculated onto either embryogenic soybean tissue grown on an embryo proliferation medium (Santarém and Finer, 1999) or directly on the medium itself. The bacteria were grown as an overnight culture in liquid LB medium as previously described (Finer et al., 2001), and a 2 mL droplet of resuspended inoculum was used. Images were collected every hour for a total of 80 h from the start of the experiment.
RESULTS AND DISCUSSION SYSTEM PERFORMANCE Platform Performance The first platform, which consisted of Styrofoam, was light and rigid; however, the thickness (5.08 cm) of the Styrofoam and the height of the spacers, placed under the platform, left very little working distance between the microscope and the samples, making focusing of large samples difficult. To solve the problem, a thinner (5 mm) plywood platform was designed. Even though the plywood platform was light, held the plates in place, and provided enough working distance, use of the solid black velvet−covered plywood led to accumulation of heat generated by the light sources. Temperature differences between the medium in the dishes and the Petri dish lids led to water condensation on the dish covers, resulting in poor image quality and making image analysis difficult. Another problem with this design, observed during long−term experiments, was uneven growth among the samples in a dish. In addition, water taken up by the plant tissue or lost through condensation on the Petri dish lid reduced the thickness of the medium, making it difficult to retain a sample at its preset focal plane, as is required by the imaging system. To reduce condensation, a Plexiglas platform design with perforations was evaluated. The clear Plexiglas absorbed less light, and the condensation in the dishes from heat buildup was tremendously reduced.
TRANSACTIONS OF THE ASAE
Platform design was important for achieving precision in positioning the samples. Our results showed that the Plexiglas design had an error of ±1.7 pixels, while the plywood platform showed an error of ±3.5 pixels in the X axis direction. However, for the Y axis, no differences were observed between the plywood (±4.3 pixels) and the Plexiglas (±4.0 pixels) platforms. The lower precision in the Y axis control, on both platforms, may be attributed to insufficient torque of the driving mechanism. Further adjustments to the moving mechanism of the Y axis may still be required to increase its positioning precision.
Number of pixels (Y axis of image plane)
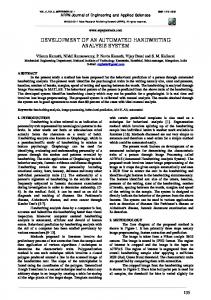
Backlash Error Control Our results indicate that backlash error accumulates if the platform is used to successively position multiple objects. Backlash error can be controlled if the platform is directed to the home position between each object (Kacira and Ling, 2001). Backlash error control improved the precision of object positioning as compared to positioning without backlash control (fig. 4). When backlash error control was not used, the distance between the actual position of the object and the target position increased with each stop. After stopping at 16 different reference points, the object position varied 300 and 500 pixels from the target position along the Y and X axes, respectively (fig. 4). Such cumulative positioning errors could eventually take the objects outside of the field of view of the microscope. Using backlash error control, on the other hand, the position of the object was only 1 to 7 pixels from the target position, resulting in higher precision of the positioning system. Directing the platform to the home position between samples increased the time required to complete a loop though the samples, which may be a problem if the experiment requires rapid sampling through multiple targets in a relatively short time. Since the time required to complete a loop may vary among experiments, we recommended running a preliminary test to estimate the time required for the system to complete a loop through the samples, and then calculating the time required between loops. Attributes affecting the time requirements include the number of samples per plate, their distance to the home position, and the exposure times (which are unique to each experiment).
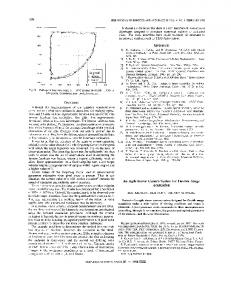
IMAGING PERFORMANCE Evaluation of the imaging measurement using a target (14 mm2) on 12 different locations on the sample holder platform was conducted. Analysis of the images showed that the average object size was 14.02 ±0.02 mm2. The similarities of the known size of the object to that obtained using image analysis suggest that the imaging system can be used to accurately determine the size of objects. The small error observed among the samples suggests that accurate measurement of the size of the object was not affected by its position on the platform, as expected. LIGHT SOURCE PERFORMANCE To characterize the stability of the excitation source for fluorescent imaging, the output of the mercury bulb was measured over a long time period (24 d) by measuring the amount of light reflected from a piece of white copy paper (Xerox, Stamford, Conn.). Reflected light was quantified using image analysis. Changes over time of the gray value of the paper showed that there was some variation in the light output of the mercury bulb during the course of the experiment and that the light output was reduced over the life of the bulb (fig. 5). For the results shown in figure 5, the bulb was replaced on days 3 and 16. These results suggest that the degradation of the light source over time needs to be taken into consideration when GFP levels are quantified over time for long−term experiments (longer than 96 h). Short−term experiments may not be affected by these changes in light intensity, unless the light bulb is changed during the experiment. Alternative light sources with small output variation and that last longer than mercury bulbs (usually 200 h) may be useful for monitoring GFP in long−term experiments. Unfortunately, blue LEDs do not produce sufficient intensities of illumination for detection of low levels of GFP, even when more than 100 LEDs are focused on a very small area (data not shown).
ANALYSIS OF GFP GENE EXPRESSION TRACKING OF GFP−EXPRESSING AGROBACTERIUM In order to test the ability of the system to track GFP gene expression and growth of GFP−expressing Agrobacterium,
1200 1100 1000 900 800 700 600 500 400 0
200
400
600
800
1000
Number of pixels (X axis of image plane) Figure 4. Performance of positioning with and without backlash error control. A target placed on 16 different locations of the sample holder was positioned for examination in the field of view of the microscope. The actual locations with (black circles) and without (white circles) backlash error control of the target are shown. The horizontal and vertical bars around each data point represent the standard error of the X and Y direction positioning, respectively. Each point represents the mean of five replications. Deviations of the actual locations from the predefined location on the image plane were considered positioning error. Points grouped within the oval demonstrate the effectiveness of backlash error control for minimizing positioning error.
Vol. 48(2): 841−847
845
Illumination Intensity (Gray Values)
250 200 150 100 50 0 0
5
10
15
20
Days Figure 5. Changes in illumination intensity of the blue light used to excite GFP over a period of 24 days. The line represents the sum of the average of the intensity of the red, green, and blue channels from a piece of white paper. The arrows indicate the time points at which the light bulb was replaced.
colonies were monitored semi−continuously for 80 h. Growth of the GFP−expressing Agrobacterium, on both embryogenic soybean tissue and the culture medium (without tissue), was relatively easy to track using the automated image collection system (fig. 6). Because of the limited resolution of the print version of this report, the earliest time points of GFP expression are not shown here. Fluorescence in small sectors of the colonies became visible within 12 h and increased in intensity at 16 h after inoculation on embryogenic tissue (figs. 6 and 7). Areas of the Agrobacterium colonies, growing on embryo proliferation medium, were first visible 8 h after inoculation and the entire colony became completely apparent after 16 h (fig. 6). Some parts of the colony areas produced a higher GFP intensity than other areas (fig. 6). These differences in intensity may be related to different concentrations of the bacteria throughout the colony, so a higher GFP intensity may correspond to an area within the colony with a higher number of bacteria than those with less GFP intensity. The differences in GFP intensity provided information about the growth of the GFP expressing Agrobacterium colony. The Agrobacterium growing on embryogenic tissue proliferated faster than the Agrobacterium colony growing on the medium alone (fig. 6B). Because the bacterium, cultured in the presence of the plant tissue, swarmed over much of the surface of the Petri
dish (Finer et al., 2001), the colony grew outside of the field of view of the microscope during the later time points. Although figure 6 shows the size of the GFP−expressing colonies at different time intervals, it is difficult to visualize the growth pattern of the colonies over time. Assembly of digital images over time permits the generation of time−lapse animations that help to visualize some dynamic processes in living organisms. Time−lapse animations of germinating sunflower plantlets (http:// sunflower. bio. indiana. edu / ~rhangart / plantsinmotion. html) showed in great detail the circadian rhythms and nutation movements that otherwise may be difficult to visualize. To better visualize the growth pattern of the GFP−expressing colonies and their response to the plant tissue, the digital images acquired using the automated system were assembled over time to create a time−lapse animation. The animation shows detailed information about the growth pattern of the colonies (www.oardc.ohio−state.edu/plantranslab/agromo vie.htm). Analysis of the animation showed that the bacterial colony grew mostly from the outside, although internal colonial rings were formed and they seem to have moved outward due to internal growth of the colony. In addition to the visual inspection of the bacteria colony growth, quantitative analysis of the GFP intensity and area of the GFP−expressing colonies showed that, during initial time points after Agrobacterium inoculation, GFP intensity increased faster than colony size (fig. 7). During the initial time points (0 to 12 h), the GFP−expressing colonies were approximately 15 mm2, which is the approximate size of the inoculated area/tissue on the medium (fig. 7). GFP intensity was a good indication of bacteria growth during the initial time points of the experiment (0 to 44 h); however, at 62 h after the inoculation of Agrobacterium, GFP intensity reached a steady state on both treatments. For the no−tissue treatment, bacterial growth reached a peak and stopped. For the bacteria grown in the presence of plant tissue, the edge of the colony progressed beyond the field of view, and further growth was not detected. GFP intensity showed a high correlation with the area of the Agrobacterium on both the colonies growing on soybean embryogenic tissue (0.83, p = 0.0001) and those growing without embryogenic tissue (0.79, p = 0.0001). This positive correlation shows that GFP intensity can be used to monitor
Figure 6. Agrobacterium colonies growing directly on embryo proliferation medium (row A) and on soybean embryogenic tissue, cultured on embryo proliferation medium (row B). The numbers represent the hours after inoculation at which each image was taken. The scale bar represents 5 mm. A time−lapse animation containing the full sequence of images and showing the growth of both colonies side by side is available at: www.oardc.ohio− state.edu/plantranslab/agromovie.htm.
846
TRANSACTIONS OF THE ASAE
100
200 75 150 50 100 25 50
0
Agrobacterium growth (mm2)
Average GFP Intensity (Gray values)
250
0 0
10
20
30
40
50
60
70
80
Hours after inoculation Figure 7. Area and GFP intensity of GFP-expressing Agrobacterium on soybean embryogenic tissue (white squares and black squares, respectively) and on embryo proliferation medium (white circles and black circles, respectively).
the response of Agrobacterium to different factors that may influence growth. Even though GFP detection might be affected in long-term experiments due to the changes in light intensity (fig. 5), the GFP intensity shown in figure 7 was not affected because the evaluation was performed over such a short period of time (80 h). The total area covered by Agrobacterium was larger in the treatments where Agrobacterium was inoculated onto embryogenic tissue than in the treatments where it was inoculated directly on embryo proliferation medium (figs. 6 and 7). The differences in Agrobacterium growth suggest that the plant tissue stimulated the growth of Agrobacterium, as described by Finer et al. (2001). Unlike previous analyses of GFP expression (Maximova et al., 1998; Nagatani et al., 1997), where images had to be individually and manually collected over time, the use of an automated image acquisition system allowed us to frequently monitor the growth of two GFP-expressing Agrobacterium colonies. The use of the automated system and image analysis allowed relatively simple quantification and visualization of the two-dimensional Agrobacterium growth and its response over time to the presence of plant tissue. To our knowledge, this is the first automated system capable of monitoring GFP gene expression of multiple biological samples over time using a dissecting microscope.
CONCLUSIONS An automated image acquisition system has been developed to semi-continuously monitor GFP gene expression. Image analysis was useful for tracking and quantifying the growth of GFP-expressing Agrobacterium on embryogenic soybean tissue. This application could be useful for fine analysis of the interaction between pathogens and their hosts over extended periods of time. This system could also be used to track and quantify transgene expression in a variety of different tissues, and to evaluate factors that influence gene expression over time. ACKNOWLEDGEMENTS The authors would like to thank Dr. Min Zhang, who developed the software for the automated system described in this article. Part of the costs of the equipment was defrayed
Vol. 48(2): 841−847
by support from the Danone Group and a scholarship from CONACYT, Mexico.
REFERENCES Baird, G. S., D. A. Zacharias, and R. Y. Tsien. 2000. Biochemistry, mutagenesis, and oligomerization of DsRed, a red fluorescent protein from coral. Proc. National Academy of Sciences 97: 11984-11989. Finer, K. R., and J. J. Finer. 2000. Use of Agrobacterium expressing green fluorescent protein to evaluate colonization of sonication-assisted Agrobacterium-mediated transformation-treated soybean cotyledons. Lett. Appl. Microbiol. 30(5): 406-410. Finer, K. R., K. M. Larkin, B. J. Martin, and J. J. Finer. 2001. Proximity of Agrobacterium to living plant tissues induces conversion to a filamentous bacterial form. Plant Cell Reports 20(3): 250-255. Grebenok, R. J., G. M. Lambert, and D. W. Galbraith. 1997. Characterization of the targeted nuclear accumulation of GFP within the cells of transgenic plants. The Plant Journal 12(3): 685-696. Haseloff, J., and B. Amos. 1995. GFP in plants. Trends in Genetics 11(8): 328-329. Kacira, M., and P. P. Ling. 2001. Design and development of an automated and non-contact sensing system for continuous monitoring of plant health and growth. Trans. ASAE 44(4): 989-996. Maximova, S. N., A. M. Dandekar, and M. J. Guiltinan. 1998. Investigation of Agrobacterium-mediated transformation of apple using green fluorescent protein: High transient expression and low stable transformation suggest that factors other than T-DNA transfer are rate-limiting. Plant Molecular Biology 37(3): 549-559. Nagatani, N., S. Takuni, M. Tomiyama, T. Shimada, and E. Tamiya. 1997. Semi-real time imaging of the expression of a maize polyubiquitin promoter-GFP gene in transgenic rice. Plant Science 124(1): 49-55. Visilog. 1997. Visilog 5.0 Documentation Set, 851. Cedex, France: Noesis, S.A. Piston, D. W., G. H. Patterson, and S. M. Knobel. 1999. Quantitative imaging of the green fluorescent protein (GFP). In Methods in Cell Biology, 31-48. Nashville, Tenn.: Academic Press. Santarém, E. R., and J. J. Finer. 1999 Transformation of soybean (Glycine max (L.) Merrill) using proliferative embryogenic tissue maintained on semi-solid medium. In Vitro Cellular and Devel. Biology - Plant 35(6): 451-455.
847