DEVELOPMENT OF AN OPERATIONS-DRIVEN COST MODEL FOR CONTINUOUS PROCESSES
Part 1: Framework for design and operations decision making
ABSTRACT
MARTIN LAFLAMME-MAYER, MATTY JANSSEN, PAUL STUART*
Given the increasing availability of reliable process and cost information, it is now possible to more accurately represent production processes for process design and operations improvement. This three-part paper presents a systematic multidisciplinary methodology incorporating technology and accounting principles, for better understanding complex continuous production environments such as those in pulp and paper mills. The integration of process and cost information in a “bottom-up” calculation engine, coupled with a process-informed aggregation of costs, allows for easier modeling of complex cost relationships, by identifying how resources are consumed by activities and how activities are related to cost objects. Whereas Part 1 of this series presents the model and method, case studies for the application of the operationsdriven cost modeling for retrofit process design and supply chain optimization are presented in Part 2 and Part 3.
INTRODUCTION
As a consequence of the challenging business environment, pulp and paper companies in North America and Western Europe must define transformational business strategies that improve their competitive position over the longer term [1]. These strategies consist of increasing profitability through the improvement of existing operations, and by capital projects related to the existing core business or related to new business areas. Forestry companies increasingly recognize that improved supply chain management (SCM) is essential to preserve enterprise value, and to be better able to compete with global cost-effective producers in regional and international markets [2]. In the case of capital spending, selection of the most profitable strategies for the improvement of existing manufacturing operations (retrofit design) is critical, especially in order to adapt to the changing business environment accounting for such factors as (a) diminishing product demand (b) the potential to manufacture new bioproducts, and (c) prolonged periods of limited capital expenditures. The implementation of mill-wide data acquisition systems in the pulp and paper 32
J-FOR
industry has opened the door to vast amounts of process data, from which information about processes and products can be extracted. Although this has enhanced ad hoc process troubleshooting in mills [3-4] and plays an important role in providing information to decision makers, a structured framework for advanced operations and design decision making support is needed in order to better exploit data. As discussed by Lail [5], creating added value by systematically looking at the “obvious” – processes, knowledge and data available at the mill –
MARTIN LAFLAMME-MAYER
NSERC Chair in Design Engineering Department of Chemical Engineering, École Polytechnique de Montréal
is the key for successful supply chain projects and we think, for process design. Even though process engineers, accountants, and information managers at mills have undertaken many initiatives, there is an important need for the development of best practices to help mills better use data for decision-making. This paper presents an operations-driven cost model, established through collaboration between engineers and accountants, that integrates data across disciplines and mill areas, and considers cost accounting subtleties that
MATTY JANSSEN
NSERC Chair in Design Engineering Department of Chemical Engineering, École Polytechnique de Montréal
Journal of Science & Technology for Forest Products and Processes: VOL.1, NO.1, 2011
PAUL STUART
NSERC Chair in Design Engineering Department of Chemical Engineering, École Polytechnique de Montréal *Contact:
[email protected]
TRADITIONAL AREA CONTRIBUTIONS can help mills turn data into information that facilitates the decision making process. This paper first discusses the importance of the process perspective for cost management in continuous-process manufacturing. The bottom-up approach proposed by this work is described, followed by details of the operations-driven cost model. Model structure and data quality issues are discussed, as well as the potential for using this approach to add value to mill operations. COST MANAGEMENT IN CONTINUOUS-PROCESS MANUFACTURING
It is essential to distinguish between accounting approaches often used at mills, and management-based accounting approaches such as the one presented in this paper. At mills, financial accounting can typically be characterized by the focus on external reporting (e.g. for shareholders) and on consistent representation of manufacturing costs over time. In the case of management accounting, the emphasis on allowing the analysis of historical cost data to provide useful and relevant information for decision making, planning, control and performance evaluation [6]. It also recognizes the need to integrate cost information with production knowledge for more in-depth analysis and interpretation of the data. Continuous process manufacturing has specific characteristics that have been identified and discussed by various authors (for the process industry in general [7-8] and specifically for the pulp and paper industry [9-10]). The direct application of cost management tools to the pulp and paper industry that have been primarily developed in the context of discrete-part manufacturing can be challenging and may not provide the expected benefits when applied to continuous manufacturing. The specific manufacturing needs of a given process must be understood in order to develop management-based accounting tools adapted to a particular manufacturing environment. As discussed by Reeve [8], effective cost management systems for continuous process manufacturing must consider both the product and process perspectives. Process-related activities often cannot be J-FOR
related to product strategy for the analysis of manufacturing costs in mills. This is an essential distinction to make, since most cost management approaches developed for discrete-part manufacturing consider the products as the primary cause of activity generation within a plant. To better understand cost behaviour in pulp and paper mills, it is important to take into account the following perspectives: Product Perspective In pulp and paper processes, similar to other continuous manufacturing processes, we distinguish between two main types of operations: mainline processing operations (i.e. pulp and papermaking), and converting and finishing operations (i.e. sheeting, packaging, etc.) [11]. For discrete manufacturing, cost driver relationships within the plant are typically better explained using a product perspective. On the other hand, in pulp and paper manufacturing, product-related activities are more useful for describing the cost behaviour of operations that are downstream of the main processing operations, where large product diversity is created. In fact, from the converting and finishing operations to the customers, a product perspective is adequate in order to evaluate the effect on cost of product specifications (trim, core, wrapping, labelling, etc.), channels (next-day delivery, direct shipment, shipment to distribution centre) and customers (vendor-managed inventory, special contractual arrangements, etc). This is perhaps the main reason why Reeve [8] suggests that for continuous manufacturing, the implementation of traditional activitybased costing concepts should focus on the “demand side” of the supply chain. Process Perspective For mainline processing operations, it is more relevant to consider the process perspective in order to be able to explain cost generation. Nevertheless, process and product perspectives are not mutually exclusive and both perspectives may be required to explain some cost items, e.g. although transition costs are sequence-dependent - product perspective, batch-level – the explanation of the costs incurred requires an in-depth process analysis using a process perspective.
Production Process – A large part of indirect manufacturing costs at mills are the result of activities such as maintenance, which are related to the production process. These cost items are normally allocated to products and the allocation method may not provide useful insight for cost management [8]. Cost driver relationships should be identified based on the analysis of process-related aspects such as maintenance and operating policies. In addition, the production process perspective is necessary to understand how process activities generate costs within the main processing operations. This perspective is needed to provide key information about the configuration of the process, the important flows, the type of processes involved (mixing, heating, reaction, etc) and other relevant qualitative and quantitative inputs required to characterize the structure of the manufacturing process. Operating Conditions – In discrete manufacturing, it is simpler to calculate direct manufacturing costs since the level of activity and resource consumtion for each unit can be calculated, and because activities can be traced to the final product via routing and bill-of-material. In continuous processing, operating conditions at each step of the process are responsible for resource consumption. Even though they can often be measured, it is not always feasible to keep track of the resources used with the principal flow of material. Thus, for simplicity, product homogeneity is assumed [12] and the costs are calculated based on standard recipes. These specify raw material usage (additives, chips, energy, etc) as well as target operating conditions for producing the final product within the required specifications. The resulting cost information does not correspond to actual operating conditions, and variance analysis only provides aggregated information that fails to provide the insight required for decision making. Given variability within the manufacturing process, real operating
Journal of Science & Technology for Forest Products and Processes: VOL.1, NO.1, 2011
33
conditions should be used to analyze direct manufacturing costs. Contrary to discrete-part manufacturers, the development of a cost management framework for continuous processes should emphasize the use of process variables to characterize cost generation within the plant [8]. While it is natural for process engineers to consider these aspects, they are generally not understood in cost management systems, and to a greater or lesser extent, have not yet been systematically applied in cost management systems implemented in the pulp and paper industry. The development of "activity-based" costing models in the 1990s focused on overheads and business processes, and little attention was paid to primary activities in complex continuous manufacturing environments. Thus, simplified approaches were used for the treatment of direct manufacturing costs and operational activities [13]. For the pulp and paper industry, this treatment is a critical issue, as direct manufacturing costs are charged to the product based on a relatively systematic approximation of the process conditions and process-related activities in the mill. Similar to the discussion on overheads that led to the development of activity-based costing in The hidden factory [14], the pulp and paper industry uses methods (e.g. standard costing) to relate direct manufacturing costs to product, but these methods do not provide a useful explanation about how costs are generated within the main processing operations.
Technological challenges, as well as a lack of guidelines and systematic methods have constrained the industry from addressing this data-intensive challenge. Presently, with the advent of information management systems (IMS), this challenge has become less restrictive. Using systems-oriented and multidisciplinary approaches, it is now possible to analyze process and cost data in an integrated manner to better understand the main processing operations. This not only provides an improved basis for cost management, but also assists the application of higher-level decision support tools such as supply chain optimization or multi-criteria decision-making for retrofit process design. Especially for companies wishing to evolve their cost systems for enlarged product portfolios including for example bioproducts, this improved cost information for decision-making will become an imperative to success in corporate transformation. OBJECTIVE
The goal of this project was to develop a framework for creating an operationsdriven cost model that integrates process and cost information in order to improve the quality of manufacturing costs of pulp and paper mills. Specifically, the three following requirements were considered for the elaboration of the cost model: 1. It should emphasize "bottom-up thinking" where, rather than providing aggregated cost information, the information coming from process is
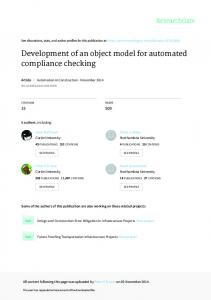
Fig. 1 - Overview of the process-based business modeling approach
34
J-FOR
systematically integrated into the cost model to reflect the capability of the mainline processing operations. 2. Given their importance in pulp and paper mills, the approach must incorporate an improved representation of overhead costs within the model. 3. The framework should not be problemspecific. An approach should be used in order to represent various processes in order to provide a general framework for process operations and process design decision-making. More generally, the aim of this work was to discuss how process systems engineering tools, which emphasize visibility of information and structural flexibility, can help to manage, analyze and interpret information to support decision making for process design and operation. “BOTTOM-UP” APPROACH
The process-based business modeling approach [3, 15-16] , schematically represented in Fig. 1, is based on “bottom-up” or “operations-driven” thinking, which is the approach that employs reconciled process data and detailed process analysis to better reflect manufacturing capability for higher-level decision-making. Therefore, the overall approach aims first to characterize the manufacturing operations (descriptive) and second, to provide advanced decision support (prescriptive). To achieve these goals, four main steps are considered: data acquisition, process analysis, process and cost modeling, and decision-support
Fig. 2 - Relationship between resources, activities, and objects in ABC
Journal of Science & Technology for Forest Products and Processes: VOL.1, NO.1, 2011
TRADITIONAL AREA CONTRIBUTIONS
Fig. 3 - Representation of how Work Centres are structured within the operations-driven cost model
modeling. Process and cost data, typically provided by information management systems at mills, may come from various sources such as process simulations, general ledgers, etc. Many tools and approaches can be used to collect, treat and analyze these data, in order to extract the necessary and relevant information for decision-making. The operations-driven cost model is the central element where cost and process information are captured and systematically integrated to characterize the continuous processes. Due to its structure, the cost model can be used to support either design or operational decision processes. For example, in the case of operations, it can be used to support supply chain optimization whereas in retrofit design, it can be used to support a multicriteria decision making process for evaluating different design options. OPERATIONS-DRIVEN COST MODEL
Process and cost information must be integrated and linked to the manufacturing processes at the mill and ultimately, the cost object. The functional unit for which the cost is measured defines the cost object. It can be an activity, a product, a process, a service, a division, etc. Activity-Based Costing (ABC) is now a well-known method that was developed for modern manufacturing environments with the goal of demystifying J-FOR
overhead costs that were traditionally assigned to cost objects using inappropriate allocation bases [17]. ABC consists of modeling the usage of resources by activities performed, as well as the activities required by the cost object. Although this approach traces overhead costs to activities, the relationships used in ABC-based cost systems to link primary resources (direct manufacturing costs) to cost objects are often too simplistic (e.g. direct charges) and are inappropriate for consideration in continuous process environments. Nevertheless, the ABC approach provides important extensions [18] to traditional costing systems that are particularly relevant for the elaboration of an operations-driven cost model in pulp and paper: Use of activities and processes as the focus of cost systems, Tracing the cost of using the resources, Using a richer set of cost drivers (based on observable measures) to reflect operational complexity. By using “bottom-up” process and cost information, resource and activity drivers can be identified and mill-wide correlations can be reflected to characterize cost generation within the mill’s main processing operations (Fig. 2). Therefore, the operationsdriven cost model is based on “ABC-like” principles that incorporate and emphasize
the importance of the process perspective as a source of costs, which allows production managers to better track and control their costs. As mentioned earlier, cost modeling of continuous processes needs to consider both the design of the manufacturing processes and the specific operating conditions used to manufacture different products. In this context, the following elements must be introduced in the cost model: 1. The cost centre corresponds to a collection of physical process units that represent part of the manufacturing process. The routing of these cost centres, and the specification of the equipment used, is defined by the process design. The level of aggregation of the various cost centres has to be determined with respect to the type of decision that is to be made using the overall business model approach. 2. Activities refer to the operating conditions at each of the cost centres, e.g. running a pump or a heat exchanger, drying pulp or paper, etc. They are characterized by process information resulting from a systematic bottom-up analysis approach, e.g. flow rate, consistency, temperature, and pressure, or other physically measurable process variables.
Journal of Science & Technology for Forest Products and Processes: VOL.1, NO.1, 2011
35
Within the operations-driven cost model, cost centres and activities are considered together in an element called the Process Work Centre (PWC). As shown in Fig. 3, a mill is represented by a group of PWCs that are arranged in series and/or in parallel. An Overhead Work Centre is also introduced for modeling production overheads and nonmanufacturing costs because they must be treated differently from a computational standpoint. When the cost model is calculated, the costs flow between the PWCs as defined in the model, and accumulate in the Overall Cost Object. This final cost object can for instance be the product cost for different operating conditions of a given design or for process design alternatives. The operations-driven cost model in this study was developed using the Impact:ECSTM software package from 3C Software Inc (Atlanta). This tool is particularly well adapted to the needs of complex production process environments, such as those in the pulp and paper industry, and it has been adopted by several leading pulp and paper companies. Its underlying platform, based on a relational database, allows for an efficient structure and management of process and cost information flows within the model. Moreover, the flexibility of Impact:ECSTM provides the ability to customize the storage of data, the calculation execution order and the structure of the model [19- 20]. PROCESS WORK CENTRE
One of the key elements of the cost model is the structure used to represent main processing operations at the mill. A generic framework was developed that permits the PWC to accommodate the cost flow along the process, the bottom-up feeding of process information, the need for flexible specific calculations, the assignment of overheads, and a standard process-based cost calculation. This structure consists of two main sections, i.e., the local factors and the routings (see Fig. 4). Local factors are units of information specific to, or characteristic of a PWC, and can be accessed only by operations called for in the PWC in which they reside. They can be classified into three groups: Work Centre Characterization, Specific Information and Reporting. 36
J-FOR
Within the first group, local factors permit the introduction of general information needed to define a particular PWC e.g. the name, the reference flow as well as the overall product reference flow. Different scenarios can also be considered using binary parameters. The role of the second group (“Specific Information”) is to allow the user to interact with the inputs of the specific calculations (to be further discussed later). The third group of local factors is used to report information. It provides quick access to the main results and important outputs when the calculation is done. The PWC structure has multiple routings that define a step-by-step approach to the functions that have to be performed during cost calculations (Fig. 4). This ensures a structured flow and logical treatment of information throughout the model. The first routing, Cost Flow In, establishes the calculation order by enforcing the precedent PWCs to compile before. It also pulls the previously calculated cost information within the current PWC. The second routing, Process Information, loads and stores the information coming from the Process Value Table that contains all “bottom-up” data that are used to characterize the particular activities that are accomplished in the PWC. It is also possible to add or modify process information in order to perform a sensitivity analysis. The main routing, Cost Calculation, dictates how the process, overhead, and cost information are structured and how the PWC is calculated. It consists of four sections: Initialization, Specific Calculation, Process Cost, and Overhead Assignment (Fig. 4). Except for specific calculations, the three sections are generic, regardless of the PWC. The fourth and the fifth routing, Resources and Current Contribution, are used mainly for reporting purposes. Resources displays the results for each step of the cost calculation, in an ABC-like fashion where the relations between resource consumption, activities performed and the cost object are shown. Current Contribution aggregates all the cost information obtained
Fig. 4 - Representation of a Process Work Centre within the cost model
from the previous and the current PWCs. This aggregated information is then available for the routing Cost Flow Out and also or the local factors (under Reporting). Finally, Cost Flow Out takes the aggregated cost information and makes it available for other subsequent PWCs in the model. Cost calculation routing
Process cost Process cost, which is at the heart of the PWC, performs the generic cost calculation using the ABC-like approach discussed earlier. This is used to establish engineering-based relationships using mass and energy balances, for resource consumption within the mill. Given specified local factors (e.g. tags to consider), and since the appropriate cost drivers come from “bottom-up” approach (Process Value Table, based on process information), both the production process and the operating conditions are systematically considered for cost calculations. Figure 5 illustrates the structure and how the information is managed within the Process Cost script that integrates five important elements: the Local Factors, two routings of the PWC (Process Information, and Process Cost), the Tag Table and the Resource Cost Table. More precisely, the script consists of the following steps: A. Information characterizing the current PWC is extracted from local factors. B. Using this information, the script can search within the Process Value Table and the Process Information routing for process information linked to resources and reference flows relevant for the calculations. C. After obtaining the process information,
Journal of Science & Technology for Forest Products and Processes: VOL.1, NO.1, 2011
TRADITIONAL AREA CONTRIBUTIONS the particular type of resources associated with each element classified as a resource, needs to be identified. The tag identification number of the element is used to acquire the resource identification number from the Tag Table. D. Given the type of resource, it is then possible to obtain the unit costs for each of the resources considered from the Resource Cost Table. E. When all the relevant information has been gathered, costs are calculated within the script using an ABC-like structure that employs a combination of drivers to relate the resource consumption to the final cost object. First, the unit costs are multiplied by the resource driver that determines the consumption rate of a particular resource for a given reference flow, which is most closely related to the resource (e.g. n kg of chemical per BDMT of chip). Then, using an
appropriate combination of reference flows, the consumption of the resource is linked to the PWC. It provides the cost of the resource consumed given the PWC reference flow. Finally, using the ratio of the PWC reference flow to the overall product reference flow, the costs are attached to the final cost object. F. The results of the different steps for the Process Cost Script are displayed within the Reporting section of the local factors and stored in the Resource routing. Overhead Assignment Some overhead items can be assigned to each of the PWCs based on specific rules. Thus, the main purpose of this script is to integrate information needed to provide the required visibility of the portion of the overhead that can be traced to the production process. Since there is no overhead calculation done locally in the PWCs,
Overhead Assignment extracts and integrates the particular cost information that has been treated by the OWC. Specific Calculations The aim of the operations-driven calculation engine is to be as generic as possible in order to apply to any type of process. At the same time, every manufacturing process is unique. The cost model structure needs to have enough flexibility to be able to address specific calculation requirements. While the underlying process structure is always valid, in some situations it is necessary to perform preliminary “side-bar” calculations to fit the standard structure. An example of a specific calculation is to transform the units of a flow rate from l/min to kg/min, or to calculate the mass flow rate in BDMT/h using the flow rate in l/min and the consistency of the flow. It is preferable to use a preformatted user-friendly calculator that allows for easy build-up of a series of simple commands to be performed.
Fig. 5 - Process-based work centres for calculation of the reject refining operating cost
J-FOR
Journal of Science & Technology for Forest Products and Processes: VOL.1, NO.1, 2011
37
This approach is very convenient for users to view, understand and modify calculations.
EXAMPLES OF APPLICATION RESULTS
In this section, we present examples of results obtained by the application of the operations-driven cost modeling approach in the context of both process design and operations. These results are only briefly described and the authors refer to Parts 2 and 3 for a more detailed description.
Illustrative example
The operating cost of a reject refiner is calculated using the operations-driven cost modeling approach (Fig. 5). First, relevant process information is gathered for the PWC “pulp cleaning.” The values gathered at five data acquisition points (“Tags”) are the results of a process data analysis. This process information is then stored and classified in the Process Value Table using a systematic method based on a traditional process unit representation. Every entry within this table specifies the attached PWC, the tag identification number, the process value itself and the units. For each element within the table, we differentiate between a resource, a reference flow, a PWC reference flow, or a product reference flow (see the description of tags in Fig. 5). Two specific calculations are done to determine the mass flow rate to the reject refiner. Then, using the information from the Process Value, Tag and Resource Unit Cost tables and the specific calculations, the Process Cost script calculates the cost in $/BDMT for the reject refiner under the given process conditions. The resulting cost information is reported in the local factors and added to the cumulated pulp cleaning cost. OVERHEADS WORK CENTRE
The Overheads Work Centre (OWC) is included to estimate the mill burden, or indirect manufacturing and non-manufacturing costs within the cost model. The structure developed for the OWC (Fig. 6) is significantly different from the PWC. Although local factors have a similar function, the main differences reside in the structure and use of routings. The Overhead Cost routing is the principal component of the structure. It is used to manage overhead-related information and to structure calculations. First, the accounting period associated with the overheads is set. Then General OH Calculation determines an hourly rate for each overhead item as well as the general aggregated overhead cost for each category defined in the accounting system of the mill. Using the allocation base information available, each item considered is classified 38
J-FOR
Operations Fig. 6 - Representation of the Overheads Work Centre (OWC) within the cost model
into either one of two groups: items that can be specifically allocated using precise information on how resources are used, to a PWC (e.g. supplies, maintenance, labour, etc.) and items that are arbitrarily allocated to the final cost object (e.g. insurance, administration). Cost Pools aggregate the cost items of the first group that have the same allocation base and, within Allocation, distribute them among the PWCs, depending on their share of this allocation base. Assignment loads the results in the Overhead Table described earlier, which is called by the PWCs. Finally, the Arbitrary Allocation routing is responsible for the aggregation of the costs of all items to be allocated to the final cost object. This information is using Cost Flow Out.
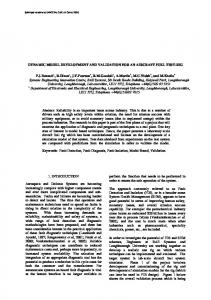
The aim of the cost model development is to characterize the direct manufacturing grade costs of a BCTMP pulp mill in order to support a bottom-up supply chain planning approach where manufacturing capability is determined using lower-level process data. Given the supply chain perspective, a relatively high-level model was developed by primarily considering the main manufacturing activities i.e. the pulping process. Seven PWCs were used to describe the operations and 30 tags were selected from the process data historian at the mill to characterize the cost model drivers (resources and activities). The corresponding process data, for a period of three months, for a period of three months, were treated and stored in a relational database and integrated with other relevant mill information (e.g. production schedules). The analysis of the data, accomplished using queries, statistics
Fig. 7 - Application for operations: grade cost analysis for a BCTMP pulp mill
Journal of Science & Technology for Forest Products and Processes: VOL.1, NO.1, 2011
TRADITIONAL AREA CONTRIBUTIONS
Fig. 8 - Application for retrofit process design: manufacturing cost per design alternatives
and visualisation tools, allows for the identification of resource consumption patterns that are different compared to the standard recipes. The data describing these patterns, or so-called process information, are used as inputs to populate the different parameters of the cost model. Figure 7 shows the direct manufacturing costs calculated using the operations-driven approach, for each production campaign of a given pulp grade. Since fibre supply is an important supply chain decision variable, the cost of fibre is not taken into account within this model but rather, this cost is optimized within the supply chain problem. As shown, the results of the operations-driven cost model provide an interesting perspective compared to standard and actual costing approaches. Since cost drivers are calculated using historical process data and consumption patterns may have some similarities with recipes, the operations-driven approach is considered as being in between the standard and actual costing approach. Nevertheless, the real advantage of the proposed approach is the use of available process data with an ABClike approach to identify, analyze and interpret the cost implications of various consumption patterns within the mill. This is more consistent with managerial accounting and should be used as a basis for performance
J-FOR
assessment and continuous cost improvement at the mill. For continuous processes, such as a pulp mill, it is essential to consider the process perspective and the operationsdriven approach, and to use process and mill data. This is the key to better understanding the generation of costs within the mill and to providing the required visibility of the cost performance of the manufacturing operations for supply chain planning. Retrofit Design
In this case, the operations-driven approach is applied in the context of a large-scale retrofit design problem. The aim is to better quantify cost implications of several retrofit design alternatives for increased deinked pulp production and cogeneration at an integrated newsprint mill. For each design alternative the capital costs and mass and energy balances were calculated. The operations-driven cost model that was developed to evaluate the operating costs and profitability of the alternatives used these data. Figure 8 presents the direct and indirect manufacturing costs obtained for the existing mill and each alternative considered. The colours represent the various PWCs considered for the analysis and the negative costs indicate either an income (e.g. cogenerated electricity sales) or a transfer (e.g.
overhead outside the mill). One of the main advantages of using the operations-driven approach for retrofit design is the efficient and transparent evaluation of manufacturing costs based on a systematic description of the consumption of the resources by the PWCs. For example, in Fig. 8, using process information, the higher manufacturing cost for the paper mill PWC can be traced back to higher steam prices and thus, increased use of natural gas (as opposed to wood waste). The variation of overheads per alternatives, that is small compare to direct costs, is caused by a number of factors such as differences in maintenance material, tax credits, etc. This indicates that even though overheads should be taken into account within the overall design process, it may not be an important factor to differentiate between the proposed alternatives. Finally, compared to traditional techno-economic studies, the operations-driven approach is better able to examine critical design variables and operating variants. Important PWCs can be identified and the changes in cost per activity in the PWCs can be assessed efficiently. DATA QUALITY AND MODEL STRUCTURE
In order to construct the cost model, different sources and types of information must be considered. The relevance of any individual data stream for the decision making process tends to fall within the realm of judgement. Even though companies recognize the importance of system integration, data often comes from a variety of sources with different degrees of reliability, e.g. the accounting system, the process information management system, the laboratory information management system, spreadsheets, etc. The integrity and nature of the data must be carefully assessed before they are used. Moreover, to address uncertainty in the data, sensitivity analysis is used to identify the elements that have the greatest impact on the model output and thus, require specific attention from the decision maker. Although the integration and relational analysis of the process and cost information are key elements of the multidisciplinary
Journal of Science & Technology for Forest Products and Processes: VOL.1, NO.1, 2011
39
cost model, a similar approach could be developed using non-relational spreadsheets. However, compared to more sophisticated tools like Impact:ECSTM, the flexibility and capability of the analysis would be reduced and the opportunity to leverage large amounts of information into valuable outputs for decision-support would be more difficult to realize. It would also be more challenging to manage information across many process design alternatives and also, in the operational context, to maintain the integrity of the cost model over time. IMPLICATIONS OF THE OPERATIONSDRIVEN COST MODEL
The cost model presented in this paper has the following advantages: The integration of process and cost information, the “bottom-up” calculation engine, and the process-based aggregation of costs allows for a more in-depth description of continuous processing operations. This, along with the use of the ABC-like concepts, provides a tool to better understand costs within the complex environments of pulp and paper mills. It increases visibility of the process perspective and traces direct manufacturing costs more precisely than typical cost systems. As shown by the application examples, this improved characterization of manufacturing operations provides information that can be used in the context of retrofit design and supply chain optimization. The PWC structure, which is the basic element of the process-based business model, provides a versatile tool for representing industrial manufacturing processes. It is built to match the common definition of a process unit and specific calculations can accommodate particular cases. Furthermore, the structure can be used to represent and analyze different operating conditions (regimes) and design alternatives. Compared to typical ABC approaches where observable measures (used to analyze activities) are determined by interviews and surveys, the operationsdriven approach uses data that are 40
J-FOR
typically available at mills. This is a significant advantage since it provides a reliable source of information that requires minimum effort to obtain. Also, with the integration of process and cost information, the model can serve as a basis for the comparison and the reconciliation of information coming from different sources. For example, the grade cost information obtained with this model can be compared with actual and standard costs. In the context of process design, it helps to keep process and cost information synchronized; this is an improvement of the traditional process design in which the process and cost models are typically maintained separately. Since the costs are easily traceable to process unit operations, significant benefits can be achieved if the model were to be used and maintained by process/operation engineers who have the ability to control or act on costs incurred during production. The work presented in this article tries to define new guidelines for a better use and integration of available cost and process data at pulp and paper mills. If continuously used at a mill, the proposed model could be the starting point for addressing operational and design problems using the same framework. It provides a more consistent model that can be used or adapted for different kinds of questions, instead of building new models for new problems. CONCLUSIONS
With the advent of information management systems, the pulp and paper industry has the opportunity to extract additional value from data by using tools such as the proposed operations-driven cost model and to use the generated information for improved decision making. The principal challenges of this approach are not related to information technology itself, but rather to the designed approach integrating the following elements: 1) understanding the available tools, 2) understanding the business and manufacturing processes, 3) developing new and specific methods, frameworks and models and 4) understanding the needs of
the decision making activities. Case studies for the application of the operations-driven cost modeling for retrofit process design and supply chain optimization are respectively presented in Parts 2 and 3. ACKNOWLEDGEMENTS
The authors wish to thank Paul Naliwajka at 3C Software Inc. for his expert advice in getting the cost model designed and built within Impact:ECSTM. We would also like to thank Kevin Riemer for his contribution of pulp and paper business and technical knowledge. This work was supported by the Natural Sciences and Engineering Research Council of Canada (NSERC) Environmental Design Engineering Chain at École Polytechnique de Montréal, and a scholarship provided to Martin Laflamme-Mayer from Le Fond Québécois de la Recherche sur la Nature et les Technologies (FQRNT). REFERENCES 1.
Orzechowska, A., "Saving the Canadian industry: Discussing possible solutions" Pulp & Paper Canada, 106, 25-27(2005). 2. Eamer, R.J., International Finance Forum for the Pulp, Paper, and Allied Industries, Atlanta, USA (2003). 3. Janssen, M., Laflamme-Mayer, M., Zeinou, M.H., and Stuart, P.R., Pulp and Paper, 78:6(2004). 4. Janssen, M., Laflamme-Mayer, M., and Stuart, P.R., FOCAPO 2003: Proceedings Foundations Of Computer Aided Process Operations, Coral Springs, FL, USA (2003). 5. Lail, P., Pulp & Paper, 78:9(2004). 6. Horngren, C.T., Foster, G., and Bamber, L.S., Cost accounting : a managerial emphasis. 7th ed. Prentice Hall series in accounting, Englewood Cliffs, N.J. (1991). 7. Crama, Y., Pochet, Y., and Wera, Y., Core Discussion Paper, 42 (2001). 8. Reeve, J.M., Journal of Cost Management (1991). 9. Lail, P.W., Supply chain best practices for the pulp and paper industry, Atlanta, GA (2003). 10. Fogelholm, J., Cost function modelling in the paper industries, PhD Thesis, Helsinki University of Technology, Helsinki (2000). 11. Kreipl, S., Pinedo, M., Production and
Journal of Science & Technology for Forest Products and Processes: VOL.1, NO.1, 2011
TRADITIONAL AREA CONTRIBUTIONS operations management, 13:1 (2004). 12. Kaplan, R.S.R., Harvard Business Review, 66:1(1988). 13. Boons, A.N.A.M., International Journal of Production Economics, 55:3 (1998). 14. Miller, J.G.J., and Vollmann, T.E.T., Harvard business review, 63:5 (1985). 15. Laflamme-Mayer, M., Linkewich, J., and Stuart, P. R., Pulp and Paper Technical Association of Canada: 91st Annual Meeting Preprints, Montreal, Canada (2005).
www.paptac.ca
16. Janssen, M., and Stuart, P.R., "Business model framework for using real-time process data for design decision-making" Proceedings of the Inaugural Canadian
Design Engineering Network (CDEN) Conference, Montreal, Canada (2004). 17. Gunasekaran, A., Marri, H.B., and Yusuf, Y.Y., Managerial Auditing Journal, 14:6 (1999). 18. Kaplan, R.S., and Cooper R., Cost & effect : using integrated cost systems to drive profitability and performance,
Boston, (1998). 19. Yeager, B., "Costing software helps Sappi mills make the grade more efficiently" Pulp & Paper, 73, 63-66 (1999). 20. Songy, S., "IT System Gives Managers Standardized View of Costs at MultiSite Companies" Pulp & Paper, 78, 42-45 (2004).
PAPTAC's WEBTECH COURSES As a result of a growing demand for courses to be offered on the Web, PAPTAC is adapting its current course roster and will offer these using the Webinar Technology. Members will have the flexibility to register for one or several topics as per their interest and availability.
Other topics of growing interest such as: Mill Trial Planning & Execution; Statistical Analysis; Effective Meetings; Communication & Teamwork; and Time & Priority Management are also being developed.
The courses currently offered by PAPTAC are: Recycling & Deinking
Mechanical Pulping
Chimie de la partie humide
Kraft Pulping
Energy Efficiency
Fabrication du Papier – parties humides et sèches
Theory & Practice of Papermaking
Chip &Wood Quality
Pulp Bleaching
For more information on PAPTAC's courses, please contact PAPTAC (514-392-0265 /
[email protected]).
PAPTAC NEWS
J-FOR
Journal of Science & Technology for Forest Products and Processes: VOL.1, NO.1, 2011
41