International Engineering Education Conference (IEEC09), 16~18May, Madinah, Kingdom of Saudi Arabia, 2009.
DEVELOPMENT OF GENETIC ALGORITHMS AND MULTILAYER PERCEPTRON NEURAL NETWORK (MPNN) MODEL TO STUDY THE STUDENT PERFORMANCE IN THERMODYNAMICS K.Kadirgama1, M.M.Noor1, M.S.M.Sani1, M.M.Rahman1, M.R.M.Rejab1, M.Y.Taib1, A.Sulaiman1, Abdullah Ibrahim2, Rosli A.Bakar3 1
Faculty of Mechanical Engineering, Universiti Malaysia Pahang, 26300 UMP, Kuantan, Pahang, MALAYSIA. Phone: +609-5492223 Fax: +609-5492244, Email:
[email protected] /
[email protected] 2 Academic Staff Development Center, Universiti Malaysia Pahang, Email:
[email protected] 3 Automotive Excellent Center, Universiti Malaysia Pahang, Email:
[email protected]
ABSTRACT Student performance is very crucial to any educational institution. The neural network and genetic algorithms (GA) method were used to measure student performance in Thermodynamic at Faculty of Mechanical Engineering, University Malaysia Pahang (UMP). Randomly 65 mechanical engineering students with two different cohorts were picked to analysis their performance in these subjects with 5 variables which are Test 1, Test 2, Assignments, Final Examination and Quizzes. The analysis was done to measure the student performance in Thermodynamic I which final grade was used as the tools. The models show that Test 1 and Test 2 plays major role in the student final grade. Meanwhile assignments and quizzes play as a booster to their performances. Those who performance well in their testes, will maintain the momentum in their final. It’s proven that the early of the syllabus as fundamental knowledge must be strong, if the students want to do well in Thermodynamic I. The artificial intelligent model can be used for further investigate of the subject performance with include more predictor such as age, CGPA, gender and etc. Keywords: Thermodynamics I, Statistical, Genetic Algorithms, Test
INTRODUCTION Performances are always crucial to be evaluated. Thru the performance evaluations, then the educational provider can carry out the quality improvement. To produce good engineer, the effort of the student and lecturer must be good. According to K.Kadirgama et al. [1] in order to have good graduate engineer the foundation must be very strong, if the students want to graduate with good result. Sani et al. [2] claims that survey was found to be an essential tool to measure the performance of the student. M.M.Noor et al. found that it’s very important for all the lecturers to understand and implemented student performance evaluation and its can be measured and continuously improvement can be done [3]. The student
International Engineering Education Conference (IEEC09), 16~18May, Madinah, Kingdom of Saudi Arabia, 2009.
performance in Thermodynamics are evaluated with the sample consists of various groups of individuals such as males and females, or different intervention groups, regression analysis can be performed to examine whether the effects of independent variables on a dependent variable differ across groups, either in terms of intercept or slope. These groups can be considered from different populations (e.g., male population or female population), and the population is considered heterogeneous in that these subpopulations may require different population parameters to adequately capture their characteristics. Since this source of population heterogeneity is based on observed group memberships such as gender, the data can be analyzed using regression models by taking into consideration multiple groups. In the methodology literature, subpopulations that can be identified beforehand are called groups [4, 5]. Model can account for all kinds of individual differences. Regression mixture models described here are a part of a general framework of finite mixture models [6] and can be viewed as a combination of the conventional regression model and the classic latent class model [7]. It should be noted that there are various types of regression mixture models [7], but this only focus on the linear regression mixture model. The following sections will first describe some unique characteristics of the linear regression mixture model in comparison to the conventional linear regression model, including integration of covariates into the model. Second, a step-by-step regression mixture analysis of empirical data demonstrates how the linear regression mixture model may be used by incorporating population heterogeneity into the model. Ko et al. [8] have introduced an unsupervised, self-organised neural network combined with an adaptive time-series AR modelling algorithm to monitor tool breakage in milling operations. The machining parameters and average peak force have been used to build the AR model and neural network. Lee and Lee [9] have used a neural network-based approach to show that by using the force ratio, flank wear can be predicted within 8% to 11.9% error and by using force increment; the prediction error can be kept within 10.3% of the actual wear. Choudhury et al. [10] have used an optical fibre to sense the dimensional changes of the work-piece and correlated it to the tool wear using a neural network approach. Dimla and Lister [11] have acquired the data of cutting force, vibration and measured wear during turning and a neural network has been trained to distinguish the tool state. This paper mainly focus on the development of the artificial intelligent model to predict the thermodynamics I outcome and investigate the relationship between the variables (test 1, test 2, assignment, quizzes and final examination) and outcome (Thermodynamics I)
MULTILAYER PERCEPTIONS NEURAL NETWORK In the current application, the objective is to use the supervised network with multilayer perceptions neural network (MPNN) and train with the backpropagation algorithm (with momentum). The components of the input pattern
International Engineering Education Conference (IEEC09), 16~18May, Madinah, Kingdom of Saudi Arabia, 2009.
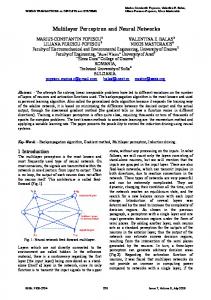
consist of the control variables used in the student performance (Test 1, Test 2, Quiz, Assignment and final exam), whereas the components of the output pattern represent the responses from sensors (Thermodynamic 1). During the training process, initially all patterns in the training set were presented to the network and the corresponding error parameter (sum of squared errors over the neurons in the output layer) was found for each of them. Then the pattern with the maximum error was found which was used for changing the synaptic weights. Once the weights were changed, all the training patterns were again fed to the network and the pattern with the maximum error was then found. This process was continued till the maximum error in the training set became less than the allowable error specified by the user. This method has the advantage of avoiding a large number of computations, as only the pattern with the maximum error was used for changing the weights. Genetic algorithms used to find the optimum weights to be use in MPNN. Fig.1 shows the neural network computational mode with 5-8-1 structure. Test 1
Test 2
Quiz
Assignment
Final exam
Input
Output
Hidden layer
Thermodynamic 1
Output
Fig. 1: Neural Network with 5-8-1 structure.
RESULT AND DISCUSSION Total of 65 students randomly selected to investigate their performance in Thermodynamics 1. The table 1 shows the results of the students and the prediction output by the neural network. The prediction models predict the final outcome of the Thermodynamics quite accurately. The set of measurements, immediately prior to a thermodynamic measurement, had been used for training the neural network. About 113 patterns were collected. About 90% of the data 101 patterns, were used to train the different network architectures, where remaining
International Engineering Education Conference (IEEC09), 16~18May, Madinah, Kingdom of Saudi Arabia, 2009.
12 patterns were used for testing to verify the prediction ability of each trained NN model. Since, Multilayer Perceptron Neural Network (MPNN) learn relations and approximate function mapping limited by the extent of the training data, the best use of the trained MPNN models can be achieved in interpolation. Table 1 shows the MPNN output for prediction Thermodynamic 1, from the analysis of the results in Table 1, it is observed that the accuracy of the MPNN method was slightly superior when compared to the experimental results on account of Mean Standard Error (MSE) as shown in Figure 2. Figure 3 shows the sensitivity test of the model. It clearly shows that final exam influences the student performance in Thermodynamic 1. Even though some students were excel in their test 1 and test 2, but then their final outcome of the thermodynamic totally affected by their final examination. Other than the final examination, Test 1 and Test2 plays quite important role in student performance. Assignment and quizzes plays as a booster for the student performance. The prediction model are very important for the educator to measure the outcome and investigate the relationship between the variables (Test 1, Test 2, assignment, quizzes and final examination) towards final outcome. Table 1: Prediction results by the MPNN. Test 1
Test 2
Quiz
Assignment
Final Exam
Final mark
Prediction output
53.33 26.67 20.00 66.67 80.00 56.67 23.33 26.67 66.67 83.33 36.67 30.00 63.33 66.67 70.00 63.33 36.67 63.33 33.33 40.00 70.00 50.00 40.00
100.00 96.67 71.67 80.00 85.00 71.67 53.33 88.33 93.33 93.33 80.00 90.00 100.00 85.00 100.00 86.67 56.67 93.33 93.33 86.67 90.00 100.00 51.67
10.0 8.0 8.0 8.0 8.0 10.0 8.0 7.0 10.0 9.0 9.0 6.0 8.0 7.0 8.0 8.0 10.0 8.0 10.0 8.0 7.0 10.0 10.0
6.0 7.0 7.5 6.0 6.5 7.5 7.0 7.5 6.0 7.0 6.0 6.0 7.0 6.0 6.0 6.0 6.5 6.0 7.5 7.0 7.1 5.6 6.6
91.25 86.25 47.50 57.50 87.50 66.25 66.25 66.25 76.25 65.00 63.75 21.25 67.50 58.75 72.50 70.00 55.00 82.50 52.50 63.75 76.25 75.00 60.00
83.20 75.00 55.25 66.50 83.15 72.15 60.10 65.35 78.00 75.80 65.60 46.00 73.40 66.55 76.00 72.00 60.20 77.40 65.00 67.10 77.55 75.80 61.70
81.67 76.29 55.26 66.51 81.59 72.50 60.19 65.89 78.23 76.87 65.46 46.16 74.77 66.60 76.48 72.75 59.98 78.42 65.75 67.33 77.20 75.78 62.29
International Engineering Education Conference (IEEC09), 16~18May, Madinah, Kingdom of Saudi Arabia, 2009.
76.67 33.33 50.00 46.67 60.00 70.00 43.33 56.67 70.00 23.33 23.33 63.33 50.00 30.00 70.00 43.33 56.67 83.33 20.00 70.00 40.00 83.33 33.33 70.00 56.67 40.00 33.33 36.67 70.00 40.00 33.33 53.33 40.00 23.33 16.67 30.00 70.00 10.00 40.00 96.67 36.67 63.33
100.00 40.00 100.00 100.00 75.00 96.67 100.00 58.33 96.67 96.67 85.00 95.00 86.67 96.67 96.67 100.00 80.00 100.00 68.33 86.67 93.33 93.33 80.00 88.33 95.00 93.33 88.33 93.33 93.33 86.67 66.67 88.33 73.33 85.00 93.33 80.00 93.33 93.33 93.33 88.33 93.33 93.33
10.0 10.0 10.0 10.0 10.0 10.0 10.0 10.0 10.0 10.0 10.0 10.0 10.0 10.0 6.0 10.0 10.0 10.0 10.0 10.0 8.9 9.3 8.5 8.7 9.5 8.7 9.0 8.7 9.3 8.7 8.3 8.1 8.1 8.7 8.4 9.2 9.1 8.0 8.5 8.1 8.9 9.0
6.9 7.5 5.0 6.0 6.0 6.5 6.0 7.5 7.5 7.5 7.5 8.0 6.5 7.0 7.7 6.9 7.0 6.7 6.9 6.0 7.2 7.2 5.7 6.7 5.9 7.2 6.9 7.2 6.9 7.2 5.9 6.2 6.9 5.6 6.4 6.7 6.7 3.5 6.9 6.5 7.2 6.5
90.00 35.00 76.25 81.25 56.25 72.50 67.50 32.50 75.00 56.25 51.25 90.00 63.75 58.75 62.50 63.75 77.50 85.00 63.75 58.75 58.75 88.75 72.50 76.88 72.50 60.00 76.25 61.25 76.25 60.00 41.25 40.00 27.50 58.13 62.50 46.88 75.63 11.25 42.50 65.00 31.25 65.63
87.00 50.10 75.00 77.50 66.45 77.40 71.40 55.25 80.00 65.50 63.15 85.45 70.00 68.40 71.30 71.50 75.80 85.75 63.15 70.50 67.80 85.70 68.10 78.10 74.95 67.10 72.85 67.00 80.20 67.20 54.70 59.95 50.30 61.60 64.70 60.15 79.85 40.30 60.60 76.35 55.30 73.25
84.06 51.06 75.59 77.99 66.56 78.27 72.30 55.66 80.17 66.260 62.38 83.58 70.73 67.48 72.02 72.05 77.16 83.47 63.69 71.10 67.58 83.90 67.93 78.16 75.16 67.88 73.12 67.88 79.12 66.88 52.12 57.79 50.18 60.39 63.29 58.14 78.55 43.87 59.16 76.79 55.20 73.48
International Engineering Education Conference (IEEC09), 16~18May, Madinah, Kingdom of Saudi Arabia, 2009.
Best Network Epoch # Minimum MSE
Training 10000 0.000926
Final MSE
0.000926
Figure 2: The MPNN training output.
Sensitivity test 1 test 2 quiz assignment final
Total 1.97 1.12 0.76 0.68 4.42
Figure 3: The sensitivity test
CONCLUSION The overall goal of the proposed research is to develop methodologies using MPNN for predicting the effects of the test 1, test 2, assignments, quizzes and final examination on thermodynamics 1 as follows: • MPNN proved to be an efficient tool to optimize and investigate the student performance in thermodynamics 1. The use of MPNN in modelling of student performance allows for considering process details that analytical models cannot handle and for predicting variables.
International Engineering Education Conference (IEEC09), 16~18May, Madinah, Kingdom of Saudi Arabia, 2009.
• •
Final Examination plays a very important role for the student performance in thermodynamics 1 follow by test 1 and test 2. Assignment and quizzes plays as a booster to the student performance. Finally, the simulations results show that MPNN can be very successively used for investigate student performance whereas it can give the detail relationships between the variables and the outcome. This means that it can solve many problems that have mathematical and time difficulties.
ACKNOWLEDGEMENT The authors would like to express their deep gratitude to Universiti Malaysia Pahang (UMP) for provided the financial support.
REFERENCES [1] M.S.M.Sani, M.M.Noor, A.Senawi, A.Sulaiman, M.R.M.Rejab, Assessment
of the Mechanical Engineering Programs by Exit Surveys at University Malaysia Pahang, 4th International Conference on University Learning and Teaching, 2008, 317-322. [2] K.Kadirgama, M.M.Noor, M.R.M.Rejab, A.N.M.Rose, N.M.Zuki N.M.,
M.S.M.Sani, A.Sulaiman, R.A.Bakar, Abdullah Ibrahim, (2008) Importance of the Pre-Requisite Subject, 4th International Conference on University Learning and Teaching, , pp. 168-172. [3] M.M.Noor,
M.R.M.Rejab, K.Kadirgama, M.S.M.Sani, A.Sulaiman, M.M.Rahman, A.N.M.Rose, R.A.Bakar, Abdullah Ibrahim, (2008) Quality Management System in the Implementation of OBE at Faculty of Mechanical Engineering, UMP, 4th International Conference on University Learning and Teaching, pp. 277-285.
[4] Muthen, B. O. & Muthen, L. K. (2000) Integrating person-centered and
variable-centered analyses: Growth mixture modelling with latent trajectory classes. Alcoholism: Clinical and Experimental Research, Vol. 24, pp. 882891. [5] Nagin, D. & Tremblay, R. E. (2001) Analyzing developmental trajectories of
distinct but related behaviours: A group-based method. Psychological Methods, Vol. 6, pp. 18-34. [6] Lazarsfeld, P. F. & Henry, N. W., (1968) Latent structure analysis. Boston:
Houghton Mifflin Company. [7] McCutcheon, A. L., (1987) Latent class analysis. Thousand Oaks, CA: Sage
Publications, Inc.
International Engineering Education Conference (IEEC09), 16~18May, Madinah, Kingdom of Saudi Arabia, 2009.
[8] T. J .Ko, D. W Cho, M. Y. Jung, (1998) On-line Monitoring of Tool
Breakage in Face Milling: Using a Self-Organized Neural Network, Journal of Manufacturing systems, Vol. 14, pp. 80-90. [9] J.H. Lee, S.J. Lee, 1999 One step ahead prediction of flank wear using cutting
force, Int. J. Mach. Tools Manufact, Vol. 39, pp. 1747–1760. [10] S.K. Chaudhury, V.K. Jain, C.V.V. Rama Rao, 1999 On-line monitoring of
tool wear in turning using a neural network; Int. J. Mach. Tools Manufact, Vol. 39, pp. 489–504. [11] D.E. Dimla, P.M. Lister, 2000 On-line metal cutting tool condition
monitoring. II: tool state classification using multi-layer perceptron neural network, Int. J. Mach. Tools Manufact, Vol. 40, pp. 769–781.