NASA/TP-2010-216116
Development of Graphical User Interface for ARRBOD (Acute Radiation Risk and BRYNTRN Organ Dose Projection)
Myung-Hee Y. Kim,1 Shaowen Hu,1 Hatem N. Nounu,1 and Francis A. Cucinotta2 1
Universities Space Research Association, Houston, TX 77058, USA NASA Johnson Space Center, Houston, TX 77058, USA
2
February 2010
THE NASA STI PROGRAM OFFICE . . . IN PROFILE Since its founding, NASA has been dedicated to the advancement of aeronautics and space science. The NASA Scientific and Technical Information (STI) Program Office plays a key part in helping NASA maintain this important role. The NASA STI Program Office is operated by Langley Research Center, the lead center for NASA’s scientific and technical information. The NASA STI Program Office provides access to the NASA STI Database, the largest collection of aeronautical and space science STI in the world. The Program Office is also NASA’s institutional mechanism for disseminating the results of its research and development activities. These results are published by NASA in the NASA STI Report Series, which includes the following report types: •
•
•
TECHNICAL PUBLICATION. Reports of completed research or a major significant phase of research that present the results of NASA programs and include extensive data or theoretical analysis. Includes compilations of significant scientific and technical data and information deemed to be of continuing reference value. NASA’s counterpart of peer-reviewed formal professional papers but has less stringent limitations on manuscript length and extent of graphic presentations. TECHNICAL MEMORANDUM. Scientific and technical findings that are preliminary or of specialized interest, e.g., quick release reports, working papers, and bibliographies that contain minimal annotation. Does not contain extensive analysis. CONTRACTOR REPORT. Scientific and technical findings by NASAsponsored contractors and grantees.
•
CONFERENCE PUBLICATION. Collected papers from scientific and technical conferences, symposia, seminars, or other meetings sponsored or cosponsored by NASA.
•
SPECIAL PUBLICATION. Scientific, technical, or historical information from NASA programs, projects, and mission, often concerned with subjects having substantial public interest.
•
TECHNICAL TRANSLATION English-language translations of foreign scientific and technical material pertinent to NASA’s mission.
Specialized services that complement the STI Program Office’s diverse offerings include creating custom thesauri, building customized databases, organizing and publishing research results . . . even providing videos. For more information about the NASA STI Program Office, see the following: •
Access the NASA STI Program Home Page at http://www.sti.nasa.gov
•
E-mail your question via the Internet to
[email protected]
•
Fax your question to the NASA Access Help Desk at (301) 621-0134
•
Telephone the NASA Access Help Desk at (301) 621-0390
•
Write to: NASA Access Help Desk NASA Center for AeroSpace Information 7115 Standard Hanover, MD 21076-1320
NASA/TP-2010-216116
Development of Graphical User Interface for ARRBOD (Acute Radiation Risk and BRYNTRN Organ Dose Projection) Myung-Hee Y. Kim,1 Shaowen Hu,1 Hatem N. Nounu,1 and Francis A. Cucinotta2 1
Universities Space Research Association, Houston, TX 77058, USA
2
NASA Johnson Space Center, Houston, TX 77058, USA
February 2010
Available from: NASA Center for AeroSpace Information 7115 Standard Drive Hanover, MD 21076-1320 301-621-0390
National Technical Information Service 5285 Port Royal Road Springfield, VA 22161 703-605-6000
This report is also available in electronic form at http://ston.jsc.nasa.gov/collections/TRS/
Abstract The space radiation environment, particularly solar particle events (SPEs), poses the risk of acute radiation sickness (ARS) to humans; and organ doses from SPE exposure may reach critical levels during EVAs or within lightly shielded spacecraft. NASA has developed an organ dose projection model using the BRYNTRN with SUMDOSE computer algorithms, and a probabilistic model of Acute Radiation Risk (ARR). BRYNTRN and SUMDOSE are written in FORTRAN, and are a Baryon transport computation and an output formatting program, respectively. The ARR model is written in C. The risk projection models of organ doses and ARR take the output from BRYNTRN as an input to their calculations, but BRYNTRN requires extensive input preparation. With a graphical user interface (GUI) to handle input and output for BRYNTRN, the response models can be connected easily and correctly to BRYNTRN in a user-friendly way. A GUI for the Acute Radiation Risk and BRYNTRN Organ Dose (ARRBOD) projection code provides seamless integration of input and output manipulations, which are required for operations of the ARRBOD modules: BRYNTRN, SUMDOSE, and the ARR probabilistic response model. The ARRBOD GUI is intended for mission planners, radiation shield designers, space operations in the mission operations directorate (MOD), and space biophysics researchers. The ARRBOD GUI will serve as a proof-of-concept example for future integration of other human space applications risk projection models. The current version of the ARRBOD GUI is a new self-contained product and will have follow-on versions, as these options are added: (1) Human geometries of MAX/FAX in addition to CAM/CAF; (2) Shielding distributions for spacecraft, Mars surface and atmosphere; (3) Various space environmental and biophysical models; and (4) Other response models to be connected to the BRYNTRN. The major components of the overall system, the subsystem interconnections, and external interfaces are described in this report; and the ARRBOD GUI product is explained step by step in order to serve as a tutorial.
i
Table of Contents Abstract .......................................................................................................................i 1. Introduction ........................................................................................................... 1 2. Measures of Radiation Exposure, NASA Limits, and Acute Severity Levels............................................................................................................... 2 3. Stimulus and Response Sequences of SPE/Whole Body Exposure ..................... 4 3.1 Input Control Parameters of BRYNTRN.INP ......................................................... 7 3.2 Input Control Parameters of ARR.INP .................................................................... 8 3.3 Overall I/O Sequences for ARR .............................................................................. 9
4. Overview of ARRBOD GUI .............................................................................. 10 4.1 Option for SPE Exposure ....................................................................................... 12 4.1.1 Preparing of BRYNTRN Inputs to Generate the Physical Dose .................... 12 4.1.2 Viewing Options for Physical Quantities from SPE ....................................... 13 4.1.3 Viewing Organ Dose for Male or Female....................................................... 15 4.1.4 Preparing of ARR Inputs ................................................................................ 18 4.2 Option for Whole Body Exposure ......................................................................... 20
5. Illustration of Sample Results for the Protection of Astronauts in Space Missions ......................................................................................................... 23 5.1 Organ Doses from Pre-defined Scenario of SPE Exposure and Implication to Exposure Limits .................................................................................................... 23 5.2 ARS from SPE or Whole Body Exposure ............................................................. 24 5.2.1 ARS from SPE Exposure during EVA ........................................................... 24 5.2.2 ARS from Acute/Protracted Exposure ............................................................ 26
6. Conclusions ......................................................................................................... 29 References ................................................................................................................ 30
ii
Tables Table 1. Table 2. Table 3. Table 4. Table 5. Table 6.
Measures of Exposure. ......................................................................................... 3 Exposure Limit by NASA for Deterministic and Prodromal Effect. ................... 3 ARR Sickness at Severity Level. ......................................................................... 4 Default Variables in Pre-defined Scenario .......................................................... 7 Input Parameters of BRYNTRN.INP .................................................................. 7 Input Parameters of ARR.INP ............................................................................. 8
iii
Figures Figure 1. Flow chart of physical dose calculations using the BRYNTRN and SUMDOSE modules for SPE exposure (path 1). For the whole body exposure (path 2), go directly to the next step for the calculation of ARR. ............................................................................ 5 Figure 2. Flow chart of the ARR module. ......................................................................... 6 Figure 3. Overall input/output sequences of ARR calculations for three types of exposure: ............................................................................................................................. 9 Figure 4. Main task screen or user interface (UI) ............................................................ 11 Figure 5. Input control screen of SPE .............................................................................. 12 Figure 6. Task screen for the selection of physical quantities viewing options, or for the next application flow......................................................................................................... 13 Figure 7. Graph and Output window for physical quantities ........................................... 14 Figure 8. Task UI for the selection of viewing options of organ doses, or for the next application flow. ............................................................................................................... 15 Figure 9. Graph and Output window for physical quantities and organ doses. ............... 16 Figure 10. Graph and Output window of organ dose comparisons to the NASA limits at various thicknesses, which is displayed by clicking “View NASA Organ Dose Limits”. 17 Figure 11. Input control screen of ARR for the selection of gender, EVA time, and spacecraft thickness. ......................................................................................................... 18 Figure 12. Graph and Output window for physical quantities, organ doses, and ARR. The tabulated information of ARR sickness of upper gastrointestinal distress (UG) and fatigability and weakness (FW) are added in this window and viewed by clicking “View ARR Sickness Severity Level Table”. .............................................................................. 19 Figure 13. Input control screen of ARR for the selection of exposure types for acute and protracted doses of radiation. ............................................................................................ 21 Figure 14. Graph and Output window of the ARR for the option of acute/protracted doses of radiation exposure. The tabulated information of ARR sickness of upper gastrointestinal distress (UG) and fatigability and weakness (FW) is viewed by clicking “View ARR Sickness Severity Level Table” in this window. .......................................... 22 Figure 15. A sample result of the organ dose calculation for the pre-defined scenario for male (the same graph as in Figure 10 as the one of the Graph and Output window). ...... 23 Figure 16. Input selection of ARR analysis in the case for a male astronaut who conducts 3 hours of EVA and stays the remainder of 7 hours inside a spacecraft of 5 g/cm2 thickness in the pre-defined scenario of SPE exposure. ................................................... 24 Figure 17. Time profile of BFO dose accumulation of a male astronaut after 3-hr EVA. 25 Figure 18. The resultant sickness levels for UG and FW of a male astronaut after 3-hr EVA. ................................................................................................................................. 25 Figure 19. Acute radiation risk for the acute exposure to a given BFO dose: (a) Upper GI distress (UG); and (b) Fatigability and weakness (FW). .................................................. 27 Figure 20. Acute radiation risk from the uniform exposure to a given BFO dose for a 10hour period: (a) Upper GI distress (UG); and (b) Fatigability and weakness (FW). ........ 28
iv
ACRONYMS ARR ARS ARRBOD BFO BRYNTRN CAF CAM EVA FAX FW GCR GUI GERM Gy Gy-Eq HZE HZETRN ICRP ISS JSC J LEO LET MAX MOD NASCA NCRP NSRL PEL PRA Q RBE SPE SRPE SUMDOSE Sv UG UI
acute radiation risk acute radiation sickness acute radiation risk and BRYNTRN organ dose projection blood forming organ baryon transport computer code computerized anatomical female computerized anatomical male extra vehicular activity female adult voxel (volumetric and pixel) fatigability and weakness galactic cosmic radiation graphical user interface GCR event-based risk model Gray Gray-Equivalent high-charge and -energy nuclei high-charge and -energy transport computer program International Commission on Radiological Protection International Space Station Johnson Space Center Joule low Earth orbit linear energy transfer male adult voxel (volumetric and pixel) mission operations directorate NASA study of cataracts in astronauts National Council on Radiation Protection & Measurements NASA Space Radiation Laboratory permissible exposure limit probabilistic risk assessment radiation quality factor relative biological effectiveness solar particle event Space Radiation Program Element summation of dose Sievert upper gastrointestinal distress user interface
v
1. Introduction The potential for exposure to large solar particle events (SPEs) is a major concern during extra-vehicular activities (EVAs) on the lunar surface and during Earth-to-Lunar or Earth-to-Mars transit. This includes the acute radiation syndrome from exposure to an intense SPE during an EVA or in a lightly shielded vehicle (< 5 g cm-2), as well as the increased risk of radiation induced cancers and degenerative diseases due to the cumulative organ doses from galactic cosmic rays (GCR) and multiple SPEs with intense particle flux and high energy levels (Cucinotta, 1999; Cucinotta et al. 2001; Cucinotta and Durante 2006). Most SPEs would lead to small crew doses, although even a small SPE can disrupt mission operations and lead to higher costs. A real concern for the health risk to astronauts would be from SPEs with large proton fluences and effective doses exceeding 50 mSv. The development of operational strategies and capabilities for the protection of astronauts from SPEs is an important consideration for the planning of future lunar surface scenarios, exploration of near Earth objects, and missions to Mars. In NASA’s operational radiation protection program, career doses are monitored for individual astronauts, who engage in the space shuttle missions and/or the International Space Station (ISS), and best efforts are used to keep the risk as low as reasonably achievable (NCRP, 2000 and 2003). Radiation exposures for astronauts corresponding to a 3% risk of exposure-induced death (NCRP, 2000, 2003, Cucinotta et al., 2006), as well as short-term limits to avoid detrimental effects (NRC/NAS, 2008) are given as dose limits in radiation protection practices for space missions. NASA’s space radiation transport model of organ dose projection, which includes the baryon transport code BRYNTRN (Cucinotta et al., 1994; Wilson et al., 1989) and output data processing code SUMDOSE, has been used to estimate the whole body effective dose for astronauts. The radiation shielding by body tissue at specific organ sites was accounted for by using ray tracing in the human phantom models of the Computerized Anatomical Male (CAM), (Kase et al., 1970; Billings and Yucker, 1973) and the Computerized Anatomical Female (CAF), (Yucker and Huston, 1990; Yucker, 1992). For human exposure, the dose-equivalent is defined by the product of the absorbed dose and the radiation quality factor Q, which compares the biological damage incurred from any ionizing radiation to the damage produced by γ-rays. In general, Q is a function of linear energy transfer (LET). For dose equivalent calculations (in Sv), the quality factors used are those defined by the International Commission on Radiological Protection in 1990 (ICRP 60). The whole body effective dose, E, is defined as a weighted sum of organ dose equivalents over major sites for radiation cancer risks (ICRP, 2007; NCRP, 2000, 2003) using the tissue weighting factors, wT (ICRP, 1991 & 2007). For space missions beyond LEO, the clinically significant deterministic health effects, including performance degradation in-flight, from the exposure to large SPEs must be prevented. For the deterministic acute effects, the National Council for Radiological Protection (NCRP, 2000) has recommended that individual organ doses be made in terms 1
of an alternate dose quantity denoted as the Gray-Equivalent (Gy-Eq), using the relative biological effectiveness (RBE), which is radiation-field dependent. Because biological effects are expected to increase significantly for dose-rates above 0.05 Gy/hr, the current 30-day permissible exposure limits (PELs) have been approved by NASA for skin, eye, and blood forming organ (BFO) as 1.5, 1.0, and 0.25 Gy-Eq (NCRP 2000, 2006), respectively. For the estimation of deterministic acute effects from the intense SPEs during transition between and on the surface of the Moon or Mars missions, the new dosimetric quantity of organ dose (in Gy-Eq), was calculated using BRYNTRN with SUMDOSE by implementing the NCRP’s RBE together with the full definition of neutron RBE suggested by (Wilson et al. 2002). The resultant early radiation risks were assessed for the BFO dose by using a NASA-developed probabilistic model of acute radiation risk (ARR) (Anno et al. 1996; Hu et al. 2009). The purpose of the graphical user interface (GUI) development for ARRBOD is to provide seamless integration of input and output manipulations for the operations of projection modules (BRYNTRN, SUMDOSE, and the ARR probabilistic response model) in assessing the acute risk and the organ doses of significant SPEs. The ARRBOD GUI product will serve as a proof-of-concept for future integration of other risk projection models for human space applications. Future capabilities will include the ability of the user to supply a shield file of detailed geometry and SPE spectral measurement data of the radiation environment. Also, the blood kinetics and the cataract risk projections based on data from NASCA (NASA study of cataracts in astronauts) and NSRL (NASA Space Radiation Laboratory) will be added into the acute risk model. The probabilistic risk assessment (PRA) approach using hazard functions will be added for SPE protection purposes. Eventually, the galactic cosmic ray (GCR) event-based risk model (GERM) (Cucinotta et. al. 2010) will be developed in order to provide stochasticbased estimates for GCR and SPE exposures.
2. Measures of Radiation Exposure, NASA Limits, and Acute Severity Levels Quantities used to describe radiation include the absorbed dose (D), dose equivalent (H), quality factor (Q), linear energy transfer (L), gray equivalent (Gy-Eq), effective dose (E), and relative biological effectiveness (RBE). The absorbed dose is measured in Grays (Gy), energy absorbed per unit mass of material (1 Gy = 1 J per kg). Dose equivalent is measured in Sieverts (Sv), H =DxQ = Q(L) D(L) dL, where Q is the quality factor which represents the relative weighting of different types of radiation to produce stochastic biological effects compared to gamma-rays. Gray equivalent is calculated as Gy-Eq = Σ (RBE)i Di , where RBEi is the relative biological effectiveness factor for deterministic effects produced as a result of exposure to type i particles, and Di is the dose due to type i particles. The effective dose is measured in Sieverts (Sv), E = Σ wT HT , where wT is a weighting factor for tissue or organ type T, and HT is the dose equivalent averaged over tissue type T. Measures of radiation exposure quantity are summarized in Table 1.
2
Table 1. Measures of Exposure.
Point
Physical dose
Dosimetric quantity for deterministic effects (typically acute response)
Absorbed dose (D)
Absorbed dose (D) or 2 Gray-Equivalent (Gy-Eq)
Mean Organ/tissue absorbed dose (DT)
2
Dosimetric quantity for stochastic (probabilistic) effects (typically cancer) 1
Dose equivalent (H)
1
Gray-Equivalent (Gy-Eq)
Organ dose equivalent ( or 2Equivalent dose (HT) 3
Body
)
Effective dose (E)
1
Absorbed dose is weighted by a quality factor that is a function of particle LET. Absorbed dose is weighted by a radiation weighting factor that is a function of particle type. 3 Absorbed dose is also weighted by type of tissue or organ. 2
The possibility of acute risk exists for a BFO dose over 500 mGy-Eq. Dose limits for non-cancer radiation effects at BFOs occur at doses below the threshold for prodromal effects. The current NASA 30-day limits to BFO, lens, and skin for deterministic effects from space radiation and the minimum BFO dose for ARR are given in Table 2. Symptoms of the early radiation effects at each severity level are listed in Table 3 for the NASA-developed probabilistic model of acute radiation risk (Anno et al. 1996; Hu et al. 2009). Table 2. Exposure Limit by NASA for Deterministic and Prodromal Effect. Exposure limit
Organ dose, Gy-Eq
30-day limit to Skin
1.5
30-day limit to Lens
1.0
30-day limit to BFO
0.25
BFO dose limit without ARR
0.5
3
Table 3. ARR Sickness at Severity Level.
Severity
Upper Gastrointestinal Distress (UG)
Fatigability and Weakness (FW)
1
No effect
No effect
2
Upset stomach, clammy and sweaty, mouth waters
Somewhat tired with mild weakness
3
Nauseated, considerable sweating, Tired with moderate swallows frequently to avoid vomiting weakness
4
Vomited once or twice, nauseated, and Very tired and weak may vomit again
5
Vomited several times, including the dry heaves, severely nauseated, and will soon vomit again
Exhausted with almost no strength
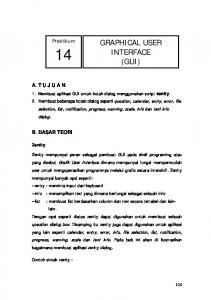
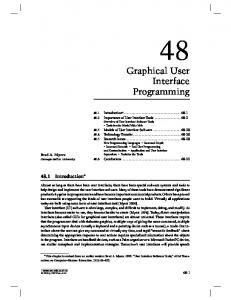
3. Stimulus and Response Sequences of SPE/Whole Body Exposure The sequences of user actions and system responses that stimulate the behavior defined in the GUI feature are illustrated in Figure.1. Shown is a flow chart of the calculation of physical dose from SPE exposure (path 1 in Figure 1) using BRYNTRN and SUMDOSE modules. There are three major control components: Input File Control, BRYNTRN Execution Control, and SUMDOSE Execution Control. For whole body exposure (path 2 in Figure 1), those steps are entirely skipped to calculate directly ARR in the next step. Figure 2 shows the flow chart in the calculation of severity of sickness for upper gastrointestinal distress (UG) and fatigability and weakness (FW) under ARR Execution Control.
4
BRYNTRN Execution Control
Input File Control
SUMDOSE Execution Control Input files: Cafdists_NEW.dat Camdists_HIP.dat
Input file: Atomic.dat
1. Physical dose of SPE? Or 2. ARR?
BRYNTRN.EXE
2
SUMDOSE.EXE
1 Input file
Physics Outputs
Dosimetry Output Organ Dose Outputs
Pop-up inputs: ILOC IDIST ISPEC IMAT
Print, View, or Save
SUMDOSE
Generation of Input control file: BRYNTRN.INP
Print, View, or Save
Y
N
Y
Another BRYNTRN
N
ARR
Figure 1. Flow chart of physical dose calculations using the BRYNTRN and SUMDOSE modules for SPE exposure (path 1). For the whole body exposure (path 2), go directly to the next step for the calculation of ARR.
5
ARR Execution Control
Input: Acute dose, Protracted dose, or Organ dose rate profile
Generation of Input control file: ARR.INP
FW.exe
UGD.exe
Output: Severity of sicknesses
Post-process: View, print or save
Figure 2. Flow chart of the ARR module.
6
3.1 Input Control Parameters of BRYNTRN.INP Input control parameters of BRYNTRN.INP are location, radiation field, fluence distribution of historical SPEs, and shield material. Default values of input variables are listed in Table 4 for the pre-defined scenario. Possible values for the selection of each variable are listed in Table 5. Table 4. Default Variables in Pre-defined Scenario Location
Radiation Field
Interplanetary Space
SPE
Fluence Distribution of Historical SPE Exponential Spectra
Aug 1972 King
Shield Material Aluminum
Table 5. Input Parameters of BRYNTRN.INP Location
Radiation Field
Fluence Distribution of Historical SPEs
Exponential Spectra
Interplanetary Space Or Lunar Surface
SPE
Weibull Spectra
7
Feb 1956 Nov 1960 Aug 1972 King Aug 1989 Sep 1989 Oct 1989 Feb 1956 Nov 1960 Aug 1972 Oct 1989 Jul 2000 Oct 2003 Nov 2001 Nov 2000 Mar 1991 Aug 1989 Sep 1989
Shield Material
Aluminum, Polyethylene, CO2, Water, or Graphite Carbon
3.2 Input Control Parameters of ARR.INP There are 3 exposure types available for the calculation of ARR: (1) Acute dose exposure, (2) Protracted dose exposures of radiation, and (3) SPE exposure during EVA. Input control parameters for ARR.INP are: total BFO dose in acute dose exposure; total BFO dose and exposure time in protracted dose exposure; and EVA duration, gender of astronaut, and choice of spacecraft thickness with organ doses calculated from the selected SPE exposure. Table 6 summarizes the input control parameters of ARR for the 3 exposure types and the ranges of variables. Table 6. Input Parameters of ARR.INP ARR Application Directly due to the Exposure from Acute/Protracted Dose Defined by User (1) Acute Exposure
(2) Protracted Exposure
ARR Application with BRYNTRN+SUMDOSE due to the Exposure from a Historically Large SPE (3) SPE Exposure
Male or Female: Protracted dose in Gy-eq: Gender-specific total BFO [0.47* - 28.17] dose inside spacesuit from the selected SPE exposure to be used. EVA time in hr: Acute dose in Gy-eq: [0.0 – 10.0] [0.47* - 28.17] Shielding thickness: Exposure time in hr: [0.3, 1, 5, 10, 15, 20, or 30 g/cm2] [0.1 – 168.0] Gender-specific BFO dose inside spacecraft at specified shielding thickness from the selected SPE exposure to be used. *No acute radiation risk if total BFO dose < 0.47 Gy-Eq.
8
3.3 Overall I/O Sequences for ARR Overall input/output sequences of ARR calculations are illustrated in Figure 3 for the three exposure types. Start y
ARR directly?
BRYNTRN+SUMDOSE 3) SPE exposure
n
Exposure type 1) Acute dose
BFOMale(x) from SUMDOSE_CAM.dat BFOFemale(x) from SUMDOSE_CAF.dat
2) Protracted dose
Total BFO dose in Gy-Eq?
SPE Organ dose
Total BFO dose in Gy-Eq? Exposure time, hr? Male
ARR y
Gender
BFOMale(EVA)
BFOFemale(EVA)
EVA duration in hr?
n
More ARR
Pull down menu for Spacecraft: BFOcraft= BFOMale(x)
directly
ARR directly or Organ dose
Female
EVA duration in hr? Pull down menu for Spacecraft: BFOcraft= BFOFemale(x)
organ dose y
Go to Main
n
End
Figure 3. Overall input/output sequences of ARR calculations for three types of exposure: 1) Acute dose; 2) Protracted dose; and 3) SPE exposure during EVA.
9
4. Overview of ARRBOD GUI As an application of ARRBOD GUI starts, it launches the banner below for a brief time period. It says that ARRBOD v 1.0 is developed at the NASA Johnson Space Center, Space Radiation Program Element (SRPE), in 2009.
10
The next screen is the main task screen or user interface (UI) of the ARRBOD application flow (Figure 4). From this main task UI, the user has two options for the selection of either: (1) Evaluation of physics and organ doses from historically large SPEs; or (2) Do the acute risk analysis directly.
Figure 4. Main task screen or user interface (UI)
11
4.1 Option for SPE Exposure 4.1.1 Preparing of BRYNTRN Inputs to Generate the Physical Dose For the selection of the first option on the main task screen for the evaluation of physics and organ doses from historically large SPEs, the following input control screen of SPE (Figure 5) appears. On this screen, the user can make either the selection of the default scenario of the August 1972 SPE (Table 4) or the manual selection for the input parameters listed in Table 5 to generate the BRYNTRN.INP file. By clicking “Physics Dose”, the BRYNTRN code is executed with the input variables selected by the user.
Figure 5. Input control screen of SPE
12
4.1.2 Viewing Options for Physical Quantities from SPE Physical quantities generated from the execution of BRYNTRN code can be viewed for (1) Physical dosimetry (D, G, H), or (2) LET spectra, by selecting the viewing option from the task screen in Figure 6.
Figure 6. Task screen for the selection of physical quantities viewing options, or for the next application flow.
13
In the selection of viewing option “Physical Dosimetry” (Figure 7), outputs of absorbed dose of physical dose (D), Gray-equivalent adjusted for acute risk (G), and doseequivalent adjusted for long-term risk (H) are viewed as a function of tissue thickness at a given shielding thickness (x = 0.3, 1, 5, 10, 15, 20 or 30 g/cm2). In the “View Data” window, those output data are tabulated also in text format. Linear energy transfer (LET) spectra at various shielding thicknesses can be viewed by clicking the corresponding tab “LET Spectra” in the same output window (in Figure 7) or by clicking “Show Tasks” to go back to the previous task screen (Figure 6), and then selecting the viewing option for LET in that task screen. In the current viewing option of “LET Spectra”, data of LET spectra are viewed by clicking “View Data” and saving them as a text file. The graph can be printed directly and also can be saved separately in a working directory. The ARRBOD application for SPE is continued by clicking “Show Tasks” to go back to the task screen (Figure 6) and then clicking “Generate Organ Dose” in the task screen for the next application flow of step three.
Figure 7. Graph and Output window for physical quantities
14
4.1.3 Viewing Organ Dose for Male or Female Organ dose quantities for male or female can be viewed by selecting organ dose output for male or female in the SUMDOSE task screen in Figure 8.
Figure 8. Task UI for the selection of viewing options of organ doses, or for the next application flow.
15
Organ doses at various organ/tissue sites, whole body effective dose, and point dose without body shielding are viewed in terms of absorbed dose (D), Gray-equivalent dose (G), and dose-equivalent (H) at a given shielding thickness. The result data are viewed and saved as text files for male or female. The graph can be printed directly and also saved in a separate working directory.
Figure 9. Graph and Output window for physical quantities and organ doses.
16
In the graph and output window for physical quantities and organ doses, an added feature is “View NASA Organ Dose Limits”. By clicking it, the organ doses of male or female for skin, eye, and blood forming organ (BFO) at each shielding thickness are easily compared to the color-coded parallel lines, which are NASA exposure limits for deterministic and prodromal effects (Table 2), as shown in Figure 10.
Figure 10. Graph and Output window of organ dose comparisons to the NASA limits at various thicknesses, which is displayed by clicking “View NASA Organ Dose Limits”.
The ARRBOD application for SPE is performed by clicking “Show Tasks” and then clicking “Start Acute Radiation Risk” in the task screen (Figure 8), the next application in the flow of step four.
17
4.1.4 Preparing of ARR Inputs Using the SPE exposure calculated from the previous three steps, gender-specific total BFO dose inside the spacesuit is assigned automatically to “BFO EVA dose” for the calculation of ARR, once the astronaut’s gender is specified by the user. Additional input variables required are: (1) EVA duration, which ranges from 0 to 10 hours; and (2) The selection of a spacecraft shielding thickness to be used as a shelter against the SPE exposure during EVA far from the surface habitat. By the selection of a spacecraft thickness, gender-specific BFO dose inside a spacecraft of specified thickness is assigned for the calculation of ARR. BFO dose rates during the EVA and inside the spacecraft are assumed to be those at the peak fluence of the SPE for the 10-hour duration.
Figure 11. Input control screen of ARR for the selection of gender, EVA time, and spacecraft thickness.
18
By clicking “Generate Acute Radiation Risk” in the input control UI of ARR (Figure 11), two outputs: “Exposure Summary” and “Acute Radiation Risk” are generated and added into the Graphs and Output window. The ARR results are represented as severity levels ranging from 1 to 5 for upper gastrointestinal distress (UG) and fatigability and weakness (FW), which are tabulated and added into the Graphs and Output window as “View ARR Sickness Severity Level Table”.
Figure 12. Graph and Output window for physical quantities, organ doses, and ARR. The tabulated information of ARR sickness of upper gastrointestinal distress (UG) and fatigability and weakness (FW) are added in this window and viewed by clicking “View ARR Sickness Severity Level Table”.
Once all the results have been viewed in each step of the application flow after the execution of each module of BRYNTRN, SUMDOSE, and ARR, they are accumulated in the Graphs and Output window to be viewed/printed/saved at the end of the ARRBOD application flow. These result tabs are “LET Spectra” and “Physical Dosimetry” from the BRYNTRN module; “NASA Organ Dose Limits” and “Organ Dose” from the SUMDOSE module; “Exposure Summary” and “Acute Radiation Risk” from the ARR module; and “View ARR Sickness Severity Level Table” for the symptoms of quantified ARR severity level. By clicking “Show Tasks”, the ARRBOD application for SPE can be continued by returning to the previous flow, or the entire application can be started over.
19
4.2 Option for Whole Body Exposure The second option of the ARRBOD application is the direct analysis of ARR. This option determines the calculation of ARR from the user-defined radiation dose. It is selected by clicking “Run Acute Radiation analysis directly” in the main task screen of the ARRBOD application in Figure 4. In the input control screen of ARR, there are two options of whole body exposure type: acute and protracted doses of radiation (Figure 13). Total BFO doses from 0.47 to 28.17 Gy-Eq are considered for the analysis of ARR for both acute and protracted exposure types. For the protracted dose exposure, possible exposure times can be inputted from 0.1 to 168 hours. However, dose rates ( ) of protracted exposure should be less than 5 Gy-Eq/hr from any combination of total dose (Dtotal) and exposure time (texposure). 5
/
.
In the case that the dose rate exceeds 5 Gy-Eq/hr from the combination of total dose and exposure time, the ARRBOD application results in an error with the dummy outputs. Inclusion of the correct error message is planned. By definition, acute exposure is quite representative for these high dose rates, and the user is advised to select “Use Acute Dose” from the input control screen (Figure 13) to get the appropriate ARR analysis for the given total BFO dose.
20
Figure 13. Input control screen of ARR for the selection of exposure types for acute and protracted doses of radiation.
After execution of the ARR module, two outputs, “Exposure Summary” and “Acute Radiation Risk”, are displayed in the Graphs and Output window. ARR results are represented as severity levels ranging from 1 to 5 for upper gastrointestinal distress (UG) and fatigability and weakness (FW). The symptoms at each severity level are tabulated in the “View ARR Sickness Severity Level Table” and added into the Graphs and Output window. By clicking “View ARR Sickness Severity Level Table”, the table is viewed as in Figure 14.
21
Figure 14. Graph and Output window of the ARR for the option of acute/protracted doses of radiation exposure. The tabulated information of ARR sickness of upper gastrointestinal distress (UG) and fatigability and weakness (FW) is viewed by clicking “View ARR Sickness Severity Level Table” in this window.
The ARR analysis of radiation exposure is continued by clicking “Execute ARR Directly” for acute and protracted dose exposures, or the entire application of ARRBOD can be started over by clicking “Show Tasks” to go back to the input control screen of ARR (Figure 13) and then clicking “Start Over”.
22
5. Illustration of Sample Results for the Protection of Astronauts in Space Missions 5.1 Organ Doses from Pre-defined Scenario of SPE Exposure and Implication to Exposure Limits In the pre-defined scenario of SPE exposure in the ARRBOD application, it is assumed that a crew member is located inside an aluminum spacecraft in interplanetary space and exposed to an August 1972-type SPE, characterized by the exponential distribution of the 1972 King spectrum. The current NASA 30-day permissible exposure limits (PELs) are 1.5, 1.0, and 0.25 GyEq (NCRP 2000, 2006) for skin, lens of the eye, and BFO, respectively. The threshold for prodromal effects is 0.5 Gy-Eq, because the possibility of acute risk exists for BFO dose over this level (Hu et al., 2009). Future research is needed to understand if microgravity effects modify this threshold value. The results for males in this scenario are shown in Figure 15. The resultant organ dose assessments are compared with the current NASA 30-day dose limits and the threshold for acute radiation sickness (ARS). From this figure, sufficient shielding can be determined to avoid ARS, and to stay within the NASA short-term limits. For example, a male crew member, located inside a spacecraft with 5 g/cm2 aluminum shielding during interplanetary transit, may not experience any ARS, because the BFO dose is determined to be lower than the 0.5 Gy-Eq threshold. However, organ dose assessments of skin, lens of the eye, and BFO exceed the current NASA 30-day dose limits of these organs. Therefore, more than 5 g/cm2 of aluminum shielding are required during interplanetary transit to protect astronauts against a large August 1972-type SPE.
Figure 15. A sample result of the organ dose calculation for the pre-defined scenario for male (the same graph as in Figure 10 as the one of the Graph and Output window).
23
5.2 ARS from SPE or Whole Body Exposure 5.2.1 ARS from SPE Exposure during EVA In the case of a male astronaut conducting 3 hours of EVA and then sheltering inside a 5 g/cm2 aluminum spacecraft for 7 hours in this pre-defined scenario of SPE exposure, the input selection of the ARS analysis is shown in Figure 16. It is assumed that the EVA occurs at the peak hours of the SPE, and that the total peak duration is 10 hours.
Figure 16. Input selection of ARR analysis in the case for a male astronaut who conducts 3 hours of EVA and stays the remainder of 7 hours inside a spacecraft of 5 g/cm2 thickness in the pre-defined scenario of SPE exposure.
A male astronaut’s time profile of BFO dose accumulation is shown in Figure 17, which also provides an exposure summary. It shows that a total BFO dose of 74.03 cGy-Eq is accumulated at the end of the SPE, which is 10 hours after the initial exposure.
24
Figure 17. Time profile of BFO dose accumulation of a male astronaut after 3-hr EVA.
The resultant sickness levels for UG and FW are shown in Figure 18 as acute radiation risk level. It shows that a male astronaut may not have any symptoms during the 3-hour EVA, however the initial ARR symptoms appear after he finds shelter. These symptoms include upset stomach, clammy and sweaty skin, and mouth watering (level 2 of UG distress). Long-lasting symptoms endure: tiredness and mild weakness (sub-level 2 of FW).
Figure 18. The resultant sickness levels for UG and FW of a male astronaut after 3-hr EVA.
25
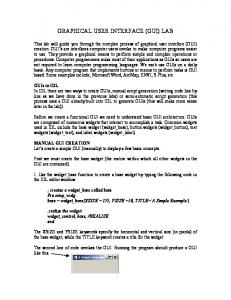
5.2.2 ARS from Acute/Protracted Exposure The input selection for ARS analysis from acute exposure is shown in Figure 13. For acute dose exposure, the user-supplied total BFO dose ranges from 0.47 to 28.17 Gy-Eq. The output results of the acute doses are summarized in Figure 19a for UG and Figure 19b for FW, respectively. In these figures, the BFO dose ranges are 0.5 - 1.0 Gy-Eq with increments of 0.1 Gy-Eq and 1.0 – 3.0 Gy-Eq with an increment of 0.5 Gy-Eq. As the acute BFO dose increases to 3 Gy-Eq, the possible symptoms for UG level 5 include vomiting several times, having dry heaves, severe nausea, and vomiting again shortly after 7 hours following the exposure. Long-lasting symptoms of FW from the acute exposure dose of 3 Gy-Eq are at the levels between 2 and 4, which include being somewhat tired with mild weakness, to being tired with moderate weakness, and to being very tired and weak. In the protracted exposure for 10 hours of time, the results for the same doses as those of acute exposure are summarized in Figure 20a for UG and Figure 20b for FW, respectively. In this uniform exposure of 10 hour duration, dose rates vary between 0.05 – 0.1 Gy-Eq/hr with increments of 0.01 Gy-Eq/hr, and 0.1 – 0.3 Gy-Eq/hr with increments of 0.05 Gy-Eq/hr. Maximum severities of UG and FW for 10-hour uniform exposures are similar to those of acute exposures. The delayed response is shown to be significantly shorter for the 10 hour uniform exposure, when the time profiles are compared.
26
(a) 5
4
BFO dose 3.0 Gy-Eq
UG severity
2.5 Gy-Eq 2.0 Gy-Eq 1.5 Gy-Eq
3
1.0 Gy-Eq 0.9 Gy-Eq 0.8 Gy-Eq 0.7 Gy-Eq 2
0.6 Gy-Eq 0.5 Gy-Eq
1 0.1
1
10
100
1000
Time, h
(b) 5
4
BFO dose 3.0 Gy-Eq
FW severity
2.5 Gy-Eq 2.0 Gy-Eq 1.5 Gy-Eq
3
1.0 Gy-Eq 0.9 Gy-Eq 0.8 Gy-Eq 0.7 Gy-Eq 2
0.6 Gy-Eq 0.5 Gy-Eq
1 0.1
1
10
100
1000
Time, h
Figure 19. Acute radiation risk for the acute exposure to a given BFO dose: (a) Upper GI distress (UG); and (b) Fatigability and weakness (FW).
27
(a) 5
4
BFO dose 3.0 Gy-Eq
UG severity
2.5 Gy-Eq 2.0 Gy-Eq 1.5 Gy-Eq
3
1.0 Gy-Eq 0.9 Gy-Eq 0.8 Gy-Eq 0.7 Gy-Eq 2
0.6 Gy-Eq 0.5 Gy-Eq
1 0.1
1
10
100
1000
Time, h
(b) 5
4
BFO dose 3.0 Gy-Eq
FW severity
2.5 Gy-Eq 2.0 Gy-Eq 1.5 Gy-Eq
3
1.0 Gy-Eq 0.9 Gy-Eq 0.8 Gy-Eq 0.7 Gy-Eq 2
0.6 Gy-Eq 0.5 Gy-Eq
1 0.1
1
10
100
1000
Time, h
Figure 20. Acute radiation risk from the uniform exposure to a given BFO dose for a 10- hour period: (a) Upper GI distress (UG); and (b) Fatigability and weakness (FW).
28
6. Conclusions The assessment of astronauts’ radiation risk from SPE is an important goal in support of mission design and operational planning to manage radiation risks in future space missions. The first version of the ARRBOD GUI is developed for the purpose of NASA trade studies of mission scenarios, including studies of shielding materials, masses and topologies from exposure to historically recorded large SPEs. In the current ARRBOD version, proper shielding solutions can be identified from the gender-specific organ dose assessments to avoid ARR symptoms, and to stay within the current NASA short-term dose limits. Furthermore, the quantified evaluation of ARR severities based on any given shielding configuration and a specified EVA or other mission scenario can be made to guide alternative solutions for attaining determined objectives set by mission planners.
29
References Anno, G.H., McClellan, G.E., Dore, M.A. Protracted radiation-induced performance decrement. Alexandria, VA: Defense Nuclear Agency; DNA-TR-95-117, Vol 1;1996. Billings, M.P., Yucker, W.R. The computerized Anatomical Man (CAM) Model, NASA CR-134043, 1973. Cucinotta, F.A., Wilson, J.W., Badavi, F. F. Extension to the BRYNTRN code to monoenergetic light ion beams. Washington DC, NASA Report No. TP-3472, 1994. Cucinotta, F.A. Issues in risk assessment from solar particle events. Radiation Measurements. 30, 261-268, 1999. Cucinotta, F.A., Schimmerling, W., Wilson, J.W., Peterson, L.E., Saganti, P., Badhwar, G.D., Dicello, J.F., Space Radiation Cancer Risks and Uncertainties for Mars Missions. Radiation Research, 156, 682-688, 2001. Cucinotta, F.A., Kim, M.Y., and Ren, L., Evaluating Shielding Effectiveness for Reducing Space Radiation Cancer Risks. Radiation Measurements. 41,1173-1185, 2006. Cucinotta, F.A., Durante, M. Cancer risk from exposure to galactic cosmic rays: implications for space exploration by human beings. The Lancet Oncology, 7, 431-435, 2006. Cucinotta, F.A., Hu, S., Schwadron, N.A., Kozarev K., Townsend, L.W., and Kim, M.Y., Space Radiation Risk Limits and Earth-Moon-Mars Environmental Models. Space Weather Journal (Submitted), 2010. Hu, S., Kim, M.Y., McClellan, G.E., and Cucinotta, F.A., Modeling the Acute Health Effects of Astronauts from Exposure to Large Solar Particle Events, Health Physics Journal, 96(4), 465-476, April 2009. ICRP, 1990 Recommendations of the International Commission on Radiological Protection. ICRP Publ. 60, Pergamon Press Inc., 1991. ICRP Publication 103: The 2007 Recommendations of the International Commission on Radiological Protection, Annals of the ICRP, vol. 37/2-4, 2007. Kase, P. G. Computerized anatomical model man. Technical Report, AD-868927, MCR69-409, AFWL-TR-69-161, Contract F29601-69-C-0052. Martin Marietta Corp., Denver, CO, 1970. NCRP, Radiation Protection Guidance for Activities in Low-Earth Orbit. Report No. 132, National Council on Radiation Protection and Measurements, Bethesda, MD, 2000. NCRP, Operational Radiation Safety Program for Astronauts in Low-Earth Orbit: A Basic Framework. Report No. 142, National Council on Radiation Protection and Measurements, Bethesda, MD, 2003. National Council on Radiation Protection and Measurements, Information needed to make radiation protection recommendations for space missions beyond LowEarth Orbit. NCRP Report No. 153, Bethesda MD, 2006. NRC/NAS, National Research Council/National Academy of Sciences, Committee on the Evaluation of Radiation Shielding for Space Exploration. Managing Space 30
Radiation Risk in the New Era of Space Exploration, the National Academies Press, 2008. Wilson, J.W., Townsend, L.W., Nealy, J.E., Chun, S.Y., Hong, B.S., Buck, W.W., Lamkin, S.L., Ganapole, B.D., Kahn, F., Cucinotta, F.A., BRYNTRN: A Baryon transport model. Washington DC, NASA Report No. TP-2887, 1989. Wilson JW, Kim MY, De Angelis G, Cucinotta FA, Yoshizawa N, and Badavi FF. Implementation of Gy-Eq for deterministic effects limitation in shield design. Journal of Radiation Research., 43:S103-S106; 2002. Yucker, W.R., and S.L. Huston, “Computerized Anatomical Female. Final Report,” Report MDC H 6107, McDonnell Douglas Corporation, Huntington Beach, CA, September 1990. Yucker, W.R., “Computerized Anatomical Female Body Self-Shielding Distributions,” Report MDC 92H0749, McDonnell Douglas Corporation, Huntington Beach, CA, March 1992.
31
Form Approved OMB No. 0704-0188
REPORT DOCUMENTATION PAGE
Public reporting burden for this collection of information is estimated to average 1 hour per response, including the time for reviewing instructions, searching existing data sources, gathering and maintaining the data needed, and completing and reviewing the collection of information. Send comments regarding this burden estimate or any other aspect of this collection of information, including suggestions for reducing this burden, to Washington Headquarters Services, Directorate for Information Operations and Reports, 1215 Jefferson Davis Highway, Suite 1204, Arlington, VA 22202-4302, and to the Office of Management and Budget, Paperwork Reduction Project (0704-0188), Washington, DC 20503.
1. AGENCY USE ONLY (Leave Blank)
2. REPORT DATE
February 2010
3. REPORT TYPE AND DATES COVERED
NASA Technical Paper
4. TITLE AND SUBTITLE
Development of Graphical User Interface for ARRBOD (Accute Radiation Risk and BRYNTRN Organ Dose Projection
5. FUNDING NUMBERS
6. AUTHOR(S)
Myung-Hee Y. Kim, Shaowen Hu, Hatem N. Nounu, Francis A. Cucinotta
7. PERFORMING ORGANIZATION NAME(S) AND ADDRESS(ES)
8. PERFORMING ORGANIZATION REPORT NUMBERS
Lyndon B. Johnson Space Center Houston, Texas 77058
S-1061
9. SPONSORING/MONITORING AGENCY NAME(S) AND ADDRESS(ES)
10. SPONSORING/MONITORING AGENCY REPORT NUMBER
National Aeronautics and Space Administration Washington, DC 20546-0001
TP-2009-216116
11. SUPPLEMENTARY NOTES
NASA Johnson Space Center
12a. DISTRIBUTION/AVAILABILITY STATEMENT
12b. DISTRIBUTION CODE
Available from the NASA Center for AeroSpace Information (CASI) 7115 Standard Hanover, MD 21076-1320 Category: 52 13. ABSTRACT (Maximum 200 words)
The space radiation environment, particularly solar particle events (SPEs), poses the risk of acute radiation sickness (ARS) to humans; and organ doses from SPE exposure may reach critical levels during EVAs or within lightly shielded spacecraft. NASA has developed an organ dose projection model using the BRYNTRN with SUMDOSE computer algorithms, and a probabilistic model of Acute Radiation Risk (ARR). The risk projection models of organ doses and ARR take the output from BRYNTRN as an input to their calculations, but BRYNTRN requires extensive input preparation. With a graphical user interface (GUI) to handle input and output for BRYNTRN, the response models can be connected easily and correctly to BRYNTRN in a user-friendly way. A GUI for the Acute Radiation Risk and BRYNTRN Organ Dose (ARRBOD) projection code provides seamless integration of input and output manipulations, which are required for operations of the ARRBOD modules. The ARRBOD GUI is intended for mission planners, radiation shield designers, space operations in the mission operations directorate (MOD), and space biophysics researchers. The ARRBOD GUI will serve as a proof-of-concept example for future integration of other human space applications risk projection models. This version of the ARRBOD GUI is a new self-contained product and will have follow-on versions The major components of the overall system, the subsystem interconnections, and external interfaces are described in this report; and the ARRBOD GUI product is explained step by step in order to serve as a tutorial. 14. SUBJECT TERMS
15. NUMBER OF PAGES
ARRBOD, Radiation, Acute Radiation Risk, BRYNTRN, SUMDOSE, organ dose, SPE 17. SECURITY CLASSIFICATION OF REPORT
18. SECURITY CLASSIFICATION OF THIS PAGE
Unclassified
Unclassified
Standard Form 298 (Rev Feb 89) (MS Word Mar 97) Prescribed by ANSI Std. 239-18 298-102
19. SECURITY CLASSIFICATION OF ABSTRACT
Unclassified NSN 7540-01-280-5500
16. PRICE CODE
44 20. LIMITATION OF ABSTRACT
Unlimited