Advances in Science, Technology and Engineering Systems Journal Vol. 3, No. 1, 148-154 (2018)
ASTESJ
www.astesj.com
ISSN: 2415-6698
Special issue on Advancement in Engineering Technology
Development of Indicators for Technical Condition Indexing of Power Transformers Gints Poiss*, Sandra Vitolina, Janis Marks Riga Technical University, Department of Electrical Machines and Devices, Latvia ARTICLE INFO Article history: Received: 15 November, 2017 Accepted: 08 January, 2018 Online: 30 January, 2018 Keywords : Power transformer Condition indexing Fuzzy logic Transformer windings Oil insulation
1.
ABSTRACT Reliable operation of a power transformer with a certain load depends on the technical condition of individual construction parts and the ability to prevent defects that can cause a failure. During the lifecycle of a transformer, valuable data is constantly accumulated, which forms the basis for technical or risk assessment of the equipment. Therefore it also serves as a ground for the decisions on further operation, or repairs, or replacement. To achieve this goal, data need to be systematized. Since technical condition indexing allows combining various types of data including results of diagnostic tests is used within the framework of this research. As part of a larger risk assessment methodology, algorithms for two indicators are proposed in this paper, and they are based on results of electrical measurements and analysis of oil parameters, respectively. The novelty of the algorithms for indicators introduced in this paper is based on analysis of features specific to the power system in Latvia such as large proportion of aged transformers, low loading level, significant variation in oil volumes, and statistics on typical faults. Proposed limits of parameters are verified with data from operation history. Taking into account the differences in the measurement periodicity, the indicator that is based on electrical measurements assesses the individual constructive parts of the transformer (windings and core, bushing and onload tap changer) separately, whereas the other, indicator combines the results of oil parameters into a single assessment. These indicators were verified by using 30 transformers from the Latvian power system and the obtained results coincide well with the operation history.
Introduction
This paper is an extension of the results disseminated in the international conference paper relating to the development of risk indicator for power transformers based on electrical measurements [1]. This risk indicator is part of a condition indexing algorithm that allows categorizing a large volume of technical data obtained during operation and maintenance of a power transformer into discrete risk categories. It provides information in a fast and systematic way, so that transformers can be easily compared and critical ones can be selected for further investigation. The main goal of this extended paper is to present an algorithm for determining the numerical value of the indicator based on results of electrical measurements (EM indicator), as well as for establishing the numerical value of the indicator based on results of oil parameters analysiss. The outcome for both indicators is the risk category derived on a scale from 1 (lowest risk) to 5 (highest risk, outage expected or immediate action necessary). The *
Corresponding Author: Gints Poiss, Email:
[email protected]
www.astesj.com
proposed indicators correspond to diagnostic tests regularly performed on power transformers in Latvian transmission system. However, significant differences in the periodicity of oil checks and electrical measurements determined the disparate structure of both algorithms and the mathematical methods selected. The proposed indicators have been verified with 30 case studies. Results of diagnostic tests both from transformers that required repairing, and transformers in a normal operation condition were used. The authors express their gratitude to the Latvian Transmission System Operator (Augstsprieguma tikls, JSC) for providing data for the case studies. Different approaches are applied to develop appropriate and efficient algorithms for technical condition index which includes such common power transformer parameters as oil characteristics, dissolved gas analysis and electrical measurements [2]. Artificial neural networks (ANN) and adaptive neuro-fuzzy inference system (ANFIS) models, for instance, are no longer limited just for diagnosing faults and aging of power transformers. 148
G. Poiss et al. / Advances in Science, Technology and Engineering Systems Journal Vol. 3, No. 1, 148-154 (2018) These models can also be used to quantify the general condition of a power transformer [3], also as synthetic risk assessment methods [4] and fuzzy logic [5]. The different diagnostic tools and methods, periodicity and power system charchteristics are actually driving the need to develop a unique, expert-made assessment models for a certain power system. The novelty of the algorithms for indicators introduced in this paper is based on analysis of features specific to the power system in Latvia such as large proportion of aged transformers, low loading level, significant variation in oil volumes, and statistics on typical faults. Proposed limits of parameters are verified with data from operation history. The algorithms provide evaluation of the main constructive parts of a power transformer, and also the structure of indicator algorithms is planned as adjustable, if the amount of applied diagnostics tests is changed. 2.
The indicator based on electrical measurements for technical condition indexing of a power transformer is developed by evaluating separately 3 main parts of a power transformer: windings, bushings and OLTC. A failure of any of these parts may be critical for a power transformer, the surrounding equipment, environment and even service personnel. The indicator based on analysis of oil parameters such as flash point, dissipation factor, acidity and moisture content is developed as a combined approach of binary and fuzzy logic which allows evaluating the risk on basis of several oil parameters as a single entity. Both indicators are described in detail in the following chapters of this article. Table 1. Indicators for technical condition indexing Electrical measurements
Technical Condition Index as a Part of Risk Matrix
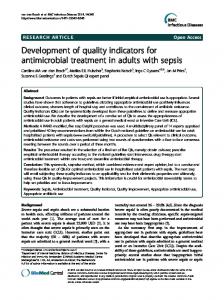
Configurations of the risk matrix proposed for Latvian power system within the framework of this research is shown in Figure 1, and can be effectively used to evaluate each power transformer in the system, as well as to plan the maintenance or replacement of aged units. Risk matrix is divided into 3 parts, where green indicates a low-risk with no concern, blue indicates a moderate risk region or a transformer in a normal operation and technical condition, whereas the red region indicates a need for immediate action. The greatest attention will be paid to 4 cases depicted in Figure 1, that fall in the high-risk region. In Figure 1, the ordinate axis of the risk matrix, shows operation characteristics and it is based on such important parameters as transformer age, load, maintenance history, the existence of monitoring system, importance in the system (as additional option). Three indicators are used to determine the technical condition index. Together with scoring and weighting factors it is depicted as a value on abscise axis of the risk matrix. Parameters used to determine the technical condition index are given in Table 1 and they correspond to diagnostic tests regularly performed on power transformers in Latvian transmission system. The algorithm of the indicator based on dissolved gas analysis (DGA) is provided in [6]. It is based on assessment of 7 key gases shown in Table 1 and includes analysis of features specific to the power system in Latvia where power transformers are aged and variations in oil volumes are significant. Transformer loading, operation of the on-load tap changer (OLTC), and oil treatment are also taken into account in order to quantify this indicator.
Windings and core
Bushings
OLTC
Power factor, PF
Power factor, PF
Static resistance, SR
Insulation resistance, Rm
Insulation resistance, Rm
Short-circuit impedance, Zk
Capacitance, C1
Transition time & current ripple from dynamic resistance measurement (DRM)
No-load losses, P0 Transformer oil
3.
Oil analysis
DGA
Dissipation factor
H2, CH2
Flash point
C2H4 C2H6
Moisture content
C2H2
Acidity
CO, CO2
Development of Electrical Measurement Indicator
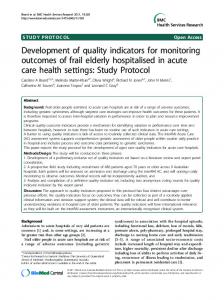
3.1. Winding and core Power factor, insulation resistance and short-circuit impedance allow verifying the technical condition of transformer windings, whereas variations in no-load losses reflect the condition of a transformer core. A flowchart of a multi-step algorithm is shown in Figure 2. where scoring system for windings and core as a part of the EM indicator is derived on a scale from T=1 (lowest risk) to T=5 (highest risk, outage expected). The first step is input of measured parameter values from test reports: insulation resistance (Rm), power factor (PF), short-circuit impedance (Zk), no-load losses (P0), and winding temperature readings from a thermometer on a transformer.
Figure 1. Proposed configuration of risk matrix
www.astesj.com
Next step is data processing. As a reference point, it requires data from the factory test report for a particular power transformer, as well as background information such as age, rated voltage, etc. This information is stored in a specific technical file that is prepared for each transformer in the system. This file is also used for other condition indexing indicators. Since the technical file contains limits for the evaluation of parameters shown in Table 2, modifications are restricted. 149
G. Poiss et al. / Advances in Science, Technology and Engineering Systems Journal Vol. 3, No. 1, 148-154 (2018) During data processing the input data are modified into a suitable form for further analysis. PF values from the test report are calculated at base temperature of 20 ̊C. Thus the limits proposed in Table 2 and stored in the technical file can be applied for risk evaluation (E1 indicates low risk, and E5 – high risk). PF limits are based on recommendations provided in the standard IEEE C57.152-2013. On basis of maintenance experience, additionally value for level E5 were specified. PF=1.5% at 20 ̊C is an effective parameter for detecting high risk since moisture and contamination of windings in this case in practice proved to be too high for reliable operation. Another parameter used for high risk detection is the Dt coefficient. It is a ratio between the measured resistance and rated voltage of high voltage winding (Rm/Un). Coefficient Dt=1M/kV at base temperature of 20 C ̊ is set as the minimum insulation resistance limit [7]. For further analysis, values from the factory test report Rfact adjusted to base temperature are used as reference to evaluate if the decrease of measured Rm is acceptable.
If the measured PF value is above the limit E5 as it shown in Table 2 or the rated capacitance C1 of a bushing differs from factory measurement by more than 10 %, to reduce the risk of failure, it is advisable to remove the bushing from service [10]. Input Data processing Windings and core
DtE4
(Rm E3) or P0 ph-ph>E3
T=3
Yes
0.85*Rfact≤ RmE4
Therefore within the framework of this research fuzzy logic as data processing method is used to develop a technical condition indicator for a power transformer based on measurement results of oil parameters. Four independent oil parameters (flash point, dissipation factor, acidity and moisture content) and additional parameter (changes in flash point value in two subsequent measurements) are used as input data as shown in Figure 5. Limits shown in Table 3 are based on typical values observed for transformers installed in transmission network in Latvia. As a result, algorithm calculates the value of transformer oil indicator within limits from K=1 – (low risk) to K=5 (high risk, immediate actions required). Flash point (FP) is the lowest temperature at which oil in certain conditions releases such amount of vapour that, together with air, creates a flammable mixture leading to fire hazard. Therefore, this parameter is proposed for indicating high risk. Based on practical experience in decision-making for transformer repairs dissipation factor (tanδ) is proposed as another parameter indicating high risk since it is sensitive to oil aging, moisture, as well as changes in contamination levels.
No
Table 3. Proposed Limits for Oil Parameters SRph-ph