Hindawi Publishing Corporation Mathematical Problems in Engineering Volume 2016, Article ID 4260397, 12 pages http://dx.doi.org/10.1155/2016/4260397
Research Article Development of Liquid Capacity Measuring Algorithm Based on Data Integration from Multiple Sensors Kiwoong Park, Si-Kyoung Lee, and Hyeon Cheol Kim School of Electrical Engineering, University of Ulsan, Ulsan 44610, Republic of Korea Correspondence should be addressed to Hyeon Cheol Kim;
[email protected] Received 15 March 2016; Revised 7 June 2016; Accepted 19 June 2016 Academic Editor: Jean-Pierre Corriou Copyright © 2016 Kiwoong Park et al. This is an open access article distributed under the Creative Commons Attribution License, which permits unrestricted use, distribution, and reproduction in any medium, provided the original work is properly cited. This research proposes an algorithm using a process of integrating data from multiple sensors to measure the liquid capacity in real time regardless of the position of the liquid tank. The algorithm for measuring the capacity was created with a complementary filter using a Kalman filter in order to revise the level sensor data and IMU sensor data. The measuring precision of the proposed algorithm was assessed through repetitive experiments by varying the liquid capacity and the rotation angle of the liquid tank. The measurements of the capacity within the liquid tank were precise, even when the liquid tank was rotated. Using the proposed algorithm, one can obtain highly precise measurements, and it is affordable since an existing level sensor is used.
1. Introduction Continuous or discontinuous measurements are used to assess the capacity of liquid contained in vehicles, tanker trucks, and industrial tanks. Continuous measurements are divided into the following types: buoyancy, weight measurement, pressure, capacitance, ultrasound, and radiation. Discontinuous measurements are divided into the following types: conductivity, heat transfer, capacitance, optical, ultrasound, and microwave [1–3]. Some sensors used for measuring liquid level are summarized in Table 1. The pressure level sensor, a double-continuous measuring type, forms the core of the measurement market owing to its affordability, simplicity of its gauge, and its ability to work at high temperature and high pressure. The ultrasound- and radar-type sensors are more efficient than others in measuring the methods but these sensors are not economical [4, 5]. Most demand for current level sensors comes from water treatment plants (sewage, industrial water, wastewater, and black water), a national key industry, and the sector that measures the flow rate for vehicles and vessels. The level sensor is especially adequate for measuring the flow rate of vessels and the fuel of vehicles. The existing method for measuring the vehicle fuel involves measuring poles and floating box [6]. This is structurally limited because it is immeasurable when the fuel tank
of the vehicle is below 10%. In addition, measuring errors occur because the fuel gets heeled over when the vehicle turns or accelerates as shown in Figure 1. This paper proposes a new fuel-measuring algorithm using a pressure level sensor that can be applied for fuel control and measurements of vehicles. The system can accurately measure the fuel capacity below 10% by improving mechanical limits of the existing method in measuring the capacity. Furthermore, the measurement errors are minimized by continuously measuring and revising the slopping or heeling of fuel when the vehicle turns or accelerates. This revised algorithm guarantees precision for laser- and ultrasoundtype sensors. In addition, this algorithm is highly economical because an existing pressure level sensor [7] has been used.
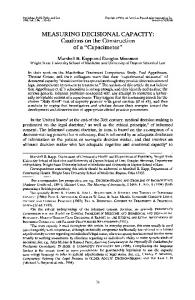
2. Sensor Design The proposed sensor should have a characteristic of a measuring algorithm of density and capacity for fuel measurement and a revised method in accordance with the fuel tank’s condition, acceleration, and acceleration of gravity. Figure 2 demonstrates the system which this research has proposed. A pressure level sensor is used to measure capacity, density, and tilting angle, and an inertial measurement unit (IMU) is used to revise the measuring value in accordance
2
Mathematical Problems in Engineering Table 1: Comparison of sensors used for measuring liquid level.
Sensor type Pressure type [9] Float type [10]
Scope of measurement [m]
Precision
Temperature limits [∘ C]
Pressure limits [kgf/cm2 ]
0.1–100
±0.05 [FS%]
70
—
Customizable
6.35 mm
105
—
Displacement type [11]
0.3–3
±2 [%]
370
300
Capacitance type [12]
0.1–4
±0.1 [%]
200
102
Weight level type [13]
30.5
10 [mm]
49
Radiation type [14]
7
0.5 [%]
50
— No limitation (noncontact)
Ultrasonic type [15]
8–11
±0.5 [%]
70
30
±10
Radar type [16]
3
By the strength of windows
Level sensor Lev e s en l sor
Measurement error
Measurement value 10%
𝜃
(a)
(b)
Level sensor Measurement error
Measurement value
(c)
Figure 1: Disadvantages of current fuel-measuring methods for vehicles. (a) Structural limits result in inability to measure the remaining 10% of fuel. (b) Fuel-measuring error on slopes. (c) Fuel-measuring error when accelerating.
with the rotation, acceleration, and acceleration of gravity [8]. The unique approach of this paper is that the relative value in accordance with the location of the level sensor and the rotation angle data of the IMU are both used to measure the position of a fuel tank. The reasons are as follows. The IMU outputs a precise measurable value for the rotation angle and acceleration measurements, but its disadvantage is that such values are accumulated with time by an integration constant. In the case of a level sensor, it can measure the tilting angle and acceleration in accordance with the measuring value difference located structurally, but the measurements may not be accurate. The proposed algorithm of this paper guarantees precision and credibility because it uses the Kalman filter to realize a complementary filter with precision despite the error
accumulation of the IMU and the imprecision and nonaccumulation of errors of the level sensor.
3. Sensor Measurement Algorithm for Precise Measurements of Sensors 3.1. Measuring Algorithm of Capacity. As demonstrated in Figure 3, the capacity can be computed in accordance with the container volume and the input capacity of the liquid. The mass can be computed using the pressure applied to the bottom of a container with liquid. First, the calculation equation of the capacity is as follows: Pressure applied to the bottom of the container ∝ liquid level × liquid density.
(1)
Mathematical Problems in Engineering
3
Sensor integration algorithm using 3-axis IMU and level sensor
(i)) High h accuracy (ii) Error propagation: O
(i) ( ) Low accuracy (ii) Error propagation: X
(i) ( ) Capacity measurement (ii) Density measurement
Figure 2: Algorithm applied in this assignment.
Sensing unit 3
P (kg/m ) (liquid density)
h (cm) (height)
A (m2 ) (area) 20 c
m
Sensor 7
k d tan Liqui
Sensor 2
Sensor 3
Sensor 4
Sensor 1 Sensor 5
Sensor 6
cm 20
Figure 3: Measuring method for capacity. Figure 4: Sensor location to measure the sensor.
The equation to compute the force applied to the bottom in accordance with the liquid is as follows [17]: 𝐹 = 𝜌 × 𝐴ℎ × 𝑔
(𝑔: Gravitational acceleration) .
(2)
Therefore the pressure 𝑃 applied to the unit area of the bottom side can be defined as in the equation below [2]: 𝑃=𝜌×𝑔×ℎ (If there is no internal pressure in the tank) , 𝑃 − 𝑃0 = 𝜌 × 𝑔 × ℎ
(3)
(If there is an internal pressure in the tank) .
In this control system, the following method has been used to measure the capacity. The sensor attached toward the 𝑥-axis and 𝑦-axis from the center of the target container is located on the opposite side of the container. The obtained measurement value is used to calculate the average value of each axis, and the
capacity is computed by comparing the accumulated data from experiments: Sensor1 out + Sensor2 out 2 Sensor3 out + Sensor4 out B= 2 Sensor5 out + Sensor6 out C= 2 A=
(4)
(A + B + C) 3 = The average value of the output voltage →
(5)
The measuring comparison by the input data. Here the output value of each sensor does not accumulate, but the precision is low. This sensor output value changes with turning and accelerating and is used in the revised algorithm to measure the capacity. 3.2. Measuring Tilting Angle with Level Sensors. In Figure 4, the sensor installed on the opposite side of each axis receives
4
Mathematical Problems in Engineering
Sensor 7
Gyro
ADC
HDR
ADCtoLEVEL
gn
tank Liquid
P1
DIFF_angle
h1
DIFF_level
Attitude Kalman filter
Rn
Sensor 4 P2
Level Kalman filter
Level
h2
Figure 6: Measuring methods of the rotation angle of the liquid tank and acting forces. Figure 5: Liquid tank and sensor mimetic diagram to measure density.
different pressures in accordance with the turning, and ideally the sum of the sensors on the opposite side must be the same as when the vehicle is not rotating. The tilting angle is computed based on this definition: Sensor1 out + Sensor2 out = 𝑥-Axis Tilting Value, ADC/𝜃ref Sensor3 out + Sensor4 out = 𝑦-Axis Tilting Value ADC/𝜃ref
(6)
0 = 𝑧-Axis Tilting Value. In the equation above, Sensor 1–Sensor 6 are digital values obtained by an ADC board used for implementation, and ADC/𝜃ref is the ADC value (constant) per tilting angle obtained from experiments. Sensors 5 and 6 are only used as a means to increase the accuracy because they duplicate 𝑦axis of rotation. Therefore Sensors 5 and 6 are not used in the data analysis. 3.3. Measuring Algorithm of Density. Figure 5 is the schematic diagram of the attached sensor in the container in order to compute the density. The density is computed with the signals outputted from the sensor attached to the container:
The equation above is a basic equation to compute liquid density, and 𝑃1 and 𝑃2 from the above equation are Sensor 7 and Sensor 4 in Figure 5, respectively [18, 19].
4. Multiple Sensors Algorithm to Improve the Precision of the Result Value of the Sensor Figure 6 is a block diagram of the algorithm to accurately measure the capacity when the liquid tank has rotated by the force applied to it. An attitude Kalman filter computes accurate values, while accumulating almost no errors, by receiving the rotation angle data from the IMU and level sensor. Furthermore, a level Kalman filter precisely measures the capacity by using the obtained rotation angle data and level increment. The holistic drift reduction (HDR) filter used is excellent in avoiding drift in the obtained data from the IMU. The acceleration of gravity is distributed to the gravity value of each axis in accordance with the fuel tank conditions. 4.1. Revision of IMU Sensor. When the output of the IMU ̃ 𝑏 , 𝜔𝑏 with a revised drift and sensor has an angular speed of 𝜔 scale is computed using the HDR algorithm: ̃ 𝑏 − 𝑏𝑔 . 𝜔𝑏 = 𝜔 𝑏𝑔 .
(8)
Here the HDR algorithm is used to compute the bias value
Sensitivity of the sensor × Pressure = Output voltage →
4.2. Attitude Kalman Filter
Output Voltage = Pressure (pa) , Sensitivity of the sensor
4.2.1. Initialize. The state variables to be used in the Kalman filter are indicated as a rotation matrix and as Eulerian angles, and the covariance matrix is indicated as the covariance of Eulerian angles.
𝜌 × 𝑔 × (ℎ2 − ℎ1 ) = 𝑃2 − 𝑃1 → 𝜌=
(7)
𝑃1 − 𝑃2 , 𝑔 (ℎ2 − ℎ1 )
where 𝜌 is liquid density, 𝑔 is gravitational acceleration, ℎ is height, and 𝑃 is pressure.
State variables are as follows: 𝑥 = 𝑅𝑏𝑛
(State variables for the rotation matrix)
𝑦 = Λ𝑛
(State variables for the Eulerian angles) .
(9)
Mathematical Problems in Engineering
5
Covariance matrix of Eulerian angles is as follows: 𝜎00 𝜎0𝜃 𝜎0𝜓 ] [ ] 𝑃=[ [ 𝜎0𝜃 𝜎𝜃𝜃 𝜎𝜃𝜓 ] . [𝜎0𝜑 𝜎𝜃𝜓 𝜎𝜓𝜓 ]
(10)
State variables and covariance matrix are initialized as follows: ̂ 𝑘=0 = 𝐼3×3 , 𝑥 𝑇
̂ 𝑘=0 = [0 0 0] , 𝑦
(11)
𝑃𝑘=0 = 108 𝐼3×3 . 4.2.2. Attitude Prediction (i) System Model. The angular speed measured by sensors has differentials of the rotation matrix and the following relation: 𝑛 𝑅̇ 𝑏 = 𝑅𝑏𝑛 Ω𝑏 . 𝑏
(12) 𝑏
Here, Ω is the skew-symmetric matrix of 𝜔 and is defined as follows: 0 −𝜔𝑧 𝜔𝑦 [ ] 0 −𝜔𝑥 ] Ω =𝜔 ×[ (13) [ 𝜔𝑧 ]. 0 ] [−𝜔𝑦 𝜔𝑥 In addition, the differentials of Eulerian angles have angular speed and the following relation: 𝑏
𝑏
𝑛 Λ̇ = 𝐶1−1 𝜔𝑏 .
(14)
Here, 𝐶1−1 is a matrix that converts the angular speed measured by the gyro sensor into Eulerian angles: 1 sin 0 tan 0 cos 0 tan 𝜃
[ 𝐶1−1 = [0
− sin 0 ] ].
cos 0
(15)
[0 sin 0 cos 𝜃 cos 0 cos 𝜃]
4.2.3. Attitude Updates by Gravity (i) Attitude Measurement Model of Sensors of Gravity. The matrix that indicates the attitude of sensors utilizing 0̃ and 𝜃̃ is revised as follows: ̃ 𝑅 (0) ̃ 𝑅𝑛 . 𝑅𝑏𝑛 ← 𝑅𝑦 (𝜃) 𝑥 𝑏 Furthermore, Eulerian angles are revised as follows: 0̃ ] [ ̃] Λ𝑛 ← Λ𝑛 + 𝐶0−1 [ [𝜃] . [0]
(ii) Prediction. Consider ̂− = 𝑋 ̂ 𝑘−1 (1 + Ω𝑏 Δ𝑡) 𝑋 𝑘
Here, 𝐶0−1 is as follows:
𝐶0−1
cos 𝜓 [ cos 𝜃 [ [ = [ sin 𝜓 [ [ cos 𝜓 [ tan 𝜃
sin 𝜓 0 cos 𝜃 ] ] ] cos 𝜓 0] . ] sin 𝜓 ] 1 tan 𝜃 ]
(16)
̂ 𝑘−1 + 𝐶1−1 𝜔𝑏 Δ𝑡. ̂ −𝑘 = 𝑦 𝑦 The covariance of Eulerian angles is updated as follows: (17)
ℎ (Λ𝑛 ) = Λ𝑛 .
(22)
The attitude measurement value 𝑍𝑘 is computed as follows, ̃ utilizing 0̃ and 𝜃: 0̃ ] [ ̃] 𝑍𝑘 = Λ𝑛 + 𝐶0−1 [ [𝜃] . [0]
(23)
̂ −𝑘 , ̂ 𝑘 = 𝑅𝑦 (𝐾𝜃 Δ𝜃) 𝑅𝑥 (𝐾0 Δ0) 𝑥 𝑥 ̂ 𝑘 = 𝑘̂− + 𝐾𝑘 (𝑧𝑘 − ℎ (̂ 𝐾 𝑦−𝑘 )) . 𝑘
𝑇
(18)
(24)
Here, 𝐾0 is column 1 row 1 element of 𝐾𝑘 , and 𝐾𝜃 is column 2 row 2 elements of 𝐾𝑘 :
−1
𝐾𝑘 = 𝑃𝑘− (𝑃𝑘− + 𝐶0−1 𝑅𝐶0−𝑇 ) .
(25)
Here, 𝑅 = diag(𝜎02 , 𝜎𝜃2 , 𝜎𝜑2 ) is computed as below because the benefit must increase when acceleration is near 1 g, and it should decrease when the size of acceleration exceeds 1 g: 𝜎0 = 𝜎𝜃 = 0.1 + 𝑓𝑏 − 1 + 100 𝜔𝑏 ,
Here, 𝑄 = diag(𝜎02 , 𝜎𝜃2 , 𝜎𝜑2 ) is computed as follows: 𝜎𝐴 = [𝜎0 𝜎𝜃 𝜎𝜓 ] = 10 + 𝜔𝑏 .
(21)
The attitude measurement model function ℎ(⋅) of the sensor utilizes Eulerian angles without changes as follows:
𝑃𝑘 = 𝑃𝑘− = 𝐾𝑘 𝑃𝑘− ,
𝑃𝑘− = 𝑃𝑘−1 + 𝐶1−1 𝑄𝐶1−𝑇 (Δ𝑡)2 .
(20)
(ii) Attitude Update. One has
If 𝜃 ≈ ±𝜋/2 in the matrix above, it is cos 𝜃 ≈ 0, which generates the denominator of matrix element to be close to 0 at times. However, such a case refers to the fact that when the sensor stands vertically, this does not occur if one considers the location and direction when attaching the sensor.
̂ 𝑘−1 𝑅𝑧 (𝜔𝑧 Δ𝑡) 𝑅𝑦 (𝜔𝑦 Δ𝑡) 𝑅𝑥 (𝜔𝑥 Δ𝑡) , =𝑋
(19)
𝜎𝜓 = 108 .
(26)
6
Mathematical Problems in Engineering
4.2.4. Attitude Update by Level Sensors (DIFF). The fuel tank of a vehicle has its direction of motion set to the 𝑥axis (heading), so the attitude may be updated with the rotation angle data obtained by level sensors. First, velocity and rotation angle DIFF obtained from the IMU are brought in. Then, from the rotation matrix 𝑅𝑏𝑛 , the yaw angle of the vehicle can be computed as follows: Ψ𝜐 = tan−1 (
𝑎21 ). 𝑎11
(27)
Here, 𝑎𝑖𝑗 is the matrix “𝐼” of the rotation matrix 𝑅𝑏𝑛 and the element of column “𝑗.” The matrix indicating the attitude of the fuel tank from the angle and direction of vehicle Ψ𝜐 measured by level sensors is revised as follows:
𝑎 = V̇ + V × 𝜔 + 𝑅𝑔𝑇
̃ 𝑅𝑛 , 𝑅𝑏𝑛 ← 𝑅𝑧 (Ψ) 𝑏
(28)
̃ ≅ Ψlevel − Ψ. Ψ Furthermore, Eulerian angles are revised as follows:
𝑛
𝑛
Λ =Λ +
𝐶0−1
4.2.5. Attitude Measurement of Vehicles by Gravity. Since the acceleration of gravity is always toward the center of the earth, 𝑔 = (0, 0, −9.81 m/s2 ) is measured if another force is not applied to the acceleration sensor. The sensor attitude can be revised by comparing the acceleration measured by the acceleration sensor and the acceleration of gravity. However, this is possible if gravity is the only force applied to the acceleration sensor. Since it is not possible to separate the acceleration of gravity from other forces and measure it, the simplest method is to assess if the condition of the applied forces other than the acceleration of gravity is ‖𝑎‖ ≈ ‖𝑔‖. 𝑎 = [𝑎𝑥 𝑎𝑦 𝑎𝑧 ], the acceleration measured by the acceleration sensor, includes various types of acceleration in accordance with the acceleration of gravity and the acceleration of the sensor. As an equation, this would be as follows:
0 [ ] [0] . [ ] ̃ [Ψ]
(29)
(∵ 𝑅𝑇 = 𝑅−1 )
𝑤𝑥 0 V𝑧 −V𝑦 V̇𝑥 ][ ] [V̇ ] [ ][ ] = [ 𝑦] + [ [−V𝑧 0 V𝑥 ] [𝑤𝑦 ] [V̇𝑧 ] [ V𝑦 −V𝑥 0 ] [𝑤𝑧 ]
(35)
− sin 𝜃 [ cos 𝜃 sin 𝜙 ] + 𝑔𝑧 [ ]. [cos 𝜃 cos 𝜙]
The attitude measurement model function ℎ(∗) of a fuel tank still utilizes the Eulerian angles as follows: ℎ (Λ𝑛 ) = Λ𝑛 .
(30)
The attitude measurement value 𝑍𝑘 is computed as follows, utilizing Ψ: 0
[ ] ] 𝑍𝑘 = Λ𝑛 + 𝐶0−1 [ [0] . ̃ [Ψ]
(31)
5. Capacity Measuring Algorithm through Revised Rotation Angle Data and Measurement Value of Level Pressure Capacity is computed as a digital value through the ADC board. When the acquired ADC and capacity are = Sensoradc /(ℓ/adc), the equation to compute the capacity is as follows. 5.1. Level Kalman Filter
(i) Attitude Update. One has ̃ 𝑥 ̂ 𝑘 = 𝑅𝑧 (𝐾Ψ Ψ) ̂ −𝑘 , 𝑥 ̂ −𝑘 + 𝐾𝑘 (𝑧𝑘 − ℎ (̂ ̂𝑘 = 𝑦 𝑥−𝑘 )) . 𝑦
(32)
5.1.1. System Model. The difference value of the level sensor measured in the coordinate system of the fuel tank is converted into a navigation system: ̇ 𝑛 = 𝑅𝑛 Diff 𝑏 . level 𝑏 level
Here, 𝐾Ψ is a 3 × 3 element of 𝐾𝑘 : 𝑅𝑘 = 𝑃𝑘− − 𝐾𝑘 𝑃𝑘− ,
The formula above is made into an equation of state as follows: −1
𝐾𝑘 = 𝑃𝑘− (𝑃𝑘− + 𝐶0−1 𝑅𝐶0−𝑇 ) .
(33)
Here, 𝑅 = diag(𝜎02 , 𝜎𝜃2 , 𝜎𝜑2 ) is computed as follows:
2𝜎level , 𝜖 = 10−6 , 𝜎level = 10. 𝜖 + 𝑉IMU
𝑛 level𝑛 1 𝑅𝑏𝑛 level [ ][ ]=[ ]. ̇ 𝑛 ̇ 𝑛 0 1 level level
(37)
State variables are
𝜎0 = 𝜎𝜃 = 108 , 𝜎𝜓 =
(36)
(34)
̂𝑘 = [ 𝑥
level𝑛 ̇ 𝑛 level
].
(38)
Mathematical Problems in Engineering
7
Table 2: 26 PC Series performance characteristics [7].
Excitation Response time Input resistance Output resistance Weight
Min. — — 5.5 k 1.5 k
Type 10 — 7.5 k 2.5 k 2
Max. 16 1.0 11.5 k 3.0 k
Units Vdc ms Ohm Ohm Gram Figure 8: IMU: analog device ADIS16365.
Figure 7: Level sensor (side view of 26 PCSPS pressure sensors used).
Figure 9: AMP: analog device AD8555.
5.1.2. Prediction. In the formula below, 𝐺 has a bias value due to noise and the level. 𝐹 has [ 0𝐼 00 ]. The equation depends on the general Kalman equation: ̂ −𝑘 = 𝐴̂ 𝑥𝑘−1 + 𝐺𝑢𝑘 Δ𝑡, 𝑥 𝑃𝑘− = 𝐴𝑃𝑘−1 𝐴𝑇 + 𝐺𝑄𝐺𝑇 Δ𝑡2 , 𝐴 = 𝐼 + 𝐹Δ𝑡,
(39) Figure 10: Test bed: internally developed.
𝑄 = diag (𝜎𝑓2𝑥 , 𝜎𝑓2𝑦 , 𝜎𝑓2𝑧 , 𝜎𝑔2𝑥 , 𝜎𝑔2𝑦 , 𝜎𝑔2𝑧 ) .
6. Experiment Table 2 shows the specifications of the pressure sensor applied to the system. The display device of the algorithm built on this research has a level sensor (Figure 7) to measure absolute pressure and the tilting angle; an IMU (Figure 8) for measuring the rotation angle, acceleration, and so forth; a programmable AMP (Figure 9) that can consistently program the increase rate of pressure between sensors by amplifying the values of pressure sensors in the desired offset; and a test bed (Figure 10). Capacity Measurement of Distilled Water Using Level Sensors. In order to measure capacity using level sensors, the sensor output must have a linear output in accordance with the capacity. To assess it, the research team sequentially inserted 1 L–11 L of water (distilled water, density ≈ 1) into the test bed and assessed each sensor value. In order to avoid continuity
and obtain objective data, the experiment was conducted once a day over three days. After the experiment, the team removed all distilled water from the test bed and conducted the experiment again. Figure 11 demonstrates a 1 L/75 ADC value and 0.25 V/ 75 ADC value. Figure 11 indicates the difference of values in the first, second, and third measurements and each sensor value with a margin of error of ±1%. The output graph of Sensors numbers 5 and 6 differs from the output graph of Sensors numbers 1, 2, 3, and 4 owing to the installed location. Sensor number 7 reacts when it is over 11 L because it was located on the upper part of the test bed to measure density. The level sensors used in this research are linear overall, demonstrating that capacity and density computation is possible. However, the margin of error increases with rotation. Figure 12 shows the output value measured three times at a 0∘ , 15∘ , 30∘ , and 45∘ rotation, and it indicates that the value increased or decreased significantly in accordance with the rotation angle.
8
Mathematical Problems in Engineering
700 600 500 400 300 200 100 0
1-liter to 11-liter linear increase, sensor data (average, SD) 900 800 700 600 500 400 300 200 100 0 4 5 6 7 8 9 10 11 1 2 3 4 5 6 7 8 Water capacity (liter) Water capacity (liter) Sensor data (ADC value)
Sensor data (ADC value)
800
1
2
3
Sensor 1 Sensor 2 SD: standard deviation
Sensor 4 Sensor 3
9
10
Sensor 5 Sensor 6 Sensor 7
Sensor 7
tan Liquid
Sensor 2
Sensor 3
k
Sensor 1 Sensor 5 Sensor 6
Sensor 4
900 800 700 600 500 400 300 200 100 0
11-liter tilt (Sensor 3, derection) Sensor data (ADC value)
Sensor data (ADC value)
Figure 11: Output value of sensor in accordance with water quantity (1–11 L).
0
15
30 Tilt angle (deg.)
Sensor 3 Sensor 4
Sensor 5 Sensor 6 (a)
45
900 800 700 600 500 400 300 200 100 0
11-liter tilt (Sensor 4, derection)
0
15
30 Tilt angle (deg.)
Sensor 3 Sensor 4
45
Sensor 5 Sensor 6 (b)
Figure 12: Output graph of sensor in accordance with rotation. (a) Tilt toward Sensor 3; (b) tilt toward Sensor 4.
11
1000
9
Revision of rotation angle and acceleration of gravity
800 600 400 200 0 5
10 Sensor 1 Sensor 2 Sensor 3 Sensor 4
15
20 25 30 Tilt angle (deg.)
35
40
Measured angle of level sensor (deg.)
Sensor data (ADC value)
Mathematical Problems in Engineering 50 45 40 35 30 25 20 15 10 5 0
Sensor 5 Sensor 6 Sensor 7
5 deg. 10 deg. 15 deg. 20 deg. 25 deg.
30 deg. 35 deg. 40 deg. 45 deg.
Figure 15: Result graph of measuring the rotation angle using level sensor data.
1 2 3 4 5 6 7 8 9 10 11 12 13 14 15 16 17 The number of repetitions 5 deg. 10 deg. 15 deg. 20 deg. 25 deg.
30 deg. 35 deg. 40 deg. 45 deg.
Figure 14: Result graph of measuring the rotation angle using IMU data.
When tilting toward Sensor 3, the value of Sensor 3 and Sensor 5 on the Sensor 3-axis increases, whereas the value of Sensor 4 and Sensor 6 on the opposite side decreases. When tilting toward Sensor 4, the value of Sensor 4 and Sensor 6 on the Sensor 4-axis increases, whereas the value of Sensor 0 and Sensor 2 on the opposite side decreases. Sensor 1 and Sensor 2, which are irrelevant to the tilting direction, demonstrated no change, and so the team has not included it here. The experiment results indicate that measuring capacity and density only with a level sensor generates a large margin of error when there is tilting involved. Therefore, it is inadequate to measure the capacity and density of a liquid using only level sensor. When revising the rotation angle and acceleration of gravity with the algorithm this paper proposes, the measurement results are obtained in Figure 13. The research team inserted 11 L of distilled water into the test bed, tilted it by 5∘ , and measured the sensor value. Figure 13 demonstrates a stable result compared with the sensor graph before the application of the algorithm. This
Measured angle of suggested AL (deg.)
Measured angle of IMU (deg.)
Figure 13: Measurement result graph using algorithm that has revised rotation angle and acceleration of gravity. 50 45 40 35 30 25 20 15 10 5 0
1 2 3 4 5 6 7 8 9 10 11 12 13 14 15 16 17 The number of repetitions
50 45 40 35 30 25 20 15 10 5 0
1 2 3 4 5 6 7 8 9 10 11 12 13 14 15 16 17 The number of repetitions 5 deg. 10 deg. 15 deg. 20 deg. 25 deg.
30 deg. 35 deg. 40 deg. 45 deg.
Figure 16: Result graph of measuring the rotation angle with the proposed algorithm.
is because the accurate estimation of the rotation angle and its revision value were designed with a Kalman filter. Thus estimating the rotation angle is important in this algorithm. The comparative results of the proposed algorithm that estimates the rotation angle are as shown in Figure 14. Figure 14 demonstrates the measurements of rotation angles using only the IMU; the measurement is carried out once every minute. As indicated in Figure 14, the margin of error continuously accumulated, demonstrating a large difference in value after 17 min from the beginning. Furthermore, when measuring the rotation angle with only level sensors (Figure 15), the margin of error does not accumulate and is drifting as with the IMU data, but the margin of error is significantly large. Figure 16 shows the rotation angle using the algorithm proposed by this paper. The margin of error is within ±5%, which is relatively accurate compared with existing methods.
Mathematical Problems in Engineering
Sensor output (ADC value)
10
800 700 600 500 400 300 200 100 0
Linearity of suggested AL (sensor output)
1
2
3
3 4 5 6 7 8 (Reset) Water capacity (liter)
Sensor 1 Sensor 2 Sensor 3
9
10 11 12
Sensor 4 Sensor 5 Sensor 6
Accuracy of suggested AL (liter)
14 12 10 8 6 4 2 0
1
2
3
4
5 6 7 8 9 Water capacity (liter)
10 11 12 13
Liter Measure liter
Measured density (kg/m3 )
Measured water capacity (liter)
Figure 17: Measurement graph of capacity and density using the proposed algorithm.
Accuracy of suggested AL (density)
1.2 1 0.8 0.6 0.4 0.2 0
1
2
3
4
5 6 7 8 9 Water capacity (liter)
10 11 12 13
Density (a)
(b)
Figure 18: Comparative graph 1 to assess the precision of capacity and density measurements. (a) Accuracy graph of suggested algorithm for capacity; (b) accuracy graph of suggested algorithm for density.
The results of measuring capacity and density using the algorithm this paper has proposed are as shown in Figure 17. Figure 17 shows the output values of the experiment, where 1 L was inserted as a sensor value without tilting. However, the measurements were not conducted sequentially because each sensor has a slightly different minimum pressure value that computes the sensor output and because the sensor locations differ as well. For precise measurements, the research team inserted 3 L of distilled water, and when all sensors were reacting sufficiently, the team initialized the value and measured again. As demonstrated in Figure 17, accurate results from the measuring capacity could be obtained because the sensor value was close to the primary equation and each sensor had less difference in value. Figure 18 is the computation of density and capacity, which is very precise because it has a margin of error of only ±0.05 L compared with the actual capacity. The density was also very precise, with a margin of error of ±0.02 kg/m3 . Sensor number 4 and Sensor number 7 are used to measure the density. Sensor number 7 is placed on the upper part so it reacts only when the solution is more than 10 liters. Therefore the density can be measured from 10 liters. But if
the sensor can be placed lower, we can measure the density by using less fluid. In addition, Figure 19 demonstrates the results of the measurements with the same method as above, but tilting by 5∘ . As indicated in Figure 19, the margin of error of measurement increases in accordance with the tilting, and the maximum margin of error was only 0.5 L. Since it can be presumed that the larger the target capacity for measurement, the lesser the error ratio, this can be said to be a precise algorithm. As demonstrated in Figure 20, compared with the results when there was no tilting, there has rarely been any difference in density, and the result was ±0.05 kg/m3 . For Figure 21, the program was implemented with a graphical user interface (GUI), and its resulting values were continuously obtained and observed.
7. Conclusion This research proposed an algorithm using a level sensor and IMU sensor to improve the limitations of the existing methods of measuring the liquid capacity. For this, the research
Capacity relative error (liter)
Mathematical Problems in Engineering
11
Capacity relative error with rotation angle
0.5 0.4 0.3 0.2 0.1 0
5
10
15 20 25 30 Rotation angle (deg.)
35
40
Relative error (average)
Figure 19: Comparative graph 2 to assess the precision of measurements of capacity and density.
Density measurements with respect to rotation angle
Density (kg/m3 )
1.2 1 0.8 0.6 0.4 0.2 0
1
2
3
0 deg. 5 deg. 10 deg. 15 deg. 20 deg.
4
5 6 7 8 9 Water capacity (liter)
10 11 12 13
25 deg. 30 deg. 35 deg. 40 deg.
Figure 20: Comparative graph 3 to assess the precision of measurements of capacity and density.
Figure 21: GUI to observe the measurement values in real time.
12 team installed level sensors and IMU sensors in a liquid tank and conducted sensing in real time. The proposed algorithm utilized the strengths of each sensor and supplemented their weaknesses, which were assessed through experiments. A measurement evaluation of the liquid level sensor was conducted by increasing and decreasing the liquid in the tank. The team increased the water level by units of 1 L and analyzed the output characteristics of up to 12 L. As a result, the system demonstrated a highly linear precision that was within ±0.5%. The offset voltage of the liquid level sensor was 93.5 mV, with a sensitivity of 363.5 mV/L. The output characteristic in inclined environments resulted in a value of 1% FS. In addition, the sensitivity to density measurements was 1085.28 [kg/m3 ], which is consistent with the computed value of the sensor output. The reproducibility of the sensor showed minute hysteresis, but since there was repeatability, a high-precision pressure level sensor was implemented as it can ignore this repeatability. The research team believes that, with the proposed algorithm, precise liquid capacity measurements in real time would be possible even during movement or tilting of the liquid tank.
Competing Interests The authors declare no conflict of interests.
References [1] K. Sohn, J. Kim, S. Cho, and J. Shim, “A study on the tank liquidlevel monitoring sensor systems for large scaled vessels,” Journal of the Korean Society of Marine Engineering, vol. 33, no. 2, pp. 330–335, 2009. [2] N. Min, “Sensor electronics,” Dongilbook, pp. 386–401, 2007. [3] Level sensor, Wikipedia, https://en.wikipedia.org/wiki/Level sensor. [4] S. M. Chandani and N. A. F. Jaeger, “Optical fiber-based liquid level sensor,” Optical Engineering, vol. 46, no. 11, Article ID 114401, 2007. [5] J. A. Morris and C. R. Pollock, “A digital fiber-optic liquid level sensor,” Journal of Lightwave Technology, vol. 5, no. 7, pp. 920– 925, 1987. [6] G. Nagy, Fuel Level Sensor Design from a System Perspective, 1997. [7] 26PC Series, Honeywell, http://sensing.honeywell.com/. [8] B. Park, Improving of the performance for wireless water level controller using the full-duplex communication module [M.S. thesis], Mokpo National University, Muan, Republic of Korea, 2005. [9] OTT PLS-Pressure Level Sensor, OTT, http://www.ott.com/. [10] C4651-continuous float level sensor, Madison, https://madisonco.com/. [11] Modulevel, Pneumatic displacer liquid level control, Magnetrol, http://us.magnetrol.com/. [12] Capacitance Level measurement Liquicap FMI51, Endress+ hauser, http://www.endress.com/. [13] YO-YO Series, SEMRAD, http://www.semrad.com.au/. [14] FIBERTRAC31, VEGA, https://www.vega.com/.
Mathematical Problems in Engineering [15] Rosemount 3100 Series Level Transmitters, EMERSON, http:// www2.emersonprocess.com/. [16] Rosemount 5400 Radar Level Transmitter, EMERSON, http://www2.emersonprocess.com/. [17] A. Kulkarni, R. N. Karekar, and R. C. Aiyer, “Liquid level sensor,” Review of Scientific Instruments, vol. 76, no. 10, Article ID 105108, pp. 1–5, 2005. [18] K. A. P. Menon and R. Hariharan, “A new liquid level sensor for process-control applications,” IEEE Transactions on Instrumentation and Measurement, vol. 28, no. 2, pp. 155–158, 1979. [19] J. Bayliss, “Applying sensors for level control,” Control and Instrumentation, vol. 16, no. 7, pp. 45–47, 1984.
Advances in
Operations Research Hindawi Publishing Corporation http://www.hindawi.com
Volume 2014
Advances in
Decision Sciences Hindawi Publishing Corporation http://www.hindawi.com
Volume 2014
Journal of
Applied Mathematics
Algebra
Hindawi Publishing Corporation http://www.hindawi.com
Hindawi Publishing Corporation http://www.hindawi.com
Volume 2014
Journal of
Probability and Statistics Volume 2014
The Scientific World Journal Hindawi Publishing Corporation http://www.hindawi.com
Hindawi Publishing Corporation http://www.hindawi.com
Volume 2014
International Journal of
Differential Equations Hindawi Publishing Corporation http://www.hindawi.com
Volume 2014
Volume 2014
Submit your manuscripts at http://www.hindawi.com International Journal of
Advances in
Combinatorics Hindawi Publishing Corporation http://www.hindawi.com
Mathematical Physics Hindawi Publishing Corporation http://www.hindawi.com
Volume 2014
Journal of
Complex Analysis Hindawi Publishing Corporation http://www.hindawi.com
Volume 2014
International Journal of Mathematics and Mathematical Sciences
Mathematical Problems in Engineering
Journal of
Mathematics Hindawi Publishing Corporation http://www.hindawi.com
Volume 2014
Hindawi Publishing Corporation http://www.hindawi.com
Volume 2014
Volume 2014
Hindawi Publishing Corporation http://www.hindawi.com
Volume 2014
Discrete Mathematics
Journal of
Volume 2014
Hindawi Publishing Corporation http://www.hindawi.com
Discrete Dynamics in Nature and Society
Journal of
Function Spaces Hindawi Publishing Corporation http://www.hindawi.com
Abstract and Applied Analysis
Volume 2014
Hindawi Publishing Corporation http://www.hindawi.com
Volume 2014
Hindawi Publishing Corporation http://www.hindawi.com
Volume 2014
International Journal of
Journal of
Stochastic Analysis
Optimization
Hindawi Publishing Corporation http://www.hindawi.com
Hindawi Publishing Corporation http://www.hindawi.com
Volume 2014
Volume 2014