which are collected from the Paka Thermal Power Station and good agreement are observed at lower wind velocity. I. INTRODUCTION. Peninsular Malaysia is ...
Proceedingsof The 6th International Conference on Properties and Applications of Dielectric Materials June 21-26,2000, Xi'an Jiaotong University, Xi'an, China
Development of Mathematical Relation between ESDD and Wind Velocity for a Contaminated Insulator in Malaysia Md. Abdus Salam, Hussein Ahmad, *Syed Ahmad Fuad, Ahmad S . Ahmad, Tarmidi Tamsir, M. A. M. Piah, Z. Buntat, **Zulkifly Saadom, **Razali Budin Faculty of Electrical Engineering Universiti Teknologi Malaysia 81310 JB, Malaysia.
*TNB Research Sdn Bhd Kajang, Selangor Malaysia
Abstract: Insulator contamination has been identified as the most important design parameter for external insulation of the high voltage network systems. Wind and electrostatic field plays an important role in transporting and depositing of that contamination over the insulator surface. This contamination severity on the insulator surface can be expressed and represented by Equivalent Salt Deposit Density (ESDD). The values of ESDD can be determined easily through a closed,form of mathematical relation. In this paper, a mathematical relation between ESDD, wind velocity and leakage distance of the insulator has been proposed using Dimensional Analysis technique. The results obtained from this analytical expression have been compared with the practical data, which are collected from the Paka Thermal Power Station and good agreement are observed at lower wind velocity.
I. INTRODUCTION Peninsular Malaysia is the western part of the Malaysia. South China Sea surrounded it on eastern part, while on the westem part by Indian Ocean and straight of Melacca. Interestingly, most of the country's power stations are on the coastal areas of the Peninsular. In the state of Terengganu Darul Iman, YTL Thermal and Paka Thermal Power Station are found. While in the state of Johor Darul Takzim Pasir Gudang Power Station is one of the major landmarks of the state. By virtue of their locations, which are closed to the sea, their outdoor insulators are easily polluted with salts coming from the seas. These insulators are an important component of the power station transforming voltage system, the high voltage switchyard and the transmission lines system. The supporting mechanism to hang the high voltage conductors to the tower is cap-and-pin glass string insulator. In the switchyard area, bushing type insulators are commonly used. Salt contamination of high voltage insulator is one of the major technical problems encountered by the power utilities. To name a few, YTL and Paka Thermal Power Stations are experiencing the same problems. The nature of whd all over the Malaysia is generally light and variable. But there are some uniform changes of the wind flow patterns. Depending on these changes, four seasons can be recognized as southwest monsoon, northeast monsoon and two shorter inter monsoon seasons [l]. The
0-7803-5459- 1/99/$10.00"19991EEE
** EPE Power Corporation Sdn Bhd Jalan Ipoh, Kuala Lumpur Malaysia
southwest monsoon is usually started in the end of May or early June and finished in the month of September. The prevailing wind flow is generally southwesterly and light i. e. below 15 knots. The northeast monsoon usually started in early November and finished in March. During this season, steady easterly or northeasterly winds of 10 to 20 knots are found everywhere. The severely areas are identified in the east coast sides of Peninsular Malaysia where the wind may be reached 30 knots or more during the periods of intense surges of cold air from the north. The winds between the two inter monsoon seasons are generally light and variable [2]. The equatorial lies over the Malaysia during inter monsoon season. It is worth mentioning that during the month of April to November, when typhoons frequently develop over the west Pacific and move westwards across the Philippines, southwesterly winds over the northwest coast of Sabah and Sarawak region may be strengthen and reaching 20 knots or more. Mainly the Malaysia is a maritime country. Therefore, the effect of land and sea breezes on the general wind flow pattern is very remarkable especially in days with clear skies. In sunny afternoons, sea breezes of 10 to 15 knots are oftenly developed and spread out upto 10 kilometers to the inland area. In clear nights, the reverse process takes place and land breezes of weaker strength can be developed over the coastal areas. Observations are recorded that the wind speed increases during the rainy season's [3]. Small drops of seawater are produced when high waves are generated by the wind and collide with rocks and breakwaters. These are transported by the wind and contaminated the insulator. Minimum wind velocity does help the accumulation of contaminants on the insulator surface. Whereas higher wind velocity blown off the particle of contaminants from its surface. But some contaminants are still adhered to the bottom surface of the insulator. Therefore, the effect of wind velocity for the accumulation of contamination on the insulator surface is not negligible. The accumulation of contaminants of the insulator surface forms a dry Contamination layer. The dry layer of contaminants forms a conductive path when moisten by dews or light rain.
379
The high temperature evaporates the conductive layer for a short period and almost 90 YOcontaminants are blown away from the surface by the wind velocity [4]. Since the remaining portion of contaminants is not removed by the wind and it can be produced high leakage current on the insulator surface under high humidity conditions. Ultimately, this situation can trigger to surface flashover [ 5 ] . The flashover on the insulator surface are oftenly occur at wind velocity less than 3.5 &sec ' [ 6 ] . The empirical relation between ESDD and wind velocity has been established based on practical data [7]. Here, the relation between ESDD and wind velocity has been developed using Dimensional Analysis technique and verified by the practical data.
For k = 1 , the solutions may be arranged in the matrix form as given below, ESDD wv 1 N V
-3
1
3n+l
x = ESDD (wv)-, I
-
3n+l
-1
n -1 -
n
n
n
I
n-l
Nn V
(7)
By applying the Bucking R theorem, the above equation can be derived as:
11. RELATION DEVELOPMENT
In the practical field, the wind velocity, leakage distance of the insulator and static arc constant, influences the ESDD. For calculating the ESDD supply voltage is also required. Therefore, the relation between the above parameters can be written as:
The above can be modified by choosing the value of
ESDD = ESDD (wv, I , N , V>
This is the final relationship between ESDD and wind velocity of the contaminated insulator.
(1)
0.3 [8] and
N,
n is
v are considered as constant [9].
The dimensional matrix of the above variables can be written as: 111. DATA COLLECTION
ESDD
wv
I
M
T
-3
-1 0
n-1
0
,
-1
,
Where k I , k 2 , k, , k and k are the exponents of the variables E S D D , wv, I, N and V respectively. Here, the rank of the matrix is 4.The dimensionless product of the whole set is 1. The algebraic equations from the above dimensional matrix can be written as: - 2kl+ k 2
k, +k, k2
+ k, + k, + 2 k ,
+
=
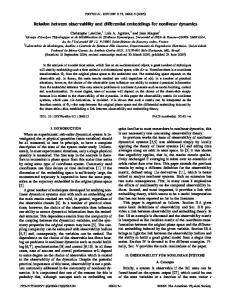
The effect of contamination severity is high near the coastal region. Here the major contaminants are the sea salt. This sea salt are contaminated the insulator of power stations and also transmission lines. In Malaysia, YTL and Paka Thermal Power Station is very near to the South China Sea. For measuring contamination severity in terms of ESDD, cap-and-pin glass insulator was installed about 50 meters far from the seacoast [ 3 ] . The insulator unit is hung as a suspension type, around three-meter height from the ground. The experimental arrangement is shown in Fig. 1. The values of ESDD of the insulator are collected against different values of wind velocity. These are shown in Table 1 and 2.
0
k, =O
+ 3k, + 3k,
=0
(n-1) k , - k, = 0 The expression of k , , k,, k, and k,in terms of k , can be derived from equation (2), (3), (4)and ( 5 ) as: 1 n-1 k , = - k , , k , = -kl, n n
380
3n + 1 k , = -k , , k 2 = - 3 k , n
Fig. 1. Experimental arrangement for collecting ESDD data.
Table 1. Values of ESDD against first group of wind velocity
1
Windvelocity (&sec) 2.0
1
0.02
-
m /e
ESDD (mg/cm2)
//
d
0.00258 0.01
-
n 0.008
8
01 0
Table 2. Values of ESDD against 2nd group of wind velocity
I
Windvelocity
I
0.006 0.004 0.002 --
2
1
3
4
5
Wind velocity [m/sec]
ESDD
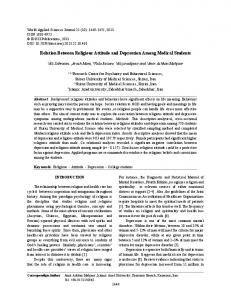
Fig. 2. Variation of ESDD with 1st group wind velocity
0.1
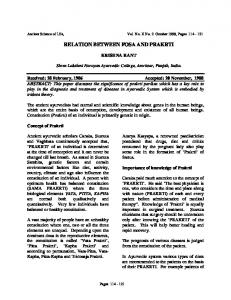
IV. RESULTS The calculation of contamination severity in terms of ESDD of the insulator surface is not a simple work. This work is involved with the effect of environmental meteorological parameters, where transmission lines and switchyard are installed. Wind velocity is one of the most important parameter of them, which has great influenced of the contamination deposition on the insulator surface. The mathematical relationship between ESDD and wind velocity has been developed based on Dimensional Analysis technique. The values of ESDD of the insulator surface against different group of wind velocity are calculated from the equation (9). The values of ESDD obtained from the practical site are plotted in Fig. 2 and Fig. 3. The same obtained from the model is plotted in the Fig. 2 and Fig. 3 for comparison. From Fig. 2, it is shown that the model results are in more consistent with the results obtained from the practical site at the first group of wind velocity. Here, the first group of wind velocity is considered from 2.0 m/sec to 4 m/sec. But from Fig. 3, it is observed that the results obtained from the practical site is lower than the model results up to wind velocity 5 d s e c . After this wind velocity, the practical values of ESDD of the hsulator surface higher than the model results. This inconsistent between the result is happened due to the higher wind velocity with different direction. In the higher wind velocity, the contaminants deposited on the insulator surface with anomalous way. At this time the values of ESDD either increased or decreased. But in general way, the values of ESDD will be increased with the increase of wind velocity. Sometimes the combined action of strong wind and rainfall removed the contaminants from the surface of the insulator. But in the long term, the wind velocity and its associated parameter such as wind direction are helping to accumulate more contaminants on the insulator surfaces.
-$ p
2 3
0.09 0.08 0.07 0.06 0.05 0.04 0.03
w 0.02 0.01
- . 4
4.5
5
5.5
Windvelocity
6
6.5
I
[m/sec]
Fig. .3. Variation of ESDD with 2nd group of wind velocity
V. CONCLUSIONS Near coastal area, the contamination severity of the insulator in terms of ESDD is a major problem for reliable operation of transmission lines. This problem can be solved economically by designing the insulator for the contaminated environment. Closed form mathematical relation is required for designing purposes. In this paper, a mathematical relationship between the ESDD and wind velocity of the contaminated insulator has been developed based on' Dimensional Analysis technique. The results obtained from the mathematical model are compared with the practical results and close agreements are found. VI. ACKNOWLEDGEMENTS The authors of this paper wish to express their thanks to the authority of Paka Thermal Power Station, Terrengannu, Malaysia for the advice and assistance provided to the project during the collection of data. VII. REFERENCES
381
[I]
Malaysian Meteorological Service, "Annual Summery of Meteorological Observations", 1996.
[2]
Ooi Jin Bee and Chia Lin Sien, "The Climate of West Malaysia and Singapore", Oxford University Press, 1974.
[3]
Ahmad Salman Ahmad, "Study of High Voltage Insulators Performance under Adverse Environmental Conditions",-M, Sc. Eng. Thesis, Universiti Teknologi Malaysia, 1999.
[4]
C. Lozano-Sousa, R. Diaz-Acosta, and G. RamosNiembro, "Patterns of Pollution on Insulators: Clustering by Seasonal Variation and Exposure period", IEEE Transactions on Power Delivery, Vol. 5, No. 1, p. 324329, 1989.
I
[5]
382
A. El-Sulaiman and M. Iqbal Qureshi, "Effect of Contamination on the Leakage current of Inland Desert Insulators", IEEE Transactions on Electrical Insulation, Vol. 19, p. 332-339, 1984.
[6]
K. Takasu, T. Shindo, and N. Arai, "Natural Contamination Test of Insulators with DC Voltage Energization at Inland Areas", IEEE Transactions on Power Delivery, Vol. 3, p 1847-1853, 1988.
[71
Se-hyun Lee and Sang-Ok Han, "Effects of the Contamination Parameters Causing the Flashover", Proc. of Int. Conference on Electrical Engineering (ICEE '99), Hong Kong, August, Vol. 1, P. 212-215, 1999.
[81
L. L. Alston and S. Zoledziowski, "Growth of Discharges of Polluted Insulation", IEE Proce,, July, Vol. 110, p. 1260-1266, 1963.
[9]
Farouk A. M. Rizk, "Application of Dimensional Analysis to Flashover Characteristics of Polluted Insulators", IEE Proce,, Vol. 117, p, 2257-2260, 1970.