May 13, 2009 - facilities will make it possible to study very short lived exotic nuclei with extreme values of ... 5.1 Digital PSD Methods . ... PSD pulse-shape discrimination ...... License from http://en.wikipedia.org/wiki/File:Benzol trans. png.
arXiv:0905.2132v1 [physics.ins-det] 13 May 2009
Development of Neutron Detectors for the Next Generation of Radioactive Ion-Beam Facilities Licentiate Thesis P¨ar-Anders S¨oderstr¨om
Department of Physics and Astronomy, Uppsala University June 2009
Abstract The next generation of radioactive ion beam facilities, which will give experimental access to many exotic nuclei, are presently being developed. These facilities will make it possible to study very short lived exotic nuclei with extreme values of isospin far from the line of β stability. Such nuclei will be produced with very low cross sections and to study them, new detector arrays are being developed. At the SPIRAL facility in GANIL a neutron detector array, the Neutron Wall, is located. In this work the Neutron Wall has been characterized regarding neutron detection efficiency and discrimination between neutrons and γ rays. The possibility to increase the efficiency by increasing the high voltage of the photomultiplier tubes has also been studied. For SPIRAL2 a neutron detector array, NEDA, is being developed. NEDA will operate in a high γ-ray background environment which puts a high demand on the quality of discrimination between neutrons and γ rays. To increase the quality of the discrimination methods pulse-shape discrimination techniques utilizing digital electronics have been developed and evaluated regarding bit resolution and sampling frequency of the ADC. The conclusion is that an ADC with a bit resolution of 12 bits and a sampling frequency of 100 MS/s is adequate for pulse-shape discrimination of neutrons and γ rays for a neutron energy range of 0.3–12 MeV.
Supervisors:
J. Nyberg A. Ata¸c
Contents List of Acronyms
iii
List of Figures
v
1 Preface
1
2 Nuclear Structure Far From Stability 2.1 Frontiers in Nuclear Structure . . . . . 2.1.1 Light Neutron-rich Nuclei . . . 2.1.2 Heavy Proton-rich Nuclei . . . 2.1.3 Heavy Neutron-rich Nuclei . . 2.1.4 Super-heavy Nuclei . . . . . . . 2.2 Radioactive Ion Beam Facilities . . . . 2.2.1 HISPEC/DESPEC at FAIR . . 2.2.2 EXOGAM2 at GANIL . . . . .
. . . . . . . .
. . . . . . . .
. . . . . . . .
. . . . . . . .
3 Neutron Detection with Liquid Scintillators 3.1 Scintillation Process in Organic Materials . . 3.2 The BC-501A liquid scintillator . . . . . . . . 3.3 Detector Units . . . . . . . . . . . . . . . . . 3.4 Discrimination Between Neutrons and γ rays
. . . . . . . .
. . . .
. . . . . . . .
. . . .
. . . . . . . .
. . . .
. . . . . . . .
. . . .
4 The Neutron Wall 4.1 Overview of the Neutron Wall . . . . . . . . . . . . . 4.1.1 PSD Electronics . . . . . . . . . . . . . . . . 4.2 Status of the Neutron Wall . . . . . . . . . . . . . . 4.2.1 Efficiency Characteristics . . . . . . . . . . . 4.2.2 Discrimination Between Neutrons and γ rays 4.2.3 Effects of Varying the PMT High Voltages . .
. . . . . . . .
. . . .
. . . . . .
. . . . . . . .
. . . .
. . . . . .
. . . . . . . .
. . . .
. . . . . .
. . . . . . . .
. . . .
. . . . . .
. . . . . . . .
3 4 4 5 5 6 7 8 8
. . . .
11 11 14 15 16
. . . . . .
17 17 17 19 20 21 23
5 Pulse-Shape Analysis with Digital Electronics 29 5.1 Digital PSD Methods . . . . . . . . . . . . . . . . . . . . . . 29 5.1.1 Experimental Setup . . . . . . . . . . . . . . . . . . . 30 5.1.2 Figure-of-Merit . . . . . . . . . . . . . . . . . . . . . . 35 i
5.2
5.1.3 Results . . . . . . . . . . . . . . . . . . . . . . . . . . Time Resolution . . . . . . . . . . . . . . . . . . . . . . . . . 5.2.1 Results . . . . . . . . . . . . . . . . . . . . . . . . . .
36 36 39
6 The Neutron Detector Array NEDA 43 6.1 Readout . . . . . . . . . . . . . . . . . . . . . . . . . . . . . . 44 7 Summary and Outlook
47
Acknowledgements
49
References
51
ii
List of Acronyms ADC analog-to-digital converter AGATA Advanced Gamma Tracking Array APD avalanche photodiode CFD constant-fraction discriminator DESCANT Deuterated Scintillator Array for Neutron Tagging DESPEC Decay Spectroscopy DSP digital signal processor EDEN Etude des D´ecroissances par Neutrons EURISOL European Isotope Separation On-Line FAIR Facility for Antiproton and Ion Research FPGA field programmable gate array FOM figure-of-merit FRS GSI Fragment Separator FWHM full width at half maximum GANIL Grand Accelerateur National d Ions Lourds GSI Gesellschaft f¨ ur Schwerionenforschung GmbH HISPEC High-Resolution In-Flight Spectroscopy HPGe high-purity germanium HV high voltage IReS Institut de Recherches Subatomiques ISOL isotope separation on-line iii
LED light emitting diode LINAC linear accelerator LNL Laboratori Nazionali di Legnaro MS/s megasamples per second NEDA Neutron Detector Array NIM Nuclear Instrumentation Module PC personal computer PMT photomultiplier tube PSA pulse-shape analysis PSD pulse-shape discrimination QVC charge-to-voltage converter RIB radioactive ion beam SPIRAL Syst`eme de Production d’Ions Radioactifs en Ligne Super-FRS Super-conducting Fragment Separator TAC time-to-amplitude converter TNT Tracking Numerical Treatment TOF time-of-flight ZCO zero cross-over
iv
List of Figures 2.1 2.2
The Segr´e chart of nuclear isotopes . . . . . . . . . . . . . . . Identification of nuclei in the 100 Sn neighborhood . . . . . . .
4 6
3.1 3.2 3.3
Binding mechanism of benzene . . . . . . . . . . . . . . . . . Typical level scheme of an organic scintillator . . . . . . . . . Idealized pulse shapes from a BC-501 liquid scintillator from a γ ray and a neutron interaction . . . . . . . . . . . . . . . . Process of neutron detection in a liquid scintillator . . . . . . Example of a two-dimensional n-γ spectrum . . . . . . . . . .
12 13
3.4 3.5 4.1 4.2 4.3 4.4 4.5 4.6 4.7 4.8 4.9
5.1 5.2 5.3 5.4 5.5 5.6 5.7
Sketch of the Neutron Wall . . . . . . . . . . . . . . . . . . . NDE202 block diagram . . . . . . . . . . . . . . . . . . . . . NDE202 timing diagram . . . . . . . . . . . . . . . . . . . . . Distributions of photoelectrons per MeV from 1999, 2003 and 2009 . . . . . . . . . . . . . . . . . . . . . . . . . . . . . . . . Relative efficiencies of the Neutron Wall segments . . . . . . . QVC spectrum, ZCO separation and TOF separation for two typical detector segments . . . . . . . . . . . . . . . . . . . . Number of counts in the neutron peak as a function of the high voltage for detector segment number 1 . . . . . . . . . . QVC, ZCO, TOF and anode signals from detector segment 1 with low threshold and high threshold . . . . . . . . . . . . . ZCO separation of neutrons and γ rays versus QVC and FOM values as a function of QVC for different HV settings . . . . . Weighting function w(t) . . . . . . . . . . . . . . . . . . . . . Difference between the integrated rise time of a γ-ray and a neutron pulse . . . . . . . . . . . . . . . . . . . . . . . . . . . Schematic electronics block and timing diagrams of the setup The TNT USB Control graphical user interface . . . . . . . . Frequency response of the system . . . . . . . . . . . . . . . . Effects of the limited analogue bandwidth . . . . . . . . . . . TOF gated neutron and γ-ray distributions for the ZCO digital PSD based method . . . . . . . . . . . . . . . . . . . . . v
14 15 16 18 19 20 21 22 24 25 26 27 31 31 32 33 34 35 36
5.8
FOM and R for the ZCO and charge comparison based methods as a function of energy, bit resolution and sampling frequency . . . . . . . . . . . . . . . . . . . . . . . . . . . . . . . 5.9 Sampling of a Gaussian function with a time between sampling points equal to the σ of the Gaussian function . . . . . 5.10 The measured times, T , as a function of T1 and the time distributions due to the finite sampling frequency . . . . . . . 5.11 Time distributions folded with a typical Gaussian time resolution of a liquid scintillator detector plus PMT . . . . . . . . 6.1
A part of the NEDA array used as a starting point for the simulations . . . . . . . . . . . . . . . . . . . . . . . . . . . .
vi
37 38 40 41
44
Chapter 1
Preface This licentiate thesis is based on the paper Digital pulse-shape discrimination of fast neutrons and γ rays by P.-A. S¨oderstr¨om, J. Nyberg, and R. Wolters [1] (reprinted with permission from Elsevier). It concerns the detection of fast neutrons for applications in γ-ray spectroscopy of exotic nuclei using organic liquid scintillator detector arrays. Since I have an interest in the the history of science, I find the neutron very special. It took only ten years from its discovery in 1932 [2] until it in 1942 had found its application in the artificial nuclear reactor under the stands of a football stadium at the University of Chicago [3]. Physics involving fast neutrons also lies close to me since neutron induced nuclear reactions [4, 5, 6] was what got me involved in experimental nuclear physic in the first place. My impression is that there is a large gap in the level of information between the standard detector reference book by Knoll [7], which gives an introduction to the topic, and high level scientific papers. One aim of this thesis is to try to partially fill this gap in order for future students to faster get acquainted with the topic. Therefore, the layout of the thesis is to first give an introduction to the physics case in chapter 2, followed by an introduction to liquid scintillators and how these are used to detect fast neutrons in chapter 3. The Neutron Wall detector array and the results from a characterization test are presented in chapter 4, where I have contributed to the results in section 4.2. Chapter 5 concerns my work on digital pulseshape analysis and is focused on ref. [1]. Finally, in chapter 6 an outlook is given towards the next generation neutron detector array NEDA that is being developed as a part of the SPIRAL2 Preparatory Phase project, where my contribution is evaluating possible readout systems presented in section 6.1. The name NEDA comes from the Okeanid Naiad Nymph of the river Neda near Mount Lykaios in the southern Greek region Arkadia.
1
2
Chapter 2
Nuclear Structure Far From Stability Since a long time it is well known that matter is made up of atoms. The atoms in turn are composed of an atomic nucleus surrounded by a cloud of electrons. This nucleus is the subject that is studied in the field of nuclear structure physics. A nuclide is an atomic nucleus with a specific number of protons and neutrons. For lighter nuclei the number of protons and neutrons are approximately the same, while heavier nuclei consist of more neutrons than protons. The chart of nuclides, or the Segr´e chart, is a plot of the number of protons versus the number of neutrons, see fig. 2.1. As seen in the Segr´e chart, the number of stable nuclei are very few. Arranged in a bent line called the line of β stability, there are only about 250 of them. Many more nuclei can however be constructed either in laboratories on earth, or in violent astrophysical events like supernovae explosions. About 3000 elements have up to now been created and observed in laboratories, but theorists predict that more than 6000 bound nuclei can exist between the neutron and proton drip-lines, which are defined as the limits of existence. The physics of these very exotic nuclides is to a large extent unknown and history has thought us that many surprises probably await in this terra incognita. Now, just around the corner, awaits the second generation radioactive ion beam (RIB) facilities which will give the possibility to travel far into the unknown parts of the Segr´e chart. Such facilities are for example the SuperFRS at FAIR [8, 9] and SPIRAL2 [10] that will evolve into EURISOL [11]. This is sometimes referred to as the fourth revolution within nuclear spectroscopy [12]. The first revolution was the discovery of NaI(Tl) scintillator detectors, by which one could start to measure quite accurately the energy and intensity of γ-ray transitions in various radioactive nuclei. These measurements later radically improved when one started using semiconductor detectors of germanium instead of NaI(Tl) crystals. The second revolution 3
Figure 2.1: The Segr´e chart of nuclear isotopes. Nazarewicz.
Courtesy of Witek
came with the possibilities to use in-beam γ-ray spectroscopy together with heavy-ion nuclear reactions. This made it possible to study specific levels of the nuclei of interest. The latest revolution is the development of sophisticated high-resolution spectroscopy arrays of high-purity germanium, crowned by EUROBALL [13] and GAMMASPHERE [14]. These gave access to very weak signals from high-spin states, unraveling many new nuclear structure phenomena. A few frontiers in the Segr´e chart to be studied at the RIB facilities, will be briefly discussed in this chapter1 .
2.1 2.1.1
Frontiers in Nuclear Structure Light Neutron-rich Nuclei
The only area in the Segr´e chart where the neutron drip-line has been reached is the area containing the light neutron-rich nuclei. This area is also an example on how unexpected phenomena can appear when moving away from the line of β stability. The first time this area was explored was using high-energy fragmentation reactions and the results were that some 1
This is just a small selection of the physics case for the radioactive ion beam facilities and is by no means intended to be complete but rather a reflection of the authors personal favorite topics.
4
neutron-rich nuclei had abnormally large reaction cross-sections, in particular 11 Li. This was interpreted as a result of the size of these nuclei being much larger than expected. In fact, 11 Li has the same size as 208 Pb despite the much fewer number of nucleons. To understand this, a model was suggested that 11 Li actually consists of a 9 Li core surrounded by a halo of two neutrons, a picture that was confirmed by measurements of the quadrupole moment [15] and the charge radius [16] of 11 Li. With the new intense RIBs there are good opportunities for studying 11 Li and other Borromean2 halo nuclei more closely. The Neutron Wall, to be described in a later chapter, has already been used together with an isotope separation on-line (ISOL) beam to study neutron configurations in this kind of nuclei [17]. For more information see for example [18].
2.1.2
Heavy Proton-rich Nuclei
To test the nuclear shell model it is of much interest to explore the protonrich side of the line of β stability. One example of a proton rich exotic nucleus is 100 Sn, the heaviest self-conjugate doubly-magic nucleus that is expected to be bound. This itself is an interesting property but apart from this it represents a unique testing ground for various aspects of the shell model, like single-particle energies by examining the neighbors with one [19, 20] or two particles or holes outside the closed shell [21, 22]. Since the neutrons and protons occupy the same orbits there is also a good opportunity to test the effects of neutron-proton pairing. The isotope 100 Sn was discovered by two independent experiments [23, 24] but the number of events was very low in both experiments. Recently it has been shown that it is possible to produce about one 100 Sn per hour using fragmentation reactions at the FRS at GSI [25], see fig. 2.2. This rate should be dramatically increased at FAIR and also become available for fusion-evaporation reactions at the next ISOL facility SPIRAL2 at GANIL [10].
2.1.3
Heavy Neutron-rich Nuclei
While the study of exotic doubly-magic nuclei is an interesting topic there are also so-called doubly mid-shell nuclei which are even more rare. Only four even-even doubly mid-shell nuclei are expected to be particle bound: 28 Si, 38 Si, 48 Cr and 170 Dy. Analogous to 100 Sn being a unique testing ground for the shell model, 170 Dy should also be a unique for testing of the evolution of collectivity. Due 2 This name comes from the Borromean family crest which is made of three rings intwined such that if one is removed the entire system falls apart. In the same way the Borromean halo nuclei consist of a nucleus and a halo of two neutrons, while neither system of the specific nucleus and one neutron halo nor the system of two neutrons are bound.
5
Figure 2.2: Identification of nuclei in the 100 Sn neighborhood using fragmentation of 124 Xe at GSI. Figure from [25]. to its doubly mid-shell nature one can naively assume it to be the most collective of all nuclei. Calculations also suggest a stiff prolate axially symmetric shape [26], something that makes it interesting in terms of how stiffness of quadrupole deformation would delay backbending, a phenomenon that was first observed in 160 Dy [27]. Nuclei in this area are further known to have states with large single-particle angular momentum components along the symmetry axis, K, that decay to the ground state band with K = 0 [28]. This gives rise to long-lived isomeric states and 170 Dy is a promising candidate to have a very pure high-K isomer [26]. It is also the best candidate in the entire Segr´e chart for empirical realization of the dynamical SU(3) symmetry in the interacting boson model [29, 30]. This is an area that is very difficult to reach using today’s facilities. The most successful attempt so far is using multi-nucleon transfer reactions [31]. With future RIB facilities, the accessibility is expected to increase dramatically.
2.1.4
Super-heavy Nuclei
Besides testing how far one can reach on the proton- and neutron-rich sides of the Segr´e chart, it is also of much interest to see how far one can follow the β-stability line to produce as heavy elements as possible. This is not only of interest from a nuclear physics point of view, but also because this means 6
that one would produce completely new chemical elements. Looking at fig. 2.1 it seems there is not much beyond uranium and the actinides to study. However, it is suggested that there should exist additional higher magic numbers than those shown in fig. 2.1. According to theoretical predictions these new magic numbers would be N = 184 and Z = 114 or Z = 126, which could cause an “Island of Stability” with long-lived elements to appear. For further details regarding the discovery of super-heavy elements see [32] and references therein. One of the problems with the creation of super-heavy elements produced in fusion-evaporation reactions with stable beams is that one cannot reach the N = 184 shell gap. Instead, it is suggested to use intense radioactive neutron-rich beams, which may dramatically increase some of the cross sections for production of super-heavy elements [33].
2.2
Radioactive Ion Beam Facilities
To create RIBs, there are two techniques that are in principle complementary to each other: the in-flight fragmentation and the ISOL technique. In the in-flight fragmentation technique, a heavy-ion beam is accelerated to high energies, typically to about 50% of the speed of light. The heavy-ion beam is chosen to be either close to the desired isotope or a fissile isotope like uranium. To produce the RIB, one lets the primary heavy ion beam hit a light target like beryllium after which it will either fragment or fission into a cocktail of reaction products. The reaction products are then separated by a system of dipole magnets, quadrupole magnets and energy degraders. This technique is implemented at, for example, the FRS at GSI [34]. Using this technique one can produce exotic nuclides at relativistic energies which are limited only by the reaction cross-section and the flight time through the magnetic spectrometer, which is typically in the order of 100 ns. The other method is the ISOL technique, which to a large extent is the complete opposite to the in-flight fragmentation method. In an ISOL facility one typically uses a high-intensity proton, neutron, deuteron or even electron beam on a heavy target, for example UCx . The energy of the beam only has be high enough to give a high fission yield in the target, in which the fission fragments are completely stopped and neutralized. The fission fragments are extracted from the target chemically through diffusion and effusion into an ion source that ionizes the fragments. A post accelerator is then used to accelerate them to the desired energies. The limitations of this method is mainly due to the chemical extraction properties of the desired beam which can vary largely between different elements. See [35] for more details regarding the ISOL technique. 7
2.2.1
HISPEC/DESPEC at FAIR
The next generation of in-flight fragmentation RIB facility that will be built is the Super-FRS [8] at FAIR. The Super-FRS will consist of two achromatic degrader systems and superconducting magnets. It will also separate fission fragments, something that the current FRS can not do. Two of the experimental setups that will be coupled to the Super-FRS are HISPEC [36] and DESPEC [37]. HISPEC is a detector system for in-flight spectroscopy of reactions using RIBs. With this setup one can perform γ-ray, charged particle and neutron spectroscopic measurements using Coulomb excitation and fragmentation reactions. High-resolution high-purity germanium (HPGe) detector arrays, one of which will be the AGATA spectrometer [38, 39, 40], will be used together with a particle identification system after the secondary target. The other experimental setup, which will be placed further down the same beam line as HISPEC, is DESPEC. DESPEC will be a setup for studying the decay properties of exotic nuclei. This will be done by using a highly pixellated implantation detector to stop the high energy RIB, a dedicated high resolution HPGe detector array and a high-efficiency neutron detector array. The plan is to design this neutron detector using the liquid scintillator BC501A and to identify the particle and measure its energy using a combination of pulse-shape analysis (PSA) in the neutron detector and time-of-flight (TOF) between the implantation and the neutron detectors.
2.2.2
EXOGAM2 at GANIL
The next generation ISOL RIB facility is planned to be EURISOL. Since EURISOL is further in the future than FAIR, there is an intermediategeneration facility planned at GANIL, called SPIRAL2. The SPIRAL2 facility will be based on a high power superconducting driver linear accelerator (LINAC) that will deliver a 40 MeV deuteron beam with a beam current of 5 mA. This beam will be directed on a UCx target that produces the isotopes for the secondary beam. The driver LINAC will also be able to produce very intense stable beams to be used either directly in experiments or for creation of proton-rich RIBs via fusion-evaporation reactions. For this new facility the existing HPGe array at GANIL, EXOGAM [41], will be upgraded to EXOGAM2. EXOGAM2 will use digital electronics and be able to run in triggerless mode and it may be used together with AGATA. In the SPIRAL2 preparatory phase work package 5, there is a specific task (task 5.8) to construct a neutron detector array to be used together with EXOGAM2. Below is a quotation from an internal document within task 5.8 about the requirements of this neutron detector array, NEDA: The Neutron Detector will be built as an ancillary detector for a germanium array installed at the intense stable and radioac8
tive ion beams from SPIRAL2. The Neutron Detector should be characterized by the highest possible neutron detection efficiency, excellent discrimination of neutrons and gamma rays, and a very small neutron-scattering probability. These properties are necessary in order to achieve a clean and efficient identification of gamma rays from the rare neutron-deficient nuclides produced in reactions in which only two or more neutrons are emitted. This licentiate thesis concerns the development of electronics and readout for NEDA.
9
10
Chapter 3
Neutron Detection with Liquid Scintillators Due to their uncharged nature, detection of neutrons is much more difficult than detection of charged particles. Yet, there are a variety of ways to detect fast neutrons. Some examples are to use elastic scattering off protons in a scintillator, charged particle reactions on 3 He in ionization chambers, radiative capture on gadolinium, fission of a uranium foil on a silicon wafer. For more possible detection methods see ref. [7]. This chapter presents an introduction to liquid scintillators and how these are used to detect fast neutrons. The fast-neutron detection method focused on here is to use liquid organic scintillators. This type of scintillator mainly consist of aromatic carbohydrates, with small admixtures of other molecules. The neutrons are detected mainly due to elastic scattering with protons.
3.1
Scintillation Process in Organic Materials
In aromatic carbohydrates there are two types of chemical covalent bonds that are important, the σ bond and the π bond. A carbon atom ready for binding will have an electron configuration of 1s2 2s2p3 , meaning one valence electron in an s orbital and three valence electrons in p orbitals. Since the s electron orbital is spherically symmetric it will always form axially symmetric σ bonds while the p electron orbitals (orbitals with two lobes) can form either axially symmetric σ bonds or mirror symmetric π bonds. The σ bonds are the normal regular tetrahedron bonds of carbon and they do not contribute to the luminescence of the liquid, whereas the π bonds cause double and triple bonds and are responsible for the luminescence. In the aromatic carbohydrates there are several of these p orbitals that make up a delocalized π system that can be modeled as free electrons orbiting the molecule. See fig. 3.1 for an example of the benzene molecule binding and refs. [42, 43] for more details on the structure of organic molecules. 11
Figure 3.1: Binding mechanism of benzene [44]. From the free electron model of the π electrons (p electrons in a delocalized π system) moving in a one-dimensional circle, the π electron will have a certain ground state and a number of excited singlet states (see fig. 3.2). These excited states will have an increasing excitation energy up to the ionization energy Iπ , corresponding to different modes of the wave function. These states are usually denoted S0 for the ground state and S1 , S2 , . . . for the excited states. The molecule can also be excited into triplet states denoted T1 , T2 , . . . that are usually lower in energy than their singlet counterparts. These states are further divided into vibrational sub-states as S00 , S01 , . . . , S10 , S11 , . . . and T10 , T11 , . . . , T20 , T21 , . . .. This kind of structure gives rise to three types of light that can be produced in the liquid scintillator: fluorescence, phosphorescence and delayed fluorescence1 . The fastest of these processes is the fluorescence where the molecule de-excites through a series of S states. The fluorescent light will only occur from transitions of type S10 → S0x and has a lifetime of ∼ 1–10 ns. The molecule can also undergo a non-radiative transition from the S1 state to some metastable state M , which in some cases been has identified as T1 [45], but could be any metastable state. From M the molecule can de-excite to S0 emitting a phosphorescence photon with a different energy than the fluorescence light and a lifetime & 100 µs. Another possible decay path from M is that the molecule is thermally excited back to S1 which then de-excites to S0 emitting delayed fluorescence with an increased lifetime of ∼ 1 µs. In this work the main interest is in the fluorescence. 1
This is the standard terminology. For the rest of the text the mention of scintillation light, fast component and slow component will refer to the fluorescence and its time structure if not explicitly stated otherwise.
12
Figure 3.2: Typical level scheme of an organic scintillator. Figure from [43]. In some scintillators the fluorescence shows a time structure that is not described by a simple exponential decay, but which rather is a superposition of several exponential decay components with different decay time constants. All these components show the same spectrum as the fluorescence, that is the S10 → S0x transition. It has also been observed that the slower component is largely unaffected by the decrease in fluorescence intensity, quenching, when particles with different ionization and excitation density are detected [46]. It has been proposed that the slower component is due to the interaction of two triplet-excited molecules that produce a transient dimer (two similar but separate molecules which are held together by intramolecular or intermolecular forces) which subsequently decomposes to give a molecule in the S1 excited state and a molecule in the S0 ground state [7]. That quenching does not significantly effect the slow florescence component is the cause of the pulse-shape difference for different particle species, see fig. 3.3. This means that although an α particle interaction gives rise to a relatively larger slow component than an electron interaction, the total number of photoelectrons are not necessarily larger for the α particle. The relative intensity of the slow component for different particle species was first measured by Owen [48]2 . Refined measurements were made by Gibbons et al. [50], which are shown as an example in table 3.1. 2
This is often erroneously cited as [49]. This is a misunderstanding that probably origins from ref. [43] where the correct citation is used and these two references are de-
13
Amplitude [a.u.]
1
γ -ray neutron
10-1
10-2
2000
2100
2200
2300
2400
2500
2600 Time [ns]
Figure 3.3: Idealized pulse shapes from a BC501 liquid scintillator from a γ-ray and a neutron interaction. The decay times are 3.16 ns, 32.3 ns and 270 ns. Figure from [47]. Table 3.1: Dependence of tail emission in anthracene on the species of exciting particle. Adapted from ref. [50]. Rel. intensity Tail emission Delayed photons (main pulse) (% of main pulse) per MeV 5 MeV α particle 1 20 350 5 MeV neutron 4 14 980 1.1 MeV γ ray 10 3.5 610
3.2
The BC-501A liquid scintillator
One very popular liquid scintillator for neutron detection is BC-501A3 . This is a scintillator liquid based on xylene or dimethylbenzene, C6 H4 (CH3 )2 . Xylene is flammable with a flash point (the temperature where it can form an ignitable mixture in air) of 24 degrees and poisonous since it can cause neurological damage at high exposures. The liquid BC-501A has a light output that is about 78% of anthracene, a maximum emission wavelength of 425 nm and a hydrogen to carbon ratio of 1.287. It has three decay components with 3.16 ns, 32.3 ns and 270 ns decay times [51]. The 270 ns component is mainly responsible for the pulse-shape discrimination (PSD) properties. noted Owen 1959a and Owen 1959b respectively. Ref. [49], or Owen 1959b, however only concerns the observation of the slow scintillation component and not a measurement of it. 3 In older detector arrays a similar liquid called BC-501 was used. These are manufactured by Saint-Gobain Ceramics & Plastics. There is also an equivalent liquid from Nuclear Enterprise known as NE-213
14
Figure 3.4: Process of neutron detection in a liquid scintillator. Reprinted from [52] with permission from Elsevier.
3.3
Detector Units
Beside the liquid, a neutron detector unit also consists of a photomultiplier tube (PMT) for readout. See fig. 3.4 for an illustration of a typical neutron detector unit. A PMT is a read out device that consist of a photocathode from which the incoming scintillation photons emits photoelectrons through the photo-electric effect. These photoelectrons are then accelerated in a high voltage (HV) electric field towards a dynode, at which several more electrons are emitted. This process is repeated a number of times and the resulting electric current is read out from the anode at the end of the PMT. The PMT is coupled to the scintillator via a light guide, for example a glass window. Sometimes a light emitting diode (LED) is also included in the detector unit for testing purposes. For nuclear physics experiments this kind of detector units are usually organized into large arrays of different shapes and sizes, see refs. [53, 54, 55, 56, 57] for a small selection of examples. One important property of a liquid scintillator detector is the ability to discriminate between the detection of γ rays and neutrons. This is not only important in order to get a clean neutron signal, but it has also been shown that even a small amount of γ rays misinterpreted as neutrons dramatically reduce the quality of the cross-talk rejection [58]. 15
Figure 3.5: Example of a two-dimensional n-γ spectrum with the time-offlight spectrum on the y axis and the zero cross-over spectrum on the x axis, obtained from the data in [1]. The upper left distribution is the neutron peak and the lower right distribution is the γ-ray peak. The vertical and horizontal γ-ray distributions are random coincidences and pile-up events, respectively.
3.4
Discrimination Between Neutrons and γ rays
Several different PSA methods are used for discriminating between neutrons and γ rays. Two well known methods are the zero cross-over (ZCO) method, where the signal is shaped into a bipolar pulse from which the zero crossing is extracted [59, 60], and the charge comparison method, where the charge in the fast component is integrated and compared to the charge in the slow component [61]. Both these methods give a cleaner separation for highenergy neutrons compared to low-energy neutrons since the statistics in the slow component of the pulse is higher for high-energy interactions. Another independent method to discriminate against different interacting particles is by measuring the TOF between a global trigger and the interaction time of the signal in the detector. Since γ rays travel with the speed of light, c, while the neutrons have a finite velocity, v < c, the γ rays will end up in a narrow peak in a TOF spectrum while the neutrons will give rise to a distribution which depends on the neutron energy distribution. Since high-energy neutrons have a velocity closer to c than low energy neutrons this discrimination technique works best for low-energy neutrons. Due to the independent and complementary nature of these discrimination techniques both of them are usually used together and the selection of neutrons is made in a two-dimensional spectrum, see fig. 3.5.
16
Chapter 4
The Neutron Wall The Neutron Wall detector array is presented together with the results from a characterization test performed in 2009 (section 4.2) in this chapter .
4.1
Overview of the Neutron Wall
An existing and so far very successful, neutron detector array for use in nuclear structure experiments is the Neutron Wall [56]. The Neutron Wall was originally designed for experiments together with EUROBALL [13] at LNL and IReS Strasbourg, but since 2005 it is located at GANIL where it is used together with EXOGAM [41]. It consists of 15 hexagonal detectors of two different shapes and one pentagonal detector. The detectors are assembled into a closely packed array covering about 1π of the solid angle. They are filled with the liquid scintillator BC-501A to a total volume of 150 litre. The 16 detectors are in turn divided into 50 segments as shown in fig. 4.1. The hexagonal detectors are subdivided into three individual segments. Each of the segments contain 3.23 litre of scintillation liquid and is read out by a 130 mm Philips XP4512PA PMT. The pentagonal detector is subdivided into five individual segments of 1.07 litre each and is read out by a 75 mm Philips XP4312B PMTs. The PMTs cover an average of 47% and 50% of the exit face of the hexagonal and pentagonal detectors, respectively. The total neutron efficiency of the Neutron Wall is about 25% in symmetrical fusion-evaporation reactions.
4.1.1
PSD Electronics
The PSD in the Neutron Wall is done by NIM electronic units of the type NDE202 [62] based on the ZCO discrimination technique. A block scheme of the NDE202 PSD unit is shown in fig. 4.2. Several different outputs are available from the NDE202; for a complete description see ref. [63]. In this work the most interesting outputs are the charge-to-voltage converter (QVC) 17
NEUTRON WALL viewed from outside of the array downstream of the target position F
1
1
2
B
C
A
27
E
C
D
9343
6093
5967
47
B F
P
9
48 C
A
E
6030
A
3
40 9306
D
B F
11
C D
F
D C
31
E
13
13
15
1
Detektor number, type H1
11
Detektor number, type H2
9320
14
B
C D
D C
E 30
F B
17
E
9313
4 16 9340
F
9294
9341
E
18 9345
9286
9304 9289
14
9288
9
41 9295
A
32
42
12
9328
19 9338
C D
29
C
E
B
9330
10
B F
E
F
A
A
9301
9307
49
9285
20
9319
9284
8
E
D C
33
43
D
21
5
44
A
9293
9342
A
B
35 9300
P
B
5977
39
E
F B
45
F
22 9349
10
46 B
9327
9337
F
E D
9323
0603
28
12 A
35 9299
C D C
A
9290
C 8
36 9339
A 38
9314
34
A
7
D
B
B
9324
9350
9334
E
6
37
D
E
23
9352
E
C
B
15
25
E
7
24 9300
9321
C
F
2
F
D
26
9346
A
F
C D
9305
5
6
D
11
B F
9333
9335
9303
9318
A
B
0
9351
3
4
A
9312
E
A
Blue box: segment number Yellow box: PM tube number
Pentagon Johan Nyberg, 2009−01−24
Figure 4.1: Sketch of the Neutron Wall with the numbering of detectors, segment and PMTs.
18
Figure 4.2: NDE202 block diagram of one channel. Figure from [63]. and the ZCO illustrated in fig. 4.3. The time-to-amplitude converter (TAC) signal between the trigger and the NDE202 constant-fraction discriminator (CFD) is also an important output for TOF measurements. The signal from the PMT anode is first split into a QVC for energy measurements, a CFD for timing and a shaping amplifier for the ZCO discrimination, see section 3.4. The QVC, amplifier and CFD signals are available at the front panel and the CFD is used for the ZCO discrimination. The output of the ZCO block is both sent to an internal TAC and to the front panel to optionally be used with an external TAC.
4.2
Status of the Neutron Wall
In preparation of future experiments with the Neutron Wall [64, 65] the status of the Neutron Wall was checked in the beginning of 2009. In all measurements the same NDE202 unit (serial number 15) was used. Two important performance properties of the Neutron Wall is the detection efficiency and the quality of the separation between neutrons and γ rays. A high efficiency is important in order to identify as many events as possible with one or several neutrons emitted. A good separation of neutrons and γ rays is important in order to identify weak neutron-evaporation reaction 19
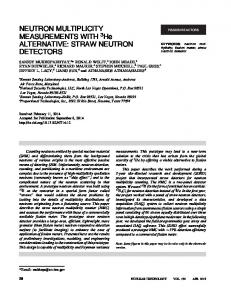
Figure 4.3: NDE202 timing diagram. Partial figure from [63]. channels. A property of the detector that is fundamental for both of these parameters is the number of photoelectrons that are generated per MeV of deposited energy. A high number of photoelectrons per MeV is important both to record low-energy neutron signals and to get good statistics in the slow component of the pulse for PSD of neutrons and γ rays. The number of photoelectrons per MeV was measured using the ratio between the Compton edge of 137 Cs and the single photoelectron peak, as described in ref. [66]. The result is shown in fig. 4.4. As seen in fig. 4.4, the number of photoelectrons per MeV decreased substantially compared to 1999. The decrease occurred after a complete repair of the detectors in 2003. The reason for the large decrease of the number of photoelectrons per MeV after the repair is not understood. In 2005 the array was moved from IReS Strasbourg to GANIL. Segments 33 and 44 have shown a very low number of photoelectrons per MeV both in 2003 and in 2009. Assuming Gaussian distributions the average number of photoelectrons per MeV was 1280 ± 50 in 1999, 743 ± 25 in 2003 and 597 ± 21 in 2009. The average number of photoelectrons per MeV has decreased by 42 ± 5% and 20 ± 4% between 1999 and 2003 and between 2003 and 2009, respectively.
4.2.1
Efficiency Characteristics
One of the problems with the Neutron Wall setup at GANIL is that the efficiencies of the outermost detector segments 1, 6, 11 and 16 sometimes have dropped radically. The reason for this is still unknown, but it is believed to origin from shadowing either by the supporting structures or by the beam pipe. In fig. 4.5 two examples of the shadowing effect are shown. One 20
No. of segments
14 12 10 8 6 4 2 0 0
200
400
600
800 1000 1200 Photoelectrons/MeV
1400
1600
1800
2000
Figure 4.4: Distributions of photoelectrons per MeV from 1999 (dotted) as reported in [56], 2003 after the repair (short dashed) as reported in [66] and 2009 (solid).
of the examples is EXOGAM in its normal configuration with DIAMANT [67] and Neutron Wall as ancillary detectors (experiment E505). Using this setup the efficiency of the shadowed detectors has dropped to 20–40%. The other example is experiment E528, using a setup with the Neutron Wall, EDEN [54], and silicon charged particle detectors. The same detectors are still shadowed but this time the efficiency drops only to 50–70%. The loss in efficiency due to the shadowing is about the same for neutrons and γ rays which means that the material must be about equally good at stopping both of these particle species. To test whether this actually was an intrinsic problem with the Neutron Wall or a problem with shadowing from other surrounding material the relative efficiency for the segments were measured using only a 252 Cf source and the Neutron Wall with no surrounding material. The results from this measurement is also shown in fig. 4.5 and the relative efficiency variance is only ∼ 9% with no decrease in efficiency for the outermost segments. The conclusion is that the drop in efficiency is not an intrinsic problem with the Neutron Wall but that the problem is in the surrounding structures.
4.2.2
Discrimination Between Neutrons and γ rays
As expected, the quality of the separation between neutrons and γ rays show the same trend as the number of photoelectrons per MeV for the detectors. All detector segments except number 33 and number 44 show a qualitatively similar separation both for TOF and ZCO. Quantitatively a 21
Relative neutron efficiency 180 160 Efficiency (%)
140 120 100 80 60
2009 E505 E528
40 20 0 0
5 10 15 20 25 30 35 40 45 50 Segment number
Figure 4.5: Relative efficiencies of the Neutron Wall segments (top) from the 252 Cf source tests in 2009, the EXOGAM + DIAMANT + Neutron Wall experiment E505 in 2006 and the SiCD + SiLi + EDEN + Neutron Wall experiment E528 in 2006. The E505 data is taken using the 36 Ar + 40 Ca/16 O fusion-evaporation reaction and the E528 data is taken using the 12 C + 58 Ni fusion-evaporation reaction. Drawings of the segments with a relative efficiency less than 80% in black are also shown for the two experiments (bottom).
22
figure-of-merit (FOM) defined as [68] FOM =
|Xγ − Xn | . Wγ + Wn
(4.1)
gives FOM ≈ 1 for the good segments and FOM ≈ 0.5 for the bad segments [69]. This FOM is a unit-less ratio of the difference between the peak positions Xi divided by the sum of their full width at half maximum (FWHM), Wi (i = γ, n). An increased value of the FOM corresponds to a better discrimination between neutrons and γ rays. In fig. 4.6 the separation between neutrons and γ rays are shown for two detector segments: number 1 and number 33.
4.2.3
Effects of Varying the PMT High Voltages
The HV values of the Neutron Wall PMTs are set to values below their design values. The PMTs in the hexagonal detectors are designed for a maximum HV of −2700 V, the PMTs in the pentagonal detectors for a HV of −3300 V while in the Neutron Wall the HV values are set to an average of −1390 V and −2160 V, respectively. The reason for this is a problem with the dynamic range of the ZCO system of the NDE202 units. The quality of the ZCO PSD becomes worse when higher voltage is used. Many interactions in the detectors, however, lead to low kinetic energy transfer. A detection of more of such low-energy neutron interactions would lead to a gain in efficiency. Therefore, one would preferably like to use a higher voltage for the PMTs as shown in fig. 4.7. To keep as many low-energy neutron interactions as possible and to compensate for the lower HV and thus smaller signals one has to set the threshold of the CFD lower. There is however a problem with using too low threshold in the NDE202, since this causes the signals from the QVC and ZCO to oscillate in a strange way as shown in fig. 4.8. Thus, there is two main objectives for increasing the HV of the PMT: to increase the efficiency and to be able to use CFD thresholds that have some margin to the lower limit of operation. To study the effect of an increasing HV on the PSD quality, data sets were taken for segment 33 using three different HV settings: 1320 V, 1420 V and 1520 V. The results of these measurements are shown in fig. 4.9. The ZCO, QVC and TOF data was stored on an event-by-event basis and the FOM was calculated for each HV setting and for ten different ranges of the QVC that were selected to contain 1/10 of the events in each the data set. When comparing the FOM, the QVCs were calibrated relative to each other using two measurements of the 137 Cs Compton edge with HV settings of 1520 V and 1670 V. Assuming an exponential gain, a fit of the form x
y = a2 b 23
(4.2)
Segment 01
Segment 33 1000
800
800 Counts
Counts
1000
600
600
400
400
200 1000
2000 3000 QVC (a.u.)
γ
103
Counts
00
4000
10
γ
10
10
1
1 500
1000 1500 ZCO (a.u.)
2000
0
500
1000 1500 ZCO (a.u.)
2
10
10
n
Counts
Counts
2000
γ
γ 2
10
n 10
1
1 0
4000
2
10
0
2000 3000 QVC (a.u.)
n
n
2
1000
103
Counts
00
200
500
1000 1500 TOF (a.u.)
0
2000
500
1000 1500 TOF (a.u.)
2000
Figure 4.6: QVC spectrum measured by a 137 Cs source (top), ZCO (middle) and TOF spectrum (bottom) measured by a 252 Cf source for a typical detector segment which shows good performance (left) and one which shows bad performance (right). The time reference of the TOF measurement was obtained using a 2 × 2 inch BaF2 detector [69]. The sharp peaks on the right hand side of the ZCO spectrum for segment 33 are due to triggering on noise in the NDE202 unit. 24
3500
Neutron counts
3000 2500 2000 1500 1000 500 0 1200 1300 1400 1500 1600 1700 1800 1900 2000 2100 High Voltage (V) Figure 4.7: Number of counts in the neutron peak as a function of the high voltage for detector segment number 1. The increase in relative efficiency is about 60%.
25
1
2 t (µs)3
4
ZCO
-5000 -6000 -7000 1
2 t (µs)3
4
-5000 0
1
2 t (µs)3
4
5 TOF
-8000 0
1
2 t (µs)3
4
5
1
2t (µs)3
4
5 ZCO
-6000 1
2t (µs)3
4
5 QVC
0 -5000 0
-6000
Anode
-4000
0
5 QVC
0
High threshold
5000 0 -5000 0
5 Channels
6000 0
Channels
Channels
Channels
7000
0
Channels
Anode
Channels
Channels Channels
Low threshold
1
2t (µs)3
4
5 TOF
-6000 -8000 0
1
2t (µs)3
4
5
Figure 4.8: QVC, ZCO, TOF and anode signals from detector segment 1 with low threshold (left) and high threshold (right). This data was taken by using a TNT2 module. The lower part of the figure, showing the setup of the measurement, is from ref. [69].
26
Figure 4.9: ZCO separation of neutrons and γ rays versus QVC (top) and FOM values as a function of QVC (bottom) for different HV settings. The QVC values of the FOM for the 1320 V and 1420 V data were calibrated to correspond to the same deposited energy as in the 1520 V data. was obtained with y being the QVC in channel numbers, a the normalization, x corresponding to the voltage and b = 158 obtained from the fitted value of the HV to double the gain from the PMT. The three FOM curves in fig. 4.9 look roughly similar and one can conclude that the decrease in separation quality between neutrons and γ rays in the one-dimensional projections mainly seem to be due to more low-energy neutron interactions. The FOM is even better at fixed calibrated QVC for higher HV. Thus one should be able to increase the efficiency of the Neutron Wall by increasing the HV of the PMTs if the ZCO is used together with the QVC and TOF in the discrimination procedure between neutrons and γ rays.
27
28
Chapter 5
Pulse-Shape Analysis with Digital Electronics For the development of the next generation of neutron detector arrays one should take advantage of digital electronics. Until now, the PSD of neutrons and γ rays has been made by utilizing analogue electronic methods [59, 60, 61]. With the fast development of digital electronics one is no longer limited to using only analogue components. The term digital electronics means, in this context, that the detector signal is digitized with a fast sampling analogto-digital converter (ADC) and then processed using a programmable device like a digital signal processor (DSP), field programmable gate array (FPGA) or even a personal computer (PC). This means that one can use much more sophisticated PSA algorithms than with analogue electronics. But digital PSA also has limitations regarding, for example, computing time and signal reconstruction. This chapter is based on ref. [1] and concerns the influence of the bit resolution and sampling frequency of the ADC on the PSD. The experiment and results of the PSD of neutrons and γ rays is described in section 5.1 and the effects of the sampling frequency on the time resolution is presented in section 5.2.
5.1
Digital PSD Methods
Several sophisticated methods for digital PSD have been developed by various research groups lately. One of these methods uses a previously measured standard pulse shape from the detector. By defining a correlation function of a sample pulse shape and the standard pulse shape one can discriminate between neutrons and γ rays [70]. Another method that uses standard pulse shapes has also been developed and is being implemented in a FPGA [71, 72]. In this method the measured pulse shape is fitted with “true” neutron and γ-ray pulse-shapes and the χ2 values of these fits are compared. A third method that has been developed for digital electronics is the pulse gra29
dient method [73, 74]. In this method two sampling points from the tail of the pulse are selected and the slope between these two points is calculated. All these methods have yielded good results regarding the discrimination of neutrons and γ rays. In ref. [1] two methods, as described below, have been developed to perform digital PSD and to study the effects of the ADC bit resolution and sampling frequency on the PSD quality. These methods were developed to be numerically simple, such that the limitations from computing time should be not too large. They were also selected due to their similarity with well studied analogue methods. Charge Comparison In the charge comparison method two integration gates are set on the fast and slow decay components of the pulse. By comparing these integrals with each other one will get a separation between neutrons and γ rays. Using digital electronics this method can be generalized to concern evaluating the integral Z S=
T
p(t)w(t)dt,
(5.1)
0
where T is the time to evaluate the pulse p(t), w(t) is a weighting function and S is a quantity that differs between neutrons and γ rays. To enhance the PSD maximally, the best choice of w(t) has been shown [75] to be w(t) =
n ¯ (t) − γ¯ (t) , n ¯ (t) + γ¯ (t)
(5.2)
where n ¯ (t) and γ¯ (t) are the average neutron and γ-ray pulse shapes, respectively. See fig. 5.1 for an example of how w(t) looks like for the experiment in ref. [1]. Zero Cross-over The other analogue method that has been adapted digitally is the ZCO method. The ZCO method is described in sections 3.4 and 4.1.1. Integrating the pulse and taking the rise time of the integrated pulse has been shown to be equivalent to shaping and taking the zerocrossing time [76]. In fig. 5.2 the principle of the integrated rise-time method is shown. It was found that for the setup in ref. [1] the best result was obtained by using the 10–72% rise time.
5.1.1
Experimental Setup
To test the digital PSD methods, an experiment was carried out using a 252 Cf source, a liquid scintillator detector from the NORDBALL neutron detector array [53], a BaF2 detector and a TNT2 sampling ADC system 30
Amplitude [A.U.]
1
10-1
10-2
0
50
100
150
200
250
300
350
400 450 Time [ns]
Figure 5.1: Weighting function w(t) for digital (solid) and analogue (dashed) charge comparison PSD shown together with an average neutron pulse (short-dashed). Reprinted from [1] with permission from Elsevier.
Integral (a.u.)
8
6
4
2
00
50
100 Time (ns)
150
200
Figure 5.2: Difference between the integrated rise time of a γ-ray (dashed) and a neutron (solid) pulse. The points at 10 % and 72 % of the pulse height are indicated by long-dashed lines.
31
Figure 5.3: Schematic electronics block and timing diagrams of the setup used in this work. The delay units consist of coaxial cables of type RG58 (delays > 10 ns) or RG174. The signals shown in the timing diagram correspond to the detection of prompt γ rays in the two detectors. 1) 300 MS/s and 2) 200 MS/s setup. Reprinted from [1] with permission from Elsevier.
32
Figure 5.4: The TNT USB Control graphical user interface and the settings used in the 300 MS/s experiment.
running at 300 megasamples per second (MS/s) and 14 bits [77]. See fig. 5.3 for a drawing of the setup and ref. [1] for a detailed description. The TNT2 is a single width NIM unit with four independent channels. Each channel has a 14 bit and 100 MS/s flash ADC and an analogue bandwidth of 40 MHz. The TNT2 is set up, controlled and read out through a Java graphical user interface by a Linux PC via a USB 2.0 interface, see fig. 5.4. To increase the sampling frequency of the readout, three channels of the TNT2 were connected in parallel. With this technique it was possible to increase the sampling frequency from 100 MS/s to 300 MS/s. This technique does not, however, increase the analogue bandwidth of the setup. To study the effects of this the frequency response of the system was measured, see fig. 5.5. The frequency response measurements was carried out by using an Agilent function generator of model 33250A. A sine function of a fixed amplitude was used as an input, Ain , and the output amplitude, Aout , was measured in the range 1–80 MHz. Above 80 MHz the frequency response 33
Amplitude (a.u)
1200 1000 800 600 400 200 0 0
20
40
60
80 100 120 Frequency (MHz)
140
160
180
200
Figure 5.5: Frequency response of the system measured up to 80 MHz (crosses) together with the fitted (solid) and extrapolated (dashed) low-pass filter functions.
was extrapolated using a fit of a general low pass filter function a0 Aout (f ) = r � �a1 , 1 + ff0
(5.3)
with f the frequency, a0 a free scaling parameter, a1 = 2.27 the fitted value of the filter order and f0 = 35.7 MHz the fitted cut-off frequency. The effect of the analogue bandwidth was examined by doing a discrete Fourier transform, correcting for the frequency response and transforming back to the time domain. The result of this test is shown in fig. 5.6 and the effect of the limited analogue bandwidth was judged to be small enough in order not to to contribute significantly to the final results. Data sets were collected for two different setups, one setup with 300 MS/s and one setup with 200 MS/s and an analogue PSD unit of the type NDE202, described in section 4.1.1. To evaluate the performance of the PSD methods for different properties of the ADC the 300 MS/s data set was reduced regarding bit resolution and sampling frequency to several other data sets. For the bit resolution an integer division by 214−b of the value of each sampling point value, where b is the number of bits in the new data set, was used. For the sampling frequency a number of data points were removed, resulting in new data sets corresponding to sampling frequencies of 150 MS/s, 100 MS/s, 75 MS/s, 60 MS/s and 50 MS/s. 34
Amplitude [a.u.]
104
3
10
2
10
0
0.05
0.1
0.15
0.2
0.25
0.3 Time [µs]
Figure 5.6: Effects of the limited analogue bandwidth. A typical measured pulse shape (solid histogram) and the corresponding undistorted pulse shape after correcting for the finite analogue bandwidth (dashed histogram) are shown. To remove artifacts due to the finite size of the discrete Fourier transform, the histograms are smoothed twice using the 353QH algorithm [78]. Reprinted from [1] with permission from Elsevier.
5.1.2
Figure-of-Merit
To quantify the results the FOM in eq. 4.1 was used. However, this FOM has a few drawbacks. One drawback is that it only takes the peak positions and widths in account but not the background under the distributions. As seen in fig. 3.5 there are events originating from pile-up of several closely spaced events and random γ rays that, when projected to a one-dimensional distribution, will make up a continuous background. The FOM in eq. 4.1 also assumes Gaussian, or at least symmetric, distributions. If the distributions are not Gaussian or symmetric the FOM value can be very misleading as shown in fig. 5.7. The third drawback of FOM in eq. 4.1 is that it only works for one-dimensional distributions while, as mentioned in section 3.4, in real experiments two-dimensional selection criteria are mostly used. To complement the FOM a parameter, R, was defined as
R=
Nb , Nn − Nb
(5.4)
based on the estimated number of γ-ray background counts, Nb , relative to the number of neutron counts, Nn , in the neutron peak. See ref. [1] for details on how to calculate R. 35
30000
300 MS/s
FOM = 1.09
15000
50 MS/s
FOM = 0.758
10000
counts
counts
20000
5000
10000
0
1
2
3
4 5 ZCO (a.u.)
6
7
0
8
2
4
6 8 ZCO (a.u.)
10
12
Figure 5.7: TOF gated neutron (dashed) and γ-ray (solid) distributions for the ZCO based digital PSD method and sampling frequencies 300 MS/s and 50 MS/s.
5.1.3
Results
The results from the digital PSD are shown in fig. 5.8. As can be seen, the digital PSD gives at least as good separation as the analogue PSD in the entire energy range. The ZCO based PSD method is shown to work better than the charge comparison based. The FOM saturates around 9 bits for the charge comparison based method and at about 10 bits for the ZCO based method. It should be noted that these values are for the dynamic range of this experiment with γ-ray energies between Ee = 15–700 keV and recoil proton energies between Ep = 250–2700 keV. Increasing the bit resolution by one unit would double the dynamic range which implies that a bit resolution of 12 bits would be adequate for most experiments since this allows for PSD up to recoil proton energies of Ep = 12 MeV. For the low energy pulses the FOM shows no strong dependence of the sampling frequency above 100 MS/s. For high energy pulses the FOM increases slowly above 100 MS/s. The R values saturate already around 75 MS/s. The apparently odd frequency behavior for low-energy pulses is due to the asymmetries shown in fig. 5.7.
5.2
Time Resolution
In a fully digital system the TOF measurement should also be determined by the digitized pulse in the neutron detector. In ref. [1] a test of the influence of the finite sampling frequency on the achievable time resolution was made. Two TNT2 channels, each recorded with a sampling frequency 36
a)
b)
1.4 1.2 R (%)
FOM
1 0.8 0.6
1
0.4 0.2 0
10-1
102 2×10² E (keV)
20 30
c)
102 2×10² E (keV)
20 30
d)
1.4 1.2 R (%)
FOM
1 0.8 0.6
1
0.4 0.2 0
6
8
10 bit
12
10-1
14
e)
6
8
10 bit
12
14
f)
1.4 1.2 R (%)
FOM
1 0.8 0.6
1
0.4 0.2 0
100
200 MS/s
10-1
300
100
200 MS/s
300
Figure 5.8: FOM (a, c, e) and R (b, d, f) for the ZCO (circles) and charge comparison (squares) based methods as a function of energy (a, b), bit resolution (c, d) and sampling frequency (e, f). The solid line (a, b) is from analogue reference data using NDE202 electronics. Filled and empty symbols (c, d, e, f) correspond to an electron (proton) energy gate of Ee = 500–700 keV (Ep = 2200–2700 keV) and Ee = 50–57 keV (Ep = 500– 540 keV) respectively. 37
Amplitude
1 0.9 0.8 0.7 0.6 0.5 0.4 0.3 0.2 0.1 0
T1-∆T
-2
-1
T T0
T1
0 Time (a.u.)
p
1
0
2
Figure 5.9: Sampling (circles) of a Gaussian function (dashed line) with a time between sampling points, ∆T , equal to the σ of the Gaussian function. The threshold, p0 , is crossed at a time T0 . The first sampling point above the threshold occur at time T1 and the measured time after sampling is T . of 100 MS/s, were compared and a timing parameter ∆t21 was defined as the difference between the extracted leading edge times of each of the two channels. The distribution of ∆t21 was used as an estimate of the time resolution due to the finite sampling frequency. A FWHM of 1.7 ns was extracted and by comparing this to the achievable intrinsic time resolution of a liquid scintillator detector plus PMT, typically FWHM = 1.5 ns or larger, it was concluded that the contribution of the finite sampling frequency to the total FWHM of the time resolution should be almost negligible already at 200 MS/s. To verify this conclusion one can construct an analytical expression for the measured time distribution due to the finite sampling frequency; see fig. 5.9 for a definition of the parameters. The timing measurements are usually carried out by linear interpolation between the sampled points using a straight line. The straight-line equation for y as a function of x is y = kx + m,
(5.5)
y2 − y1 , x2 − x1
(5.6)
m = y2 − kx2 .
(5.7)
with the slope k= and the intercept
38
From fig. 5.9 we know that x2 = T1 , y2 = f (T1 ), x1 = T1 − ∆T and y1 = f (T1 − ∆T ). This gives f (T1 ) − f (T1 − ∆T ) f (T1 ) − f (T1 − ∆T ) = T1 − T1 + ∆T ∆T
k=
(5.8)
and
f (T1 ) − f (T1 − ∆T ) T1 . ∆T The y value of the interpolated line at a given time T is thus m = f (T1 ) −
y=T
f (T1 ) − f (T1 − ∆T ) f (T1 ) − f (T1 − ∆T ) + f (T1 ) − T1 . ∆T ∆T
(5.9)
(5.10)
Setting the y value to the threshold p0 gives the time distribution T (T1 ) as T = T1 − ∆T
5.2.1
f (T1 ) − p0 , f (T1 ) − f (T1 − ∆T )
with T0 < T1 < T0 + ∆T .
(5.11)
Results
In fig. 5.10 two examples of time distributions, using a Gaussian pulse ! T12 f (T1 ) = exp − 2 , (5.12) 2σT1 with p0 = 0.05 and p0 = 0.5 for 100 MS/s, are shown. Assuming that the time between the sampling points and when the pulse passes the threshold is random and uniform one can use eq. (5.11) to generate the time response due to the finite sampling frequency; see fig. 5.10 for two examples. As seen in fig. 5.10, the finite sampling frequency will result in a non Gaussian time distribution. Folding these time response distributions with a typical intrinsic time resolution of a liquid scintillator detector plus PMT of FWHM=1.6 ns, gives the distributions in fig. 5.11 for the different sampling frequencies used in ref. [1]. As can be seen in the figure, the conclusion in ref. [1], that 200 MS/s sampling frequency is enough for a negligible contribution to the time resolution, is verified for a threshold of p0 = 0.5.
39
100 MS/s
p =0.05
×103
0
0
Counts
100
T/σT
1
-0.2
50
-0.4 0
0.5 T / σ 1 T
0
1
0
1
100 MS/s
p =0.5
1 2 Time (ns)
3
1 2 Time (ns)
3
×10
3
0
100
T/ σT
1
Counts
0
50
-0.1 0
0.5 T / σ 1 T
0
1
1
0
Figure 5.10: In the left panels the measured times, T , as a function of T1 are shown for 100 MS/s and thresholds p0 = 0.05 (upper panel) and p0 = 0.5 (lower panel). The times are normalized to σ of the Gaussian pulse. In the right panels the time distributions due to the finite sampling frequency are shown for the parameters used in the corresponding left panels.
40
1000
p =0.05
×103
0
Counts
800 600 400 200 0
-4
1000
×103
-2
0
2
4 6 Time (ns)
8
10
12
14 p =0.5 0
Counts
800 600 400 200 0
-4
-2
0
2
4 6 Time (ns)
8
10
12
14
Figure 5.11: Time distributions for p0 = 0.05 and p0 = 0.5 folded with a typical Gaussian time resolution of a liquid scintillator detector plus PMT with a time resolution of FWHM=1.6 ns. The width of the distributions are decreasing with increasing sampling frequency. The distributions are for the frequencies 300 MS/s, 200 MS/s, 150 MS/s, 100 MS/s, 75 MS/s, 60 MS/s and 50 MS/s. The widest distributions correspond to a sampling frequency of 50 MS/s and the most narrow distributions to a sampling frequency of 300 MS/s.
41
42
Chapter 6
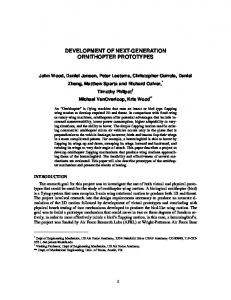
The Neutron Detector Array NEDA One of the next generation neutron detector arrays that is being developed is NEDA. NEDA is a part of the SPIRAL2 Preparatory Phase as described in section 2.2.2. The design of this detector is still in a very early stage. This chapter is intended to be a snapshot of the current status of the project. At the moment a possible NEDA configuration consist of a plane wall of hexagonal detectors elements placed from 0.5 m to ∼2 m away from a source of neutrons as shown in fig. 6.1. It is very important to carefully study different geometries both to maximize efficiency and to minimize cross talk due to multiple scattering of neutrons between the detectors. The cross talk is due to the effect that neutrons deposit energy mainly by elastic scattering with the protons in the liquid. The energy of the recoil protons can have values from zero up to the incoming neutron energy, depending on the scattering angle. Because of this there exists a probability that the neutron will scatter into a neighboring detector and interact again, causing severe errors in the counting of the number detected neutrons, which is used to measure the number of neutrons emitted in the reaction. Several methods attempting to correct for this exist [58, 79]. For example a method based on the TOF difference between the different segments has shown to give good results [58] when the segments are sufficiently far away while neighboring segments still are problematic. This is important to take into account when designing the geometry of a new array. The main plan is that NEDA will be filled with the same liquid scintillator, BC-501A, as is commonly used in other neutron detector arrays. Studies are also being made regarding the possibility to use other detector materials, for example BC-537, which is a deuterated liquid scintillator with a deuteron to proton ratio of 114:1. This liquid is being evaluated for the DESCANT project [80] and it may give some additional energy resolution and cross-talk rejection properties. 43
Figure 6.1: A part of the NEDA array used as a starting point for the simulations. Courtesy of Tayfun H¨ uy¨ uk.
6.1
Readout
One way to improve the efficiency of the neutron detector array is to improve the efficiency of the readout of the scintillation light. As mentioned in section 3.3, the standard way to read out a liquid scintillator is to couple the liquid to a PMT. The PMT typically consist of a photocathode of a bialkali metal alloy, like Sb-Rb-Cs or Sb-K-Cs [81], a series of dynodes to multiply the photoelectrons and an anode to read out the signal. Instead of using the standard setup with a photocatode and a series of dynodes one can also use a hybrid setup with a photocatode that is multiplied by an avalanche photodiode (APD). Using a hybrid setup one will have the opportunity to have a position sensitive PMT. A technology for that is for example used in the LHCb experiment [82]. The bialkali photocathode has a quantum efficiency of maximum ∼ 25% and a sensitivity well matched to the most common scintillator materials. This is one of the reasons why it is so frequently used for reading out scintillation counters. If it is possible to increase this value, the performance of the neutron detector array will be much higher, something that is critical in order to study rare reaction channels. A useful property of PMTs is, however, that regular PMTs are available in a large variety of sizes from a diameter of a few mm up to about 50 cm diameter. One alternative to a PMT for readout is to use either a regular photodiode or an APD. Today regular photodiodes can be manufactured up to sizes of about 20 × 20 mm2 while APDs are limited to about 10 × 10 mm2 . The quantum efficiency of the photodiodes can be very high, up to 85% 44
at the peak of maximum sensitivity, but the spectral response of this kind of diodes usually shows a very sharp drop at lower wavelengths. This is due to the fabrication of the photodiode where a thin film of 80-100 nm p-doped material is implanted on the silicon wafer, which makes it difficult to get high sensitivity at shorter wavelengths. There are, however, also some examples of large-area short-wavelength APDs, like the Hamamatsu S8664 ¯ which is planned to be used for the readout for the PANDA electromagnetic calorimeter [83]. Regular and avalanche photodiodes can be useful for feasibility tests but the size and wavelength response are issues that need to be resolved in order for photodiodes to be used by NEDA. Silicon PMTs are another kind of position sensitive readout that has gained popularity in some fields lately [84]. These consist of an array of around 1000 independent APDs per mm2 . The quantum efficiency and gain of this kind of readout is quite similar to regular PMTs. The main advantages are good time resolution, no dependency on external magnetic fields and an extremely compact design. Although these parameters are of importance as well there must still be a substantial development regarding quantum efficiency and gain for them to be considered for NEDA. Another very promising technology is the ultra-pure bialkali photocathode PMTs that have been made available quite recently by Hamamatsu. By using a fine tuned deposition process one could achieve ultra-pure photocathode materials and reach a quantum efficiency of up to 43% [85]. These PMTs are currently available in sizes of up to 76 mm diameter, which is probably not enough for NEDA. If larger sizes are developed they might be a very promising candidate for replacement of the regular PMTs. More tests of both APDs and ultra-pure bialkali photocathode PMTs would give valuable information for the design of the development of neutron detectors for the next generation of radioactive ion-beam facilities.
45
46
Chapter 7
Summary and Outlook In this work the performance of the Neutron Wall detector array and digital pulse-shape discrimination of neutrons and γ rays has been studied. The detection process in liquid scintillators has been discussed in detail. The physics motivation for a new neutron detector array has also been briefly discussed and a snapshot of the development of NEDA has been presented. To increase the efficiency of the Neutron Wall it is suggested to increase the high voltage of the photomultiplier tubes. The apparent decrease in quality of the separation in the one-dimensional zero cross-over projections due to low-energy neutron interactions could be corrected for if the zero cross-over is used together with the charge-to-voltage converter and time-of-flight. For the next generation neutron detector array, NEDA, other readout systems have been discussed. To further investigate alternative read out, the scintil¯ lator BC-501A should be tested together with one of the PANDA avalanche photodiodes, especially regarding pulse-shape discrimination properties of this kind of detector system. The other main part of this work has been to develop digital pulse-shape discrimination algorithms and test the performance of these with respect to sampling frequency and bit resolution of the ADC. The results from these measurements show that an analog-to-digital converter with a bit resolution of 12 bits and a sampling frequency of 100 MS/s is adequate for pulse-shape discrimination of neutrons and γ rays for a neutron energy range of 0.3–12 MeV. One limitation of these tests has been the available ADC, in this work 300 MS/s and 14 bits. In order to try different combinations of sampling frequency and bit resolution it is desirable to simulate realistic pulse shapes and the sampling of these. As input to these simulations, it is necessary to measure the time constants of the decay components, as well as to measure the relative amount of the different components for different particle species. This is a project that is still ongoing [69]. It has also been shown that 200 MS/s sampling frequency is enough for a negligible contribution to the time resolution.
47
48
Acknowledgements First of all I would like to thank my supervisors Johan Nyberg and Ayse Ata¸c for all their help during this time. I would also like to thank my supervisors from my Masters thesis, Stephan Pomp and Jan Blomgren, for showing me the joy of experimental nuclear physics, thus keeping me on the right track. ∞ It is very exciting to work in the NEDA collaboration and see all different ideas merging together into the next neutron detector array. Thanks to Jose Javier Valiente Dobon for organizing this and the rest of the NEDA collaboration for their efforts. ∞ The work on the Neutron Wall was very rewarding much thanks to Marcin Palacz, Gilles de France and Paula Salvador Casti˜ neira. The work, dinners, tourism and company during the SPIRAL2 Week were all very nice. ∞ I would also like to acknowledge the people in the Ph.D. student councils, both at the faculty and at the student union, for all energy they put in keeping Ph.D. studies in Uppsala a well spent time for everyone. ∞ I am also grateful to Sophie Grape for reading the manuscript, giving valuable comments and, just when I was finished, forcing me to rearrange large parts of this work. ∞ I would also like to acknowledge all fellow Ph.D. students at the department that keeps everyday life joyful: Karin Sch¨onning; Erik Thom´e, for 49
company during obscure seminars and for allowing me to use his chair now and then; Sophie Grape, for discussions, cakes, food, tea, gym, advice, gossip, movies and everything else; Bengt S¨oderbergh; Carl-Oscar Gullstr¨om; Patrik Adlarson; Henrik Petr´en; Kristofer Jakobsson, for being a good office mate; Mikael H¨ o¨ ok, for every zombie movie session throughout the years — keep on rotting in a free world!; David Eriksson; Oscar St˚ al; Martino Olivo; Olle Engdeg˚ ard; Camille B´elanger-Champagne, for gym company and everything else; Martin Flechl; Elias Coniavitis, for doing his best keeping up the Thursday spirit; and Andrea Palaia. And all Ph.D. and masters students that have come and gone during these two years, and that will come and go during the coming two years. And Enzo, although you are not a Ph.D. student you are still OK. ∞ There are also other friends that should be mentioned: Karin and Jenny, just for being very good friends; Freddyboy, for filling my life with music; Klas-Herman and Hanna Victoria M¨orck, for playing board games, giving me coffee and getting me involved in more things than what is probably good for me; Henke and Carolina, for being the wonderful persons you are; and Martin, Lasse, Thomas and the other old friends from Hudiksvall that always make visiting fun. ∞ Jag vill ocks˚ a tacka Leena som funnits d¨ar hela mitt liv och Tage som funnits d¨ ar n¨ astan hela mitt liv, och som b˚ ada kommer att forts¨atta finnas hos mig resten av livet. ∞ Thanks to everyone! ∞
P¨ar-Anders S¨oderstr¨om
50
Bibliography [1] P.-A. S¨ oderstr¨ om, J. Nyberg, and R. Wolters. Digital pulse-shape discrimination of fast neutrons and γ rays. Nucl. Instrum. Meth., A594:79, 2008. [2] J. Chadwick. Possible Existence of a Neutron. Nature, 129:312, 1932. [3] C. Salvetti. The birth of nuclear energy: Fermi’s pile. In C. Bernardini and L. Bonolis (editors), Enrico Fermi: His work and legacy. Springer, 2002. [4] P.-A. S¨ oderstr¨ om. Energy spectra for protons emitted in the reaction nat Ca(n, xp) at 94 MeV. Master’s thesis, Uppsala University, Uppsala, 2007. [5] M. Hayashi, et al. Measurement of light-ion production at the new Uppsala neutron beam facility. In O. Bersillon, et al. (editors), Proceedings of the International Conference on Nuclear Data for Science and Technology 2007, page 1091. EDP Sciences, 2008. [6] U. Tippawan, et al. Studies of neutron-induced light-ion production with the MEDLEY facility. In O. Bersillon, et al. (editors), Proceedings of the International Conference on Nuclear Data for Science and Technology 2007, page 1347. EDP Sciences, 2008. [7] G. F. Knoll. Radiation Detection and Measurements. John Wiley & Sons, Inc., 3rd edition, 1999. [8] M. Winkler, et al. The status of the Super-FRS in-flight facility at FAIR. Nucl. Instrum. Meth., B266:4183, 2008. [9] W. F. Henning. FAIR and its experimental program. J. Phys. G, 34:551, 2007. [10] S. Gales. SPIRAL2 at GANIL: A world leading ISOL facility at the dawn of the next decade. Prog. Part. Nucl. Phys., 59:22, 2007. [11] Y. Blumenfeld, et al. EURISOL Design Study: Toward the Ultimate ISOL Facility for Europe. Nucl. Phys. News Intl., 19:22, 2009. 51
[12] R. A. Ricci. Phenomenological nuclear spectroscopy (a personal recollection). In A. Covello, F. Iachello, R. A. Ricci, and G. Maino (editors), Proceedings of the International School of Physics ’Enrico Fermi’, volume 169 Nuclear Structure far from Stability: new Physics and new Technology, page 29. SIF, Bologna and IOS Press, Amsterdam, 2008. [13] J. Simpson. The Euroball Spectrometer. Z. Phys., A358:139, 1997. [14] I.-Y. Lee. The GAMMASPHERE. Nucl. Phys., A520:c641, 1990. [15] E. Arnold, et al. Quadrupole moment of 1992.
11 Li.
Phys. Lett., B281:16,
[16] R. S´ anchez, et al. Nuclear Charge Radii of 9,11 Li: The Influence of Halo Neutrons. Phys. Rev. Lett., 96:033002, 2006. [17] A. Chatterjee, et al. 1n and 2n Transfer With the Borromean Nucleus 6 He Near the Coulomb Barrier. Phys. Rev. Lett., 101:032701, 2008. [18] M. V. Zhukov, et al. Bound state properties of Borromean halo nuclei: 6 He and 11 Li. Phys. Rept., 231:151, 1993. [19] D. Seweryniak, et al. Single-Neutron States in 99:022504, 2007.
101 Sn.
Phys. Rev. Lett.,
[20] D. Seweryniak. First Measurement of Single-Particle Energies in 100 Sn. Nucl. Phys. News Intl., 19:18, 2009. [21] M. Lipoglavˇsek, et al. In-beam study of 1996.
102 Sn.
Z. Phys., A356:239,
[22] M. G´ orska, et al. 98 48 Cd50 : The Two-Proton-Hole Spectrum in Phys. Rev. Lett., 79:2415, 1997. [23] R. Schneider, et al. Production and identification of A348:242, 1994.
100 Sn.
100 Sn50 . 50
Z. Phys.,
[24] M. Lewitowicz, et al. Identification of the doubly-magic nucleus 100 Sn in the reaction 112 Sn+nat Ni at 63 MeV/nucleon. Phys. Lett., B332:20, 1994. [25] K. Eppinger, et al. 100 Sn and Nuclei in its Neighbourhood. Submitted to the GSI Scientific Report 2008. [26] P. H. Regan, et al. Structure of the doubly midshell nucleus Phys. Rev., C65:037302, 2002.
170 Dy 104 . 66
[27] A. Johnson, H. Ryde, and J. Sztarkier. Evidence for a “singularity” in the nuclear rotational band structure. Phys. Lett., B34:605, 1971. 52
[28] P. Walker and G. Dracoulis. Energy traps in atomic nuclei. Nature, 399:35, 1999. [29] F. Iachello and A. Arima. The Interacting Boson Model. Cambridge University Press, Cambride, 1987. [30] R. F. Casten, P. von Brentano, and A. M. I. Haque. Evidence for an underlying SU(3) structure near neutron number N = 104. Phys. Rev., C31:1991, 1985. [31] P.-A. S¨ oderstr¨ om, et al. Spectroscopic studies of 168,170 Dy using CLARA and PRISMA. Submitted to the LNL Annual Report 2008. arXiv:0903.3819 [nucl-ex]. [32] S. Hofmann and G. M¨ unzenberg. The Discovery of the heaviest elements. Rev. Mod. Phys., 72:733, 2000. [33] W. Loveland. Synthesis of transactinide nuclei using radioactive beams. Phys. Rev., C76:014612, 2007. [34] H. Geissel, et al. The GSI projectile fragment separator (FRS) : a versatile magnetic system for relativistic heavy ions. Nucl. Instrum. Meth., B70:286, 1992. [35] U. K¨ oster. Intense radioactive-ion beams produced with the ISOL method. Eur. Phys. J., A15:255, 2002. [36] Zs. Podoly´ ak. The High-Resolution In-Flight Spectroscopy (HISPEC) Project at FAIR. Int. J. Mod. Phys., E15:1967, 2006. [37] B. Rubio. Decay Spectroscopy (DESPEC) at the New FAIR-NUSTAR Facility. Int. J. Mod. Phys., E15:1979, 2006. [38] J. Simpson and R. Kr¨ ucken. AGATA: The Advanced Gamma Tracking Array. Nucl. Phys. News Intl., 13:15, 2003. [39] P.-A. S¨ oderstr¨ om, et al. AGATA: Gamma-ray tracking in segmented HPGe detectors. To appear in Proceedings of the 17th International Workshop on Vertex detectors, PoS (VERTEX 2008)040. arXiv:0812.0091 [nucl-ex]. [40] A. Gadea, et al. First in-beam commissioning experiment of AGATA. Submitted to the LNL Annual Report 2008. [41] F. Azaiez. EXOGAM: a γ-ray spectrometer for radioactive beams. Nucl. Phys., A654:1003c, 1999. [42] H. Hart, L. E. Craine, and D. J. Hart. Organic Chemistry. Houghton Mifflin, Boston, 10th edition, 1999. 53
[43] J. B. Birks. The Theory and Practice of Scintillation Counting. Pergamon, 1964. [44] Figure reused under the Creative Commons Attribution-ShareAlike 3.0 License from http://en.wikipedia.org/wiki/File:Benzol trans. png. [45] G. N. Lewis and M. Kasha. Phosphorescence and the Triplet State. J. Am. Chem. Soc., 66:2100, 1944. [46] C. A. Parker and C. G. Hatchard. Delayed Flourescence from Solutions of Anthracene and Phenanthrene. Proc. Chem. Soc, 1962. [47] P.-A. S¨ oderstr¨ om. Detection of fast neutrons and digital pulse shape discrimination between neutrons and γ rays. In A. Covello, F. Iachello, R. Ricci, and G. Maino (editors), Proceedings of the International School of Physics ’Enrico Fermi’, volume 169 Nuclear Structure far from Stability: new Physics and new Technology, page 551. SIF, Bologna and IOS Press, Amsterdam, 2008. [48] R. B. Owen. The Variation of Phosphor Decay Time With Specific Ionization and its Applications. In L´electronique nucl´eaire: comptes rendus du Colloque international sur l´electronique nucl´eaireorganis´e par la Soci´et´e franaise des radio´electriciens, Paris, 1958, volume 1 (Sessions 1-5), page 27. IAEA, Wien, 1959. [49] R. B. Owen. Pulse-Shape Discrimination Identifies Particle Types. Nucleonics, 17:92, 1959. [50] P. E. Gibbons, D. C. Northrop, and O. Simpson. The Scintillation Phenomenon in Anthracene: II. Scintillation Pulse Shape. Proc. Phys. Soc., 79:373, 1962. [51] F. T. Kuchnir and F. J. Lynch. Time Dependence of Scintillations and the Effect on Pulse-Shape Discrimination. IEEE Trans. Nucl. Sci., NS-15:107, 1968. [52] H. Klein and S. Neumann. Neutron and photon spectrometry with liquid scintillation detectors in mixed fields. Nucl. Instrum. Meth., A476:132, 2002. [53] S. E. Arnell, et al. A 2π neutron and γ-ray multiplicity filter for the NORDBALL detection system. Nucl. Instrum. Meth., A300:303, 1991. [54] H. Laurent, et al. EDEN: a neutron time-of-flight multidetector for decay studies of giant states. Nucl. Instrum. Meth., A326:517, 1993. 54
[55] I. Tilquin, et al. Detection efficiency of the neutron modular detector DEMON and related characteristics. Nucl. Instrum. Meth., A365:446, 1995. ¨ Skeppstedt, et al. The EUROBALL neutron wall - design and per[56] O. formance tests of neutron detectors. Nucl. Instrum. Meth., A421:531, 1999. [57] D. G. Sarantites, et al. “Neutron Shell”: a high efficiency array of neutron detectors for γ-ray spectroscopic studies with Gammasphere. Nucl. Instrum. Meth., A530:473, 2004. [58] J. Ljungvall, M. Palacz, and J. Nyberg. Monte Carlo simulations of the Neutron Wall detector system. Nucl. Instrum. Meth., A528:741, 2004. [59] T. K. Alexander and F. S. Goulding. An amplitude-insensitive system that distinguishes pulses of different shapes. Nucl. Instrum. Meth., 13:244, 1961. [60] M. Roush, M. Wilson, and W. Hornyak. Pulse Shape Discrimination. Nucl. Instrum. Meth., 31:112, 1964. [61] F. D. Brooks. A scintillation counter with neutron and gamma-ray discriminators. Nucl. Instrum. Meth., 4:151, 1959. [62] The NDE202 was built by D. Wolski, M. Moszy´ nski, et al. at The Andrzej Soltan Institute for Nuclear Studies, Swierk, Poland. [63] The Andrzej Soltan Institute for Nuclear Studies. EUROBALL neutron detectors electronics “Bartek” NDE 202, 2001. Users manual. Available from http://nsg.physics.uu.se/nwall/. [64] B. Cederwall, et al. Search for T=0 pairing and a new coupling scheme in 92 Pd and 96 Cd. GANIL experiment proposal E451. [65] A. Gadea, et al. Mirror Energy Differences in the A = 58, T = 1 mass triplet and Charge Symmetry Breaking terms in the nuclear effective interaction above 56 Ni. GANIL experiment proposal E482. [66] J. Nyberg. HOWTO measure the number of photo electrons per MeV for the detectors of the Neutron Wall, 2005. Internal document. Available from http://nsg.physics.uu.se/nwall/. [67] J. N. Scheurer, et al. Improvements in the in-beam γ-ray spectroscopy provided by an ancillary detector coupled to a Ge γ-spectrometer: the DIAMANT-EUROGAM II example. Nucl. Instrum. Meth., A385:501, 1997. 55
[68] R. A. Winyard, J. E. Lutkin, and G. W. McBeth. Pulse shape discrimination in inorganic and organic scintillators. I. Nucl. Instrum. Meth., A95:141, 1971. [69] P. Salvador Casti˜ neira. Characterization of the Neutron Wall and response measurments of liquid scintillator BC-501A. Project report in manuscript. [70] N. V. Kornilov, et al. Neutron spectroscopy with fast waveform digitizer. Nucl. Instrum. Meth., A497:467, 2003. [71] S. Marrone, et al. Pulse shape analysis of liquid scintillators for neutron studies. Nucl. Instrum. Meth., A490:299, 2002. [72] C. Guerrero, et al. Analysis of the BC501A neutron detector signals using the true pulse shape. Nucl. Instrum. Meth., A597:212, 2008. [73] B. D’Mellow, et al. Digital discrimination of neutrons and γ-rays in liquid scintillators using pulse gradient analysis. Nucl. Instrum. Meth., A578:191, 2007. [74] M. D. Aspinall, et al. Verification of the digital discrimination of neutrons and γ rays using pulse gradient analysis by digital measurement of time of flight. Nucl. Instrum. Meth., A583:432, 2007. [75] E. Gatti and F. de Martini. A new linear method of discrimination between elementary particles in scintillation counters. In Nuclear Electronics, Proceedings of International Conference at Belgrade, volume II, page 265. IAEA, Vienna, 1962. [76] G. Ranucci. An analytical approach to the evaluation of the pulse shape discrimination properties of scintillators. Nucl. Instrum. Meth., A354:389, 1995. [77] L. Arnold, et al. TNT Digital Pulse Processor. IEEE Trans. Nucl. Sci., 53:723, 2006. [78] J. H. Friedman. Data Analysis Techniques for High Energy Particle Physics. In Proceedings of the 1974 CERN School of Computing, page 271. CERN, Geneva, 1974. [79] J. Cederk¨ all, B. Cederwall, A. Johnson, and M. Palacz. Relative enhancement of weak two-neutron exit channels in heavy-ion induced fusion-evaporation reactions. Nucl. Instrum. Meth., A385:166, 1997. [80] P. E. Garrett, et al. Nuclear structure studies at ISAC-II with the DESCANT Array. Progress Report for TRIUMF EEC meeting 200712S experiment S1145. 56
[81] A. H. Sommer. Photoemissive materials. Wiley, New York, 1968. [82] A. A. Alves Jr., et al. The LHCb Detector at the LHC. JINST, 3:S08005, 2008. ¯ [83] Technical Design Report for PANDA Electromagnetic Calorimeter (EMC), 2008. arXiv:0810.1216 [physics.ins-det]. [84] P. Buzhan, et al. An advanced study of silicon photomultiplier. ICFA Instrum. Bull., 23:28, 2001. [85] D. Renker. New developments on photosensors for particle physics. Nucl. Instrum. Meth., A598:207, 2009.
57