International Journal for Traffic and Transport Engineering, 2017, 7(2): 216 - 231 DOI: http://dx.doi.org/10.7708/ijtte.2017.7(2).06
UDC: 629.35(669)
DEVELOPMENT OF PROBABILISTIC DETERIORATION MODELS AND PRIORITISATION OF LOW VOLUME ROADS FOR MAINTENANCE Susan Rose1, Binu Sara Mathew2, Kuncheria Palampoikayil Isaac3 Department of Civil Engineering, College of Engineering Trivandrum, Kerala, India APJ Abdul Kalam Technological University, Kerala, India
1,2 3
Received 20 February 2017; accepted 8 April 2017
Abstract: India is having the second largest road network in the world and low volume roads contributes to about 61% of the total road network. Low volume roads in the rural areas face serious problems due to absence of timely maintenance resulting from stringent budget availability. For proper management of these roads, scientific pavement management tools are necessary. Right maintenance treatment is to be given to the right place at the right time. For this, the roads in a network are to be prioritized based on its importance with regard to the extent of deterioration. The deterioration of the pavement can be both functional and structural. Hence, the functional distresses, roughness and deflection of the pavement were selected as the performance indicators in this study while prioritising. The collection of distress data over the pavement life is a tedious process, where as the collection of roughness data which is a result of the distresses occurring on pavement is much easier. This paper attempts to compare the unified pavement condition indices developed using two approaches i) using combination of distresses and characteristic deflection and ii) using a combination of roughness and characteristic deflection. For the purpose of prioritisation of roads, pavement deterioration prediction models that can predict the condition of pavements at a future time are essential. Probabilistic approach is considered while developing the pavement prediction models and critical percentile values were used for prioritisation purpose. For roughness and deflection, non linear deterministic models were first developed and the corresponding probabilistic models were arrived at. Unified pavement condition indices were developed using Analytic Hierarchy Process (AHP) and the priority of the roads was compared. AHP is a simple and effective tool which uses pair wise comparison and relies on the judgments of experts to derive priority scales. Comparative approach in AHP is intuitively appealing and supported by evidence from cognitive psychology. The result shows that the indices developed using both approaches are comparable and hence prioritisation of the low volume roads can easily be done using the index developed by combining roughness and deflection values. Keywords: low volume roads, prioritisation, probabilistic deterioration models, fuzzy logic, pavement distresses, roughness, deflection.
1. Introduction Pavements are one of the most critical components of a road network in terms of asset value and transportation system in a 1
regional or national economic development. Many a time, it becomes difficult for the decision makers to provide the required maintenance treatment to a large number of roads in the network with the available
Corresponding author:
[email protected]
216
Rose S. et al. Development of Probabilistic Deterioration Models and Prioritisation of Low Volume Roads for Maintenance
budget. This necessitates a methodology for prioritisation of roads based on its importance for maintenance. The importance of roads can be represented based on its existing condition with regard to its functional and structural health. A composite pavement condition index can be conveniently used to represent the pavement health. This will help in assisting the pavement engineers to compare different roads and also it provides a simple communication tool to convey summary information to senior administrators, elected officials and the public (Sun and Gu, 2011). The composite index commonly used for the representation of pavement condition is the Pavement Condition Index (PCI) developed by Shahin et al. (1978) which takes into account the effect of various distresses occurring in pavement. (Chandran et al., 2007) ranked the pavement sections for maintenance with fuzzy condition indices using a suitable fuzzy ranking method. Distresses such as ravelling and pothole were considered for assessing the performance. Juang and Amirkhanian (1992) developed a unified pavement distress index (UPDI) using fuzzy logic based on alligator cracking, rutting, potholes, patching, block cracking and longitudinal cracking. The index was used to analyse the data bases generated from pavement condition survey. (Shah et al., 2013) developed an overall condition index for urban road network. Pavement Condition Index, Pavement Roughness Index, Pavement Structural Capacity Index and Pavement Skid resistance index were developed individually and all these were combined to develop an overall index. W h i le a s se s s i ng t he c ond it ion of a pavement, both functional condition and
217
structural condition is to be monitored. Functional condition can be assessed based on the distresses observed on the pavement or its roughness and structural condition can be assessed based on the def lection studies. The analysis of the condition of pavement over the years requires pavement condition prediction models. Deterministic models widely used for the prediction purpose alone cannot realistically represent the field condition and will give only an average estimate of the actual field condition. Hence for the prediction of future pavement condition, probabi l ist ic models were essent ia l. Probabi l i st ic model s i n t he for m of probability distribution functions were developed by Martin and Kadar (2012). For the prediction of future distress intensities, the probabilistic models developed by the authors were used (Rose et al., 2016). For roughness progression and def lection progression, deterministic models were first developed and using those models probabilistic models was arrived at. Then using the probabilistic models developed, condition of pavement was predicted and the critical values were chosen for the purpose of prioritisation (Rose et al., 2016). A unified pavement condition index was developed by considering intensities of distresses and def lection to assess the pavement condition. But the development of condition index based on the intensities of various distresses is quite complex, as it involves classified data collection of distresses. Hence an attempt was made to develop a methodology for arriving at unified pavement condition index using roughness and def lection. The reliability of the new index developed was checked by comparing it with the index developed by combining distresses and def lection.
International Journal for Traffic and Transport Engineering, 2017, 7(2): 216 - 231
2. Methodology The study mainly involves the development of deterioration prediction models and unified pavement condition indices for low volume roads. The performance indicators selected for the development of pavement condition prediction models are i) various distresses, ii) roughness and iii) deflection. Pavement performance models are essential to predict the condition of pavement at a future stage. Pavement deterioration models express the change in distress over a time base ‘t’ and should be able to predict the change in pavement condition over a given period of time under a set of conditions. Initially deterministic models were developed for the prediction of these performance indicators and probabilistic models were then developed using these deterministic models. Unified pavement condition index (UPCI) constitutes a unified basis for comparison of pavement condition of different road segments. Several techniques are available for the development of unified indices, but Analytic Hierarchy Process (AHP) uses pair wise comparison, which is more reliable in arriving at the priorities of each variable that contribute to the unified pavement condition index. The parameters to be considered for the prioritization of roads for maintenance in a network were first decided. Functional condition of the pavement and structural condition of the roads were identified as the major parameters. Two approaches were selected for the development of the indices. First approach (Unified Pavement Condition Index-I (UPCI-I)) considered the intensities of various distresses to represent the functional condition and deflection to represent the structural condition. Second approach (Unified Pavement Condition Index-II – (UPCI-II)) considered roughness to represent the functional condition and
def lection to represent the str uctural condition. Various performance indicators predicted using the deterioration prediction models developed were used for prioritization using AHP. The methodology developed is described in subsequent sections.
2 . 1 . D e ve l o p m e n t o f Pa ve m e n t Performance Models Deterministic models can predict the condition of pavement accurately, but can give only an average estimate. Probabilistic models can realistically represent the field conditions, by predicting the var y ing conditions of pavement along with the probabilit y of occurrence. But sound deterministic models are necessar y to develop probabilistic models for realistically predicting the pavement condition. In the study, non linear regression models were developed using SPSS 14.0 (Statistical Pack age for Socia l Sciences) for t he prediction of deflection and roughness and then those models were used in developing the probabilistic models. The independent factors which contribute to the progression of deflection and roughness were first identified and using the field data collected, the models were developed. For the development of probabi listic models, initially the field data pertaining to the independent variables used in the deterministic models developed for the performance indicators in the present study were fitted with probability distribution f u n c t i o n s ( p d f s). T h e n t h e f i t t e d distributions were given as input into the deterministic models and simulation was run to obtain the output distribution for the dependent variable. The output distributions were then used to predict the performance indicators for varying pavement age.
218
Rose S. et al. Development of Probabilistic Deterioration Models and Prioritisation of Low Volume Roads for Maintenance
For t he pred ict ion of d ist resses, t he deterministic and probabilistic models developed earlier by the authors were used, (Rose et al., 2016).
2.2. Development of Unified Pavement Condition Indices using Analytic Hierarchy Process (AHP) The development of Unified Pavement Condition Indices using A HP mainly involves two steps: i) Definition of Hierarchy and ii) Formation of weight matrix and priority vector. i.
Definition of Hierarchy
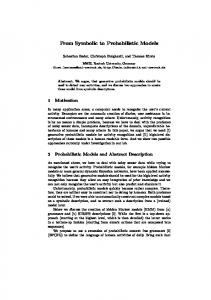
AHP is a structured technique for dealing with complex decisions. It helps decision maker find the decision that best suits their needs and their understanding of the problem (Smith and Tighe, 2006). After defining the factors affecting prioritization, the hierarchy associated with the problem was structured. Level ‘0’ is the goal of the
Fig. 1. Hierarchical Structure for Prioritization
219
analysis, which is prioritization of roads for maintenance. Level ‘1’ is the multi criteria that consist of the parameters like functional condition and structural condition of roads that affect the decision for prioritization. At this level, the relative importance of these parameters must be established. There will be one comparison matrix of size ‘n’ corresponding to the pair wise comparison between the ‘n’ numbers of parameters, with respect to goal. If any parameter in Level 1 consists of sub criteria which can affect the decision making process, that can be considered as Level 2. In this level comparison matrix of the sub criteria with respect to its parent criterion must be formed. The last level, Level 3 is the group of roads that are to be prioritized. In this level, there will be comparison matrices (of size equal to the number of roads) with respect to each criterion. For any criterion with the sub criteria, comparison matrices should be established with respect to each sub criteria. The hierarchical structure for prioritization is as shown in Fig. 1.
International Journal for Traffic and Transport Engineering, 2017, 7(2): 216 - 231
ii. Formation of Weight Matrix and Priority Vector The effect of each criterion, on the decision to rank the roads for maintenance will differ, and hence proper weightage should be assigned to each criterion. For this, the relative weightage of a pair of criteria was assigned based on delphi technique. AHP relies on pair wise comparison as it is more manageable for a person to compare the relative importance of a pair of criteria, than to assign weights to many criteria simultaneously. The relative importance was expressed as a pair wise comparison matrix. AHP as recommended by Saaty (2008) uses a nine-point scale to determine the comparative difference in a pair wise comparison of two elements. The outcome of each set of pair wise comparison is expressed as a reciprocal matrix A= (aij) such that aii = 1 and aij = 1/aji for all i, j≤ n. The experts were requested to give their opinion regarding the relative weightage of a pair of criteria on a scale of 1-9. The questionnaire sought their opinion regarding whether importance is given to criterion1 or criterion 2, and how much preference they would give to the relevant criterion, while taking the decision. Similarly the relative weightage of each pair of sub criteria under a criterion was also arrived at. The weightage of each alternatives (roads) based on the criteria was also expressed as a reciprocal matrix on a scale of 1-9. For this, the field values of the performance indicators were normalized to a scale of 1-9. Then the relative weightage of each road was calculated by comparing their respective distress intensities and deflection in the first approach and comparing their roughness and deflection in the second approach. The distress intensities, roughness and deflection on the roads can be found out using suitable pavement deterioration prediction models.
Synthesis is the step that translates the priorities, assigned to each pair of elements, in the reciprocal matrix A into a priority vector ‘w,’ that contains the priority weight of each element. Saaty’s eigenvector method (Saaty, 2008) was used for deriving the priority vector. It is used to derive the priorities of the alternatives and computes ω’ as the principal eigenvector that corresponds to the largest eigenvalue called the principal eigenvalue, ‘λmax’ of the matrix A, Eq.(1). (1) where: ω’ = [ω 1 ω 2 ..... ω n] T The priority vector ‘w’ is obtained by normalising the principal eigenvector ω’, and is also called the normalised principal eigenvector. The priority vector is the normalised principal eigenvector of the pairwise comparison matrix. It is established for each criterion, sub-criterion, as well as the alternatives under each sub-criterion. The overall priority weight of alternatives is computed as follows, Eq. (2): (2) where: V i : overa l l pr ior it y weight of alternative i, Wj: weight assigned to criterion j, X ij: weight of alternative i given criterion j. AHP allows ten percent inconsistency in human judgments. To check for consistency in judgments, Saaty defined the Consistency Ratio ‘CR’ which is a comparison between Con si stenc y I nde x ‘CI’ a nd R a ndom Consistency Index ‘RI’ as given below, Eq. (3): CR=CI/RI
(3)
where: CI =(λ max –n)/(n-1). 220
Rose S. et al. Development of Probabilistic Deterioration Models and Prioritisation of Low Volume Roads for Maintenance
Here n is the size of the pair wise comparison matrix and λ max is the principal eigenvalue. RI is obtained by computing the CI value for randomly generated matrices. A matrix is consistent only if CR≤ 0.1 (Saaty, 2008). A f ter f inding out the overall priorit y weight, the alternatives were ranked for maintenance.
3. Case Study The developed methodology is demonstrated through a case study conducted on 14 low volume roads in the state of Kerala, India. The selected low volume roads in the rural road network has a typical pavement structure of two layers of Water Bound Macadam (WBM) base course of thickness 75 mm each and 20 mm thick Pre-mix Carpet (PMC) surface course. All the roads are single lane carriageway with carriage way width varying from 3.0 to 3.5 m and roadway width varying from 8 to 12 m. Age of roads within the network during the initial phase of condition survey varied from two to three years. The traffic varied from 5 to 50 commercial vehicles per day (cvpd). Various distresses identified
on these roads were ravelling, pothole and edge failure. Data pertaining to these roads were collected over a period of four years. Distress intensities were measured manually from the field. Roughness data was collected using MERLIN (Machine for Evaluating Roughness using Low-cost Instrumentation) and characteristic def lection data was collected using Benkelman Beam.
3 . 1 . D e ve l o p m e n t o f Pa ve m e n t Performance Prediction Models 3.1.1. Prediction Models for Pavement Distresses T he d e t e r m i n i s t ic mo d e l s a nd t he corresponding probabilistic distributions developed earlier by the authors for the distress intensity prediction are shown in Table1. The distress intensities on these roads for various pavement ages were predicted using those models and the critical value which has more chance of progression in the pavement, for each year was identified using risk analysis (Rose et al., 2016). The critical values of each year thus identified were used for the prioritization of roads.
Table 1 Deterministic and Probabilistic Distress Prediction Models Distress Ravelling
Pothole
Deterministic Model Rate of ravelling progression over a time interval ‘t’ RVi: Initial Ravelling (%) at the beginning of time interval ‘t’ CQ: Construction Quality Page: Age of pavement in years after time interval ‘t’ PHt/t: Rate of pothole progression over a time interval ‘t’ PHi: Initial Pothole Area (%) at the beginning of time interval ‘t’ MSN: Modified Structural Number Thbm: Percentage variation in total thickness of pavement
Edge failure Eft: Edge break (%) after a time interval‘t’ Efi: Initial Edge break (%) at the beginning of time interval ‘t Edi: Initial Edge Drop (%) at the beginning of time interval ‘t’
Source: (Rose et al., 2016)
221
Probabilistic Model Gamma distribution
Exponential distribution
Inverse Gaussian distribution
International Journal for Traffic and Transport Engineering, 2017, 7(2): 216 - 231
3.1.2. Prediction Models for Characteristic Deflection Rebound def lection on the road stretches was measured once a year for three years using Benkelman Beam as per IRC: 81-1997 (Guidelines for Strengthening of Flexible Road Pavements using Benkelman Beam Deflection Technique). A minimum of twelve points were marked on each study stretch and the deflection measurements were carried out on these points in the outer wheel path. The measurement locations were selected on each road stretch at 60 - 90 cm from the pavement edge depending on whether the carriageway width is less than or greater than 3.5 m. A standard truck with its rear axle weighing 8170 kg and dual tires inflated to 5.6 kg/cm2 was used for loading the pavement. Initial, intermediate and final deflection readings were noted at the selected point, and at 2.7 m and 9 m respectively from the first point. Deflection measurements taken at a temperature other than the standard temperature of 350C have to be corrected for temperature variation and hence pavement temperature was also measured during the survey by drilling a hole of 10 mm diameter and 45 mm depth. Soil sample for determination of type of soil and field moisture content was also collected for the moisture correction. After correcting the measured deflection for temperature and seasonal variation, Characteristic Deflection (Dc) was calculated by the following equation, Eq. (4):
(4) where: : is the mean deflection in mm, : is the standard deviation in mm. The characteristic def lection which is a token of the structural strength of pavement is much affected by the initial def lection, strength of pavement, traffic carried and the age of pavement at any time during the life. Characteristic deflection was modelled as a function of initial def lection, traffic in terms of Cumulative Standard Axles in msa, Modified Structural Number to account strength of pavement and age of pavement. The developed deterministic model for the prediction of def lection is shown below, Eq. (5): (5) where: Def t : Characteristic Def lection (m m) a f ter a t i me i nter v a l ‘t ’, Def i : Initial characteristic def lection (mm) at the beginning of time interval ‘t’, CSA: Cumulative Standard Axles in million, MSN: Modified Structural Number, Page: Age of Pavement in years at the end of time interval ‘t’; [n = 30, R 2 = 0.735, SE = 0.289]. The statistics of the parameters used for model development are shown in Table 2.
Table 2 Statistics of Structural Condition Data Parameter
Min
Max
Mean
Modified Structural Number (MSN) Cumulative Standard Axles (CSA in msa) Characteristic Deflection (mm)
1.52
2.60
2.06
Standard Deviation 0.33
0.01
0.978
0.342
0.287
0.88
2.91
1.47
0.27
222
Rose S. et al. Development of Probabilistic Deterioration Models and Prioritisation of Low Volume Roads for Maintenance
For the development of probabilistic models well known risk analysis software @RISKTM, Palisade Coorporation was used. The values for independent variables were obtained from the field data and those data were fitted with
a probability distribution function. The pdfs fitted for each of the independent variables in the deterioration models are shown in Table 3. Initial characteristic deflection was a constant value and hence was given as a fixed variable.
Table 3 PDF Fitted for Independent Variables of Deflection Progression Prediction Model Independent variable
PDF fitted
Modified Structural Number
Extreme value
Cumulative Standard Axle
Log logistic
Initial Roughness
Inverse Gaussian
Then the selected pdfs for each independent variables were given as input to the developed deterministic deterioration model for deflection for simulation using Monte Carlo simulation method. Deterministic model in the form of mathematical equation was input into the @RISK software. In place of the independent variables in the equation, the probability distribution function was given as input for the probabilistic modelling. Each simulation was carried out using a maximum of 1000 iterations, each with a different seed value. Probability distribution functions were fitted for the output obtained after simulation and is shown in Table 4. Table 4 PDF Fitted for Progression of Characteristic Deflection Dependent variable Characteristic deflection
PDF fitted
Probability density Function f(x)
223
a=lower bound, b=upper bound, p,q= shape parameter
Beta general
The distributions thus fitted were then used to predict the def lection for incremental pavement age. W h i le pred ic t i ng t he progression of deflection, we require that age must be varying in an incremental manner. So age was kept as a fixed variable and was incremented each year and the other independent variables were kept as random variables (which were generated according to the distribution function). Then simulation was carried out to obtain the distress intensities for each year. The model developed was validated using a set of field data that was not used for model development.
Parameters
i.
Prediction Models for Roughness Progression
Roughness is the undulation in the road profile and is of major concern to the road users in their comfort perspective. The rate of distortion is accelerated, on weakening of the pavement due to surface defects like cracking, ravelling and potholing. Roughness affects the dynamics of moving vehicles, vehicle’s wear and tear and therefore has an appreciable influence on vehicle operating costs. It also imposes dynamic loading on the road surface, thus accelerating the deterioration process. Roughness of the
International Journal for Traffic and Transport Engineering, 2017, 7(2): 216 - 231
study sections was measured using MERLIN on both wheel paths. Later the measured roughness values were converted into International Roughness Index (IRI) in m/ km using the following equation, Eq. (6): (6) where: D: the scatter of measurement in millimeter between one by tenth of total number of observations from either end. Roughness progression is dependent on other surface distresses like ravelling, pothole and strength of pavement. Roughness progression was modelled as a function of initial roughness index, pavement age and construction quality. Construction Quality was identified as one of the most important factor that affects the performance of low volume roads (Binu, 2012). Construction Quality of the road sections was assigned values ranging from zero to one depending
on the value of carriageway camber, shoulder camber, percentage reduction from the design thickness and relative compaction. These parameters were assigned a range of values varying from the most desirable to least desirable limits and each range was assigned a weight in proportion to its adequacy. The developed deterministic model for the prediction of roughness in terms of International Roughness Index is shown below, Eq. (7): (7) where: IRI: International Roughness Index at time ‘t’, IRI0: International Roughness Index at initial stage, AGE: Age of pavement in yea rs a f ter ti me inter va l ‘t, CQ : construction quality; [n=59, R 2 = 0.56, SE = 0.163]. The statistics of the variables used for model development is shown in Table 5.
Table 5 Statistics of Roughness Data Parameter
Min
Max
Mean
Standard Deviation
Roughness in IRI (m/km)
6.05
11.09
8.60
1.20
For the development of probabilistic models, the values for independent variables were obtained from the field data and those data were fitted with a probability distribution function. The pdfs fitted for each of the independent variables in the deterioration models are shown in Table 6. Then the selected pdfs were given as input to the developed deterministic model for roughness for simulation using Monte Carlo simulation
method. Deterministic model in the form of mathematical equation was input into the @ RISK software. In place of the independent variables in the equation, the probability distribution function was given as input. Each simulation was carried out using a maximum of 1000 iterations, each with a different seed value. Probability distribution functions were fitted for the output obtained after simulation and is shown in Table 7.
224
Rose S. et al. Development of Probabilistic Deterioration Models and Prioritisation of Low Volume Roads for Maintenance
Table 6 PDF Fitted for Independent Variables of Roughness Progression Prediction Model Independent variable
PDF fitted
Initial Roughness
Inverse Gaussian
Table 7 PDF Fitted for Roughness Progression Dependent variable Roughness progression
PDF fitted
Probability density Function f(x)
Parameters k= shape parameter, λ= scale parameter
Weibull
The distributions thus fitted were then used to predict the roughness for incremental pavement age. W h i le pred ic t i ng t he progression of roughness, we require that age must be varying in an incremental manner. So age was kept as a fixed variable and was incremented each year and the other independent variables were kept as random variables (which were generated according to the distribution function). Then simulation was carried out and output was obtained for each year. The model developed was
validated using a set of field data that was not used for model development. The deflection and roughness values were predicted for pavement age varying from two to six years at various percentiles. A sample output from the probabilistic model for roughness progression and def lection progression at a pavement age of six years for various percentiles are shown in Table 8. The 60 th percentile value of deflection in Table 8 is 1.62, which shows that 60% of the observed deflection values will be at or below 1.62mm.
Table 8 Roughness and Deflection Values Predicted using Probabilistic Models Probability Percentile Deflection (mm) Roughness (m/km)
10
20
30
40
50
60
70
80
90
1.22
1.3
1.36
1.45
1.53
1.62
1.76
1.98
2.33
11.92
12.54
12.94
13.21
13.47
13.78
14.07
14.37
14.81
3.2. Development of Unified Pavement importance of the criteria, distress and Condition Index Using First Approach def lection was established using Delphi technique. Experts were requested to give (UPCI-I) Pavement distresses and characteristic deflection were selected as the performance indicators for the first approach of UPCI. In Level 1 of the AHP process, the relative
225
their opinion regarding whether, they give more importance to the pavement distress than to characteristic deflection or vice versa while prioritizing roads for maintenance and also to quantify the relative importance.
International Journal for Traffic and Transport Engineering, 2017, 7(2): 216 - 231
But there are various types of distresses prevailing on these roads and hence, each of those distresses will be having relative importance among themselves, as to which distress should be given priority. So the types of distresses are included as sub criteria under the criterion distress in Level 2. At this level the relative importance of distresses
were established and the comparison matrix was established. Sub criteria considered under distress included the various distresses observed on the selected roads, namely ravelling, pothole and edge failure. The final weight matrix of the criteria as well as sub criteria is shown in Tables 9 and 10 respectively.
Table 9 Pair Wise Comparison Matrix of Criteria with Respect to Prioritization Distress
Deflection
Distress
1
1/3
Deflection
3
1
Table 10 Pair Wise Comparison Matrix of Sub-Criteria with Respect to the Criterion Distress Ravelling
Pothole
Edge Failure
Ravelling
1
1/8
1/4
Pothole
8
1
2
Edge Failure
4
1/2
1
In Table 9, the criteria listed on the left are one by one compared with criterion listed on top, as to which one is important with respect to goal of prioritizing the roads in the network (for example, distress to distress comparison, it is ‘1’ (one)). In Table 10, the sub criteria on the left are compared with the sub criteria on top as to their importance with respect to the criteria distress. Using the weight matrix, priority vectors of each criterion and each sub criteria were found out using Eigenvector method. The sum of columns in the matrix was found out and each element in the column was divided by the column sum. Then the average of the row was calculated to obtain the priority
vector. The consistency of the judgments was also checked using Saaty’s method (Saaty, 2008). Software developed by the authors to perform the Analytic Hierarchy Process was run for the prioritization of the selected road stretches. Number of roads in the network, number and types of distresses observed on the road stretches and the analysis period were given as input. The critical distress intensities for pavement age varying from two to six years predicted using probabilistic prediction models were also given as input. The priorities generated from the program for the criteria and for the sub criteria using the Eigenvector method are shown in Table 11 and Table 12.
226
Rose S. et al. Development of Probabilistic Deterioration Models and Prioritisation of Low Volume Roads for Maintenance
Table 11 Priority Vector Obtained for the Criteria
Table 12 Priority Vector Obtained for the Subcriteria
Criteria
Priority Vector
Criteria
Priority Vector
Distress
0.25
Ravelling
0.077
Deflection
0.75
Pothole
0.615
Edge Failure
0.307
The weight matrix of roads with respect to each type of distress and deflection was also generated using the developed software. The pair wise comparison of the roads on the basis of each criterion was done using the field data which was given as initial input. While considering the distress criterion, alternatives were compared based on each sub criteria. Since the pair wise comparisons were made on the basis of actual field data, there was no necessity for checking the consistency of the matrix. Similarly priority vector of roads with respect to def lection was generated using the software. The priorities obtained for the sub criteria under the distress criteria shown in Table
12 were weighed by the priority of their parent criterion distress (0.25) shown in Table 11 to obtain their global priority. In the synthesis step, the priorities obtained for the roads with respect to each sub criteria was multiplied with the corresponding global priority of the sub criteria and was summed up, to obtain the overall priority of each road. A sample synthesis at a pavement age of six years to obtain the overall priority is shown in Table 13 and the overall priority of each road over the analysis period is shown in Table14. Then the roads were ranked for maintenance based on the priority values. The ranking of roads thus obtained in each year of analysis period is shown in Table 15.
Table 13 Synthesis to Obtain Global Priority Deflection (0.75)
Overall Priority
---
---
0.07
0.75
----
0.006 0.005 0.003 0.004 0.010 0.004 0.007 0.003 0.002 0.019 0.003 0.003 0.003 0.004
0.045 0.069 0.054 0.033 0.027 0.061 0.036 0.072 0.043 0.015 0.075 0.132 0.062 0.026
0.05529 0.08914 0.07321 0.04861 0.04750 0.07862 0.05951 0.08549 0.05722 0.04171 0.08566 0.15540 0.08160 0.04078
Criteria Weight
Distress (0.25)
Sub Criteria Weight
Ravelling (0.077)
Pothole (0.615)
Edge Failure (0.307)
0.019
0.15
0.002 0.002 0.002 0.001 0.001 0.001 0.000 0.001 0.001 0.001 0.001 0.001 0.004 0.001
0.002 0.013 0.013 0.011 0.010 0.013 0.016 0.009 0.011 0.007 0.007 0.020 0.013 0.010
Road ID
Global Weight (Criteria*Sub Criteria) R1 R2 R3 R4 R5 R6 R7 R8 R9 R10 R11 R12 R13 R14
227
International Journal for Traffic and Transport Engineering, 2017, 7(2): 216 - 231
Table 14 Priority Rating of Roads Obtained for the Analysis Period using UPCI-I Road ID Age (Years)
Priority Rating of Roads for Varying Pavement Age 2
3
4
5
6
R1
0.056
0.059
0.055
0.055
0.055
R2
0.087
0.086
0.088
0.091
0.089
R3
0.084
0.079
0.077
0.077
0.073
R4
0.059
0.055
0.048
0.047
0.049
R5
0.045
0.052
0.045
0.049
0.047
R6
0.090
0.076
0.079
0.079
0.079
R7
0.037
0.052
0.055
0.051
0.059
R8
0.090
0.087
0.087
0.088
0.086
R9
0.062
0.060
0.058
0.054
0.057
R10
0.033
0.031
0.037
0.041
0.042
R11
0.095
0.095
0.088
0.088
0.086
R12
0.156
0.151
0.162
0.159
0.155
R13
0.072
0.077
0.077
0.078
0.082
R14
0.034
0.041
0.045
0.043
0.041
Table 15 Priority Rating of Roads Obtained for the Analysis Period using UPCI-I Road ID Age (Years) R1
Priority Rating of Roads for Varying Pavement Age 2
3
4
5
6
10
9
9
8
10
R2
5
4
3
2
2
R3
6
5
7
7
7
R4
9
10
11
12
11 12
R5
11
12
13
11
R6
4
7
5
5
6
R7
12
11
10
10
8
R8
3
3
4
3
4
R9
8
8
8
9
9
R10
14
14
14
14
13
R11
2
2
2
4
3
R12
1
1
1
1
1
R13
7
6
6
6
5
R14
13
13
12
13
14
228
Rose S. et al. Development of Probabilistic Deterioration Models and Prioritisation of Low Volume Roads for Maintenance
3.3. Development of Unified Pavement maintenance and how much importance Condition Index Using Second Approach would they give. The final weight matrix of the criteria is shown in Table 16. The priority (UPCI-II) vectors obtained for the criteria are shown in Table 17. Roads were compared with respect to each of the criteria and comparison matrix was arrived at. Then overall priority of the roads with respect to both criteria was arrived using the methodology explained in section 3.2. The overall priority thus obtained was used to rank the roads for maintenance. The priority ranking of the roads over the analysis years is shown in Table 18.
Roughness and characteristic def lection were selected as the performance indicators for the second approach of UPCI. In Level 1 of the AHP process, the relative importance of the criteria, roughness and def lection was established using Delphi technique. Experts were requested to give their opinion regarding whether, they give importance to the amount of roughness or to the amount of def lection while prioritizing roads for
Table 16 Pair Wise Comparison Matrix of Criteria with Respect to Prioritization Roughness Deflection
Roughness 1 3
Deflection 1/3 1
Table 17 Priority Vector Obtained for the Criteria Criteria Roughness Deflection
Priority Vector 0.25 0.75
Table 18 Priority Rating of Roads Obtained for the Analysis Period using UPCI-II Road ID
Priority Rating of Roads for Varying Pavement Age
Age (Years)
2
3
4
5
6
R1 R2 R3 R4 R5 R6 R7 R8 R9 R10 R11 R12 R13 R14
10 2 6 7 12 5 13 4 8 14 3 1 9 11
9 3 6 8 13 4 12 5 10 14 2 1 7 11
8 3 7 9 13 4 12 5 10 14 2 1 6 11
9 2 6 8 13 4 10 5 11 14 3 1 7 12
8 2 7 10 13 4 9 5 11 14 3 1 6 12
229
International Journal for Traffic and Transport Engineering, 2017, 7(2): 216 - 231
3.4. Comparison of Unified Pavement Condition Indices
the roads are having almost same ranking by both indices. It can be concluded that, prioritisation of roads can be done easily and correctly using year wise roughness data and deflection data with the aid of Analytic Hierarchy Process.
The ranking of roads for maintenance, obtained using both the indices are shown in Table 19. On observation it is seen that
Table 19 Comparison of Ranking Done Using the Developed Indices Ranking at sixth year using
R1
R2
R3
R4
R5
R6
R7
R8
R9
UPCI-I
10
2
7
11
12
6
8
4
9
13
3
1
5
14
UPCI-II
8
2
7
10
13
4
9
5
11
14
3
1
6
12
4. Summary and Conclusion A simple and reliable methodology for the prioritisation of low volume roads has been arrived at. The developed methodology was demonstrated through a case study on low volume road network comprising of 14 roads in the state of Kerala, India. For the purpose of rank ing the roads, over an analysis period, it was essential to have sound deterioration prediction models. Distress prediction models, both deterministic and probabilistic developed for low volume roads by the authors were used in the study. Prediction models for the progression of roughness and def lection were developed using both deterministic and probabilistic approach. Two methods were adopted to develop Unified Pavement Condition Index- i) by combining distresses a nd def lec t ion a nd i i) by combi n i ng roughness and deflection. A Software was developed to prioritise the roads based on Analytic Hierarchy Process, which is an efficient tool in decision making process. While developing the comparison matrices for roads based on various criteria, actual field data was used and hence error due to
R10 R11 R12 R13 R14
subjectivity was avoided. The ranking done using both the indices were compared and was found to be comparable. It is easier to develop unified pavement condition index by combining roughness and def lection, since the tediousness involved in the distress data collection can be avoided.
Acknowledgement Authors would like to acknowledge Centre for Engineering Research and Development (CERD) for the funding for the research.
References Binu, S.M. 2012. Development of pavement deterioration models for rural roads. Unpublished Thesis (PhD), University of Kerala, India. Chandran, S.; Isaac, K.P. Veeraragavan, A. 2007. Prioritisation of Low-Volume Pavement sections for Maintenance by Using Fuzzy Logic, Journal of the Transportation Research Board 1: 53-60. Juang, C.H.; Amirkhanian, S.N. 1992. Unified Pavement Distress Index for Managing Flexible Pavements, Journal of Transportation Engineering 118(5): 686-699.
230
Rose S. et al. Development of Probabilistic Deterioration Models and Prioritisation of Low Volume Roads for Maintenance
Martin, T.; Kadar, P. 2012. Scoping and development of probabi l ist ic road deter iorat ion models (No. AP-T201-12). Available from internet: < http:// worldcat.org/isbn/9781921991295>. Rose,S.; Mathew, B.S.; Isaac, K.P.; Abhaya, A.S. 2016. R isk Based Probabilistic Pavement Deterioration Prediction Models for Low Volume Roads, International Journal of Pavement Engineering: 1-10. Saaty, T.L. 2008. Decision Making with the Analytic Hierarchy Process, International Journal of Services Sciences 1(1): 83-98. Shah, Y.U.; Jain, S.S.; Tiwari, D. Jain, M.K. 2013. Development of overall Pavement Condition Index for Urban Road Network, Procedia-Social and Behavioural Sciences 104: 332-341.
231
Sha h i n, M.Y.; Da r ter, M.I.; Koh n, S.D. 1978. Development of Pavement Condition Index for Roads and Streets (No.CER L-IR-M-232), Construction Engineering Research Lab, Army Campign-III. Available from internet: . Smith, J.; Tighe, S. 2006, Analytic hierarchy process as a tool for infrastructure management, Transportation Research Record: Journal of the Transportation Research Board (1974): 3-9. Sun, L.; Gu, W. 2011. Pavement Condition Assessment Using Fuzzy Logic Theory and Analytic Hierarchy Process, Journal of Transportation Engineering 137: 648-655.