EXTERNAL SCIENTIFIC REPORT APPROVED: 23 June 2016
Development of probabilistic models for quantitative pathway analysis of plant pest introduction for the EU territory 1
Imperial College London, United Kingdom; 2University of Greenwich, United Kingdom; 3Food and Environment Research Agency, United Kingdom; 4Agra CEAS Consulting, Belgium J. Holt2, A.W. Leach1, J.D. Mumford1, A. MacLeod3, D. Tomlinson3, R. Baker3, M. Christodoulou4, L. Russo4, and A. Marechal4
Abstract This report demonstrates a probabilistic quantitative pathway analysis model that can be used in risk assessment for plant pest introduction into EU territory on a range of edible commodities (apples, oranges, stone fruits and wheat). Two types of model were developed: a general commodity model that simulates distribution of an imported infested/infected commodity to and within the EU from source countries by month; and a consignment model that simulates the movement and distribution of individual consignments from source countries to destinations in the EU. The general pathway model has two modules. Module 1 is a trade pathway model, with a Eurostat database of five years of monthly trade volumes for each specific commodity into the EU28 from all source countries and territories. Infestation levels based on interception records, commercial quality standards or other information determine volume of infested commodity entering and transhipped within the EU. Module 2 allocates commodity volumes to processing, retail use and waste streams and overlays the distribution onto EU NUTS2 regions based on population densities and processing unit locations. Transfer potential to domestic host crops is a function of distribution of imported infested product and area of domestic production in NUTS2 regions, pest dispersal potential, and phenology of susceptibility in domestic crops. The consignment model covers the several routes on supply chains for processing and retail use. The output of the general pathway model is a distribution of estimated volumes of infested produce by NUTS2 region across the EU28, by month or annually; this is then related to the accessible susceptible domestic crop. Risk is expressed as a potential volume of infested fruit in potential contact with an area of susceptible domestic host crop. The output of the consignment model is a volume of infested produce retained at each stage along the specific consignment trade chain.
© European Food Safety Authority, 2016
Key words: commodity, pathway model, plant health, probability, quantitative pathway analysis, pest risk assessment Question number: EFSA-Q-2011-00396 Correspondence:
[email protected]
www.efsa.europa.eu/publications
EFSA Supporting publication 2016:EN-1062
Quantitative Pathway Analysis QPAFood
Disclaimer: The present document has been produced and adopted by the bodies identified above as author(s). This task has been carried out exclusively by the author(s) in the context of a contract between the European Food Safety Authority and the author(s), awarded following a tender procedure. The present document is published complying with the transparency principle to which the Authority is subject. It may not be considered as an output adopted by the Authority. The European Food Safety Authority reserves its rights, view and position as regards the issues addressed and the conclusions reached in the present document, without prejudice to the rights of the authors. Acknowledgements: Part of this project, related to trade network models, was carried out in parallel with the DROPSA project under the European Union Seventh Framework programme for research, technological development and demonstration, grant agreement number 613678. The two projects benefitted from joint consideration of commodity trade movements into and within the borders of the EU. Suggested citation: Holt et al., 2016. Development of probabilistic models for quantitative pathway analysis of plant pest introduction for the EU territory. EFSA supporting publication 2016:EN-1062. 378 pp. © European Food Safety Authority, 2016 Reproduction is authorised provided the source is acknowledged.
www.efsa.europa.eu/publications
2
EFSA Supporting publication 2016:EN- 1062
Quantitative Pathway Analysis QPAFood
Summary This report includes a comprehensive description and discussion of each of four plant product-specific quantitative models that make up the QPA Food outputs, both on a general commodity pathway and a single commodity consignment level, covering the pathways for three fruits and for wheat from any combination of external source countries to the final distribution and consumption (or waste) at NUTS2 level throughout the EU28 territory. These examples cover cases for pests of apples (from N America), oranges (from S America), stone fruits (from N America) and wheat (from Australasia/S America). All of the models have a similar structure. The three fruit models are directed to uses involving fresh consumption or processing for human consumption; the wheat model is directed at uses for direct livestock feed or for milling. There is a review and a discussion on data sources for these specific cases and the selection and extraction of plant product-specific parameter values. Sensitivity analyses are reported and research needs are discussed for each case. This report, and four preliminary reports, are one strand of the delivery of this project. Four parameterised general pathway models and four parameterised consignment pathway models, executed in Excel spreadsheets with @Risk add-ins, have also been delivered. The general pathway models consist of two modules, a trade/infestation distribution module and a use-stream/transfer module. The consignment models each include four (fruit) or eight (wheat) trade chains relevant to different use-streams. These models will reach their full potential through use. In the course of building, parameterising and testing the models the developers have identified a range of both forward-focussed uses in risk analysis and backward-focussed forensic analyses. The models, both at the general and consignment levels, offer opportunities for exploring scenarios related to sources, infestation levels, trade volumes, timing, distribution patterns, and use-streams, and for management measures that might be employed on commodity pathways to mitigate risks.
www.efsa.europa.eu/publications
3
EFSA Supporting publication 2016:EN-1062
The present document has been produced and adopted by the bodies identified above as authors. This task has been carried out exclusively by the authors in the context of a contract between the European Food Safety Authority and the authors, awarded following a tender procedure. The present document is published complying with the transparency principle to which the Authority is subject. It may not be considered as an output adopted by the Authority. The European Food Safety Authority reserves its rights, view and position as regards the issues addressed and the conclusions reached in the present document, without prejudice to the rights of the authors.
Quantitative Pathway Analysis QPAFood
Table of contents Abstract ........................................................................................................................................ 1 Summary ....................................................................................................................................... 3 1. Introduction ....................................................................................................................... 6 1.1. Background and Terms of Reference as provided by the requestor ........................................ 6 1.1.1. Background ........................................................................................................................ 6 1.1.2. Terms of reference ............................................................................................................. 7 2. Description of Models .......................................................................................................... 9 2.1. Introduction ....................................................................................................................... 9 2.2. General models ................................................................................................................ 10 2.2.1. User Overview .................................................................................................................. 10 2.2.2. Imports ............................................................................................................................ 15 2.2.3. Infestation ....................................................................................................................... 15 2.2.4. Transhipment ................................................................................................................... 16 2.2.5. Distribution of infested commodity ..................................................................................... 16 2.2.6. Vulnerability ..................................................................................................................... 19 2.2.7. Contact ............................................................................................................................ 20 2.2.8. Summary tables of variables and calculations ..................................................................... 23 2.2.9. Output table and graphics ................................................................................................. 31 2.3. Consignment models ......................................................................................................... 34 2.3.1. User overview .................................................................................................................. 34 2.3.2. Model structure ................................................................................................................ 34 2.3.3. Model inputs .................................................................................................................... 35 2.3.4. Calculation of outputs ....................................................................................................... 36 3. Data Sourcing and Parameter Value Estimation .................................................................. 40 3.1. General data sourcing ....................................................................................................... 40 3.1.1. Data sources, selection and extraction of plant product-specific parameter values ................ 40 3.1.2. Data sources, selection and extraction of pest-specific parameter values.............................. 43 3.1.3. Additional data sources ..................................................................................................... 47 3.2. General model parameters ................................................................................................ 53 3.2.1. Oranges ........................................................................................................................... 53 3.2.2. Apples.............................................................................................................................. 62 3.2.3. Plums .............................................................................................................................. 72 3.2.4. Wheat .............................................................................................................................. 79 3.3. Consignment model parameters ........................................................................................ 86 3.3.1. Parameter Entry Template................................................................................................. 86 3.3.2. Selection of parameters to describe model variables ........................................................... 87 4. Sensitivity Analysis .......................................................................................................... 107 4.1. Introduction ................................................................................................................... 107 4.2. General model methods .................................................................................................. 107 4.3. Consignment model methods .......................................................................................... 111 4.4. General model results ..................................................................................................... 112 4.4.1. Orange model ................................................................................................................ 112 4.4.2. Apple model ................................................................................................................... 120 4.4.3. Plum model .................................................................................................................... 129 4.4.4. Wheat model .................................................................................................................. 138 4.5. Consignment model results ............................................................................................. 146 4.5.1. Orange model ................................................................................................................ 146 4.5.2. Apple model ................................................................................................................... 149 4.5.3. Plum model .................................................................................................................... 152 4.5.4. Wheat model .................................................................................................................. 155
www.efsa.europa.eu/publications
4
EFSA Supporting publication 2016:EN-1062
The present document has been produced and adopted by the bodies identified above as authors. This task has been carried out exclusively by the authors in the context of a contract between the European Food Safety Authority and the authors, awarded following a tender procedure. The present document is published complying with the transparency principle to which the Authority is subject. It may not be considered as an output adopted by the Authority. The European Food Safety Authority reserves its rights, view and position as regards the issues addressed and the conclusions reached in the present document, without prejudice to the rights of the authors.
Quantitative Pathway Analysis QPAFood
4.6. Comparison of models .................................................................................................... 160 4.6.1. General models .............................................................................................................. 160 4.6.2. Consignment models ....................................................................................................... 168 5. Research Needs .............................................................................................................. 172 6. Conclusions .................................................................................................................... 173 6.1. Potential to build quantitative pathway models ................................................................. 173 6.1.1. Data limitations that limit quantification ........................................................................... 173 6.1.2. Intrinsic limitations to quantification................................................................................. 174 6.1.3. Value of quantitative models in pathway analysis .............................................................. 174 6.2. Level of detail in models.................................................................................................. 174 6.2.1. Problems in high detail .................................................................................................... 175 6.2.2. Benefits in high detail ..................................................................................................... 175 6.2.3. Approach to parameterisation which allows variable detail ................................................ 175 6.3. Generality in the models ................................................................................................. 175 6.3.1. A general fruit model and a general grain model .............................................................. 175 6.3.2. Provision of a tool for other pests and commodities .......................................................... 176 6.4. Features of the tools provided ......................................................................................... 176 6.4.1. Insights from the case studies ......................................................................................... 176 6.4.2. Insights of wider importance ........................................................................................... 177 6.4.3. Potential contribution to risk management and plant health .............................................. 177 References ................................................................................................................................ 178 Glossary and Abbreviations ......................................................................................................... 194 Appendix A – Case study: Sweet orange from all countries with potential infestation by Xanthomonas citri pv. Citri .............................................................................................. 196 Appendix B – Case study: Pome fruit (apples) from USA and Canada with potential infestation by Cydia prunivora .............................................................................................................. 221 Appendix C – Case study: Stone fruit (plums) from USA or Canada with potential infestation by Conotrachelus nenuphar ................................................................................................. 258 Appendix D – Case study: Wheat from South America and Oceania with potential infestation by Listronotus bonariensis ................................................................................................... 281 Appendix E – Practical guidance on spatial data sources ......................................................... 331 Appendix F – Practical guidance on information gathering and helpful data sources .................. 353
www.efsa.europa.eu/publications
5
EFSA Supporting publication 2016:EN-1062
The present document has been produced and adopted by the bodies identified above as authors. This task has been carried out exclusively by the authors in the context of a contract between the European Food Safety Authority and the authors, awarded following a tender procedure. The present document is published complying with the transparency principle to which the Authority is subject. It may not be considered as an output adopted by the Authority. The European Food Safety Authority reserves its rights, view and position as regards the issues addressed and the conclusions reached in the present document, without prejudice to the rights of the authors.
Quantitative Pathway Analysis QPAFood
1.
Introduction
1.1.
Background and Terms of Reference as provided by the requestor
This contract/grant was awarded by EFSA to: Contractor/Beneficiary: Imperial College Consultants Ltd (ICON) Contract/Grant title: Development of probabilistic models for quantitative pathway analysis of plant pest introduction for the EU territory Contract/Grant number: CFT/EFSA/PLH/2011/05
1.1.1.
Background
The EFSA Scientific Panel on Plant Health (hereinafter, the PLH Panel) provides independent scientific advice on the risks posed by organisms which can cause harm to plants, plant products or plant biodiversity in the European Community. The PLH Panel reviews and assesses those risks with regard to the safety and security of the food chain to assist risk managers in taking effective and timely decisions on protective measures under the Council Directive 2000/29/EC to prevent the introduction and further spread of organisms considered harmful to plants or plants products in the European Community. On request, the PLH Panel prepares and evaluates pest risk assessments and identifies and/or evaluates the effectiveness of potential risk management measures in reducing the risk of introduction and/or spread of a harmful organism. In general, these requests relate to the risk for the whole EU territory. The probabilities of introduction and spread of plant pests may be assessed by quantitative or qualitative approaches. When a qualitative approach is followed, that may include quantitative elements. Where quantitative elements are included, transparency requires that every element of the calculation or mathematical modelling is communicated and justified, with a clear description of the model used, its accuracy and the parameter estimation. For quantitative models it is recommended to perform an uncertainty and sensitivity analysis. Quantitative probabilistic models have been used in several instances in risk assessment to estimate the probabilities of introduction and spread of plant pests (Fowler et al., 2006; Peterson et al., 2009; Roberts et al., 1998; Stansbury et al., 2002). The PLH Panel currently applies in its opinions quantitative methods for the assessment of climate suitability for establishment and of spread of plant pests. With regard to the quantitative assessment of the probability of introduction, the PLH Panel has evaluated in 2010 a quantitative pathway analysis of the likelihood of Tilletia indica M. introduction into EU with importation of US wheat. This review allowed EFSA to highlight the key parameters of the quantitative pathway analysis model, identified though sensitivity analysis, but it also showed that the proposed model did not consider the possibility of introduction of the pathogen through a single infected consignment. Probabilistic pathway analyses can be used to evaluate quantitatively the probabilities of introduction of plant pests. This method is well known in exposure assessment of the human population to chemicals (Cullen and Frey, 1999), but needs to be adapted to the specific conditions and datasets for plant health risk assessment. The production and processing of the plant product in a third country, the transportation process, the processing and marketing in the EU after importation, including the fate of its waste- and by-products, are all aspects to be considered until the final step of the transfer of the plant pest to a suitable plant host. This can be done as a global model for the whole EU with time component or as a single consignment model. The probabilistic pathway analysis approach allows for quantitative comparison between different pathways of introduction as well as for comparison of the risk reduction effects of various risk mitigation measures along a given pathway. Moreover, though sensitivity analysis, valuable information can be obtained on major parameters affecting the probabilities of introduction of a given
www.efsa.europa.eu/publications
6
EFSA Supporting publication 2016:EN-1062
The present document has been produced and adopted by the bodies identified above as authors. This task has been carried out exclusively by the authors in the context of a contract between the European Food Safety Authority and the authors, awarded following a tender procedure. The present document is published complying with the transparency principle to which the Authority is subject. It may not be considered as an output adopted by the Authority. The European Food Safety Authority reserves its rights, view and position as regards the issues addressed and the conclusions reached in the present document, without prejudice to the rights of the authors.
Quantitative Pathway Analysis QPAFood
plant pest along a pathway. Sensitivity and uncertainty analysis may also support the identification of knowledge gaps and recommendations for future research topics.
1.1.2.
Terms of reference
EFSA launched an outsourced project, through an open call, to support the PLH Panel scientific opinions by the development of probabilistic models for quantitative pathway analysis of plant pest introduction for the EU territory. The project was to be conducted using practical case studies as indicated below. The tender was divided into two Lots, one lot on quantitative analysis of pest introductions with edible plant products (Lot 1), and one lot for non-edible plant products (Lot 2). This report deals only with Lot 1 on edible plant products. The probabilistic models for quantitative pathway analysis of plant pest introductions for the EU territory were to be developed for four case studies covering the following groups (one case study for each group) of edible plant products (for food and feed): 1.
Fresh fruit: a pome fruit (apple or pear)
2.
Fresh fruit: a stone fruit (apricot or cherry or nectarine or peach or plum)
3.
Fresh fruit: a citrus fruit (clementine or grapefruit or lemon or lime or mandarin or sweet orange)
4.
Cereals seeds for food and feed
Overall objective To provide EFSA with probabilistic models for quantitative pathway analysis of plant pest introduction for the EU territory through the importation of edible plant products (for food and feed). A probabilistic pathway analysis is a one-directional compartment model with stochastic transitions. This pathway model should include all treatments, transportation, processing and distribution of the plant product (including losses, waste-products and by-products) from a Third Country of origin until the final step of the transfer of the pest to a suitable plant host in the EU. The models should be generic, covering all aspects of the pathway, but with possibility of application to the different types of plant pests (e.g. viruses and virus-like organisms, bacteria, fungi, nematodes, insects and mites). The stochastic component models temporal, regional or other variations, and may also include the uncertainty of the estimated model components (parameters etc.). Each pathway has to be modelled twice: 1) as an overall approach by a general model at EU Member States level considering the total flow in each European country on a yearly and/or monthly scale; 2) as a single consignment approach, with consideration of geographical distribution and real time scenario, following a single lot of an imported plant product and including as well the distribution of distances as the distribution of durations for transport, storage and processing. Specific objectives The specific objectives of the contract resulting from the present procurement procedure are as follows: For each of the four groups of edible plant products, the contractor should develop a generic probabilistic pathway model. For each of the four groups of edible plant products, the contractor should select one plant product from those listed in the description above. For each chosen plant product, plant product-specific model parameters should be identified and values assigned and a plantproduct specific model should be developed. To obtain the relevant parameters, the contractor should carry out a comprehensive search of technical and scientific information and a review of data sources needed for the determination of all parameters and should discuss on the optimal selection and extraction of parameters values. For the search and review of parameters and its reporting strategy, consideration should be given to the relevant
www.efsa.europa.eu/publications
7
EFSA Supporting publication 2016:EN-1062
The present document has been produced and adopted by the bodies identified above as authors. This task has been carried out exclusively by the authors in the context of a contract between the European Food Safety Authority and the authors, awarded following a tender procedure. The present document is published complying with the transparency principle to which the Authority is subject. It may not be considered as an output adopted by the Authority. The European Food Safety Authority reserves its rights, view and position as regards the issues addressed and the conclusions reached in the present document, without prejudice to the rights of the authors.
Quantitative Pathway Analysis QPAFood
sections of the Guidance of EFSA on the “application of systematic review methodology to food and feed safety assessments to support decision making” 1. 0F
For each chosen plant product, one associated plant pest should be selected by the contractor, the plant pest-related and plant host-related parameters should be determined and values assigned and a final pathway analysis probabilistic model should be developed For each final pathway analysis probabilistic model a sensitivity analysis should be performed
1
EFSA, 2010. Application of systematic review methodology to food and feed safety assessments to support decision making. EFSA Guidance for those carrying out systematic review. Available at http://www.efsa.europa.eu/en/scdocs/doc/1637.pdf.
www.efsa.europa.eu/publications
8
EFSA Supporting publication 2016:EN-1062
The present document has been produced and adopted by the bodies identified above as authors. This task has been carried out exclusively by the authors in the context of a contract between the European Food Safety Authority and the authors, awarded following a tender procedure. The present document is published complying with the transparency principle to which the Authority is subject. It may not be considered as an output adopted by the Authority. The European Food Safety Authority reserves its rights, view and position as regards the issues addressed and the conclusions reached in the present document, without prejudice to the rights of the authors.
Quantitative Pathway Analysis QPAFood
2.
Description of Models
2.1.
Introduction
In Section 2 of this report, the general and consignment Excel models that make up the QPAFood outputs are described in detail, including their implementation in @RISK. This is followed in Section 3 by a comprehensive description of the information gathered about the commodities and case study pests and a description of how this was used to estimate parameter values for the models. Appendices 1-4 provide additional detail on the parameters for the four specific cases; Appendices 5 and 6 cover data sources and collection. Section 4 provides a description of sensitivity analyses carried out. Section 5 describes future research needs and Section 6 draws some general conclusions from the work. The overall objective of the project is to provide EFSA with probabilistic models for quantitative pathway analysis of plant pest introduction for the EU territory through the importation of edible plant products (for food and feed). Four commodities and associated pests were selected for the project (Table 2.1.01). Table 2.1.01: Quantitative Pathway Analysis Lot 1, Food: Case study commodities and pests
Commodity
Pest
Common name
Case study countries
Pome fruit:
Cydia prunivora (Walsh)
Fresh apples
Lesser apple worm
Canada, USA
(Lepidoptera: Tortricidae)
Stone fruit:
Conotrachelus nenuphar
Plum weevil
Canada, USA
Fresh plums
(Herbst) (Coleoptera: Curculionidae)
Citrus:
Xanthomonas citri citri
Asiatic citrus canker
Any country where X. citri citri occurs (many countries)
Cereals:
Listronotus bonariensis
Wheat
(Kuschel) (Coleoptera: Curculionidae)
Argentine stem weevil
Argentina, Bolivia, Brazil, Chile, Uruguay, Australia, New Zealand
Sweet oranges
As specified in the technical specification for the project, quantitative probabilistic pathway models have been provided which follow the form of a one-directional compartment model with stochastic transitions. The models describe the transportation from source countries to, and transhipment between, EU Member States, the distribution of the plant products, the uses in retail and processing (including the associated losses, waste-products and by-products) described geographically at NUTS2, and the potential for the infestation carried on the commodity to transfer to domestic production within each MS. The models provided are generic for each commodity so that they can be used with any pest associated with the commodity, so they provide the basis for analysing all source-commodity pathways into the EU. The models presented have been parameterised for the specific pests chosen for the project. Uncertainty in model components has been incorporated by implementing the models using @RISK software, an add-in for the basic Excel spreadsheet. The design of the models incorporates aspects of pest species risk analysis as well as pathway specific risk analysis. The distinction is that the pest specific analysis focusses on the harmful agent and the pathway analysis focusses on the route of entry and potential transfer to a host where establishment could occur. For multiple pests on a specific pathway the models would need to be run for each pest species separately (with only the pest parameters adjusted). For multiple pathways and
www.efsa.europa.eu/publications
9
EFSA Supporting publication 2016:EN-1062
The present document has been produced and adopted by the bodies identified above as authors. This task has been carried out exclusively by the authors in the context of a contract between the European Food Safety Authority and the authors, awarded following a tender procedure. The present document is published complying with the transparency principle to which the Authority is subject. It may not be considered as an output adopted by the Authority. The European Food Safety Authority reserves its rights, view and position as regards the issues addressed and the conclusions reached in the present document, without prejudice to the rights of the authors.
Quantitative Pathway Analysis QPAFood
a common pest the model could be run for the various pathways either independently by source or with groups of source countries included together. As required in the technical specification, two model types are provided for each commodity; these are described in the report as the general models and the consignment models. The general models are models at EU Member State level that consider the total flow of a commodity from specified source countries into each European country on a monthly scale. The consignment models consider the durations for transport, storage and processing associated with each of the routes the commodity could take on entry to the EU by following a single lot of an imported plant product. Pest survival or development in the consignment is related to the duration and conditions of the stages along the specific route. To obtain the relevant parameters and variables for both model types, a series of comprehensive searches of the technical and scientific literature were carried out to review the data sources needed for the determination of all parameters. These reviews are provided as separate appendices of the report (Appendices 1-4), one for each of the four case studies. They discuss selection and extraction of parameters and values, the results of which have been tabulated in the body of the report for each type of model for each case study. The case study Appendices inform the parameterisation of both the general and consignment models. The general models are fully generic with respect to the commodity. All calculations are always carried out for the entire trade chain network of the commodity so that no structural changes to the models are required to use them for other pests; only the pest-specific parameters need to be changed. The consignment models originally presented were conceived as describing particular pathways through the general model as followed by the individual consignment being considered. Those described and provided here now follow a different logic. They are generic with respect to the commodity so that only the pest-specific parameters need be changed to use them for other pests. They offer a different perspective of the problem from the general model by describing transitions between steps in the trade chain network in terms of the durations of each step and therefore the total duration to any point on the chain. The implications for the probability and the level of pest infestation at each step are calculated as with the general model.
2.2. 2.2.1.
General models User Overview
Software requirements The model requires Microsoft Excel 2010 and Palisade @Risk v6 add-in for Excel software. Please note that the model will run in Excel 2007 but some of the conditional formatting functionality may be lost; this has no effect on the output of the model. Generality of the model structure The structure of Apple general model is identical to that of the other fruit commodity general models, so that when a user is familiar with one model the use of the others is straightforward. The structure of the wheat general model follows a similar structure but is modified to reflect the differences in pathways, uses and losses; nevertheless when one is familiar with the fruit model then using the wheat general model will also be relatively straightforward and vice versa. Model flow and annotation The “Main” worksheet of the model provides an interactive flow-chart of the model’s structure. Each node (button) in the flowchart is clickable to navigate to the worksheet in which the data or submodel operates. The buttons are grouped in, conceptually related, coloured boxes and linked by
www.efsa.europa.eu/publications
10
EFSA Supporting publication 2016:EN-1062
The present document has been produced and adopted by the bodies identified above as authors. This task has been carried out exclusively by the authors in the context of a contract between the European Food Safety Authority and the authors, awarded following a tender procedure. The present document is published complying with the transparency principle to which the Authority is subject. It may not be considered as an output adopted by the Authority. The European Food Safety Authority reserves its rights, view and position as regards the issues addressed and the conclusions reached in the present document, without prejudice to the rights of the authors.
Quantitative Pathway Analysis QPAFood
arrows to show the flow of information through the model. User input cells / sheets are highlighted in pale blue, all other cells are locked to prevent accidental editing of the model structure. The model has been designed to be as self-explanatory as possible and, to this end, every worksheet in the model contains a text box description of the data/workings of that particular sheet and how it relates to other sections. The four general models are each provided as two modules: Module 1 concerns the initial commodity infestation, import and transhipment; Module 2 concerns distribution of the infested commodity, host vulnerability and potential contact which could lead to pest transfer. The output of Module 1 is the total infested commodity arriving in each MS in each month and includes both directly imported and net transhipped volumes. When using the models, the transfer of values from the final table of Module 1 to Module 2 is achieved by browsing and selecting the required file from within Module 2. The models were split into two modules because Module 1 contains a series of Visual Basic (VB) macros that calculate commodity movement through the trade network. These take some minutes to run but this exercise need only be carried out once for any particular set of trade data that the user wishes to use. Splitting the model into two modules makes sensitivity analysis easier because multiple sets of trade data can be stored as a series of Module 1 files without on each occasion having to run the macros to investigate a new scenario. This is useful because the VB macros which collate information from the trade databases in Module 1 are incompatible with the use of @RISK functions so it is important to provide an easily-workable approach to investigate the effects of variation in trade. The remainder of the model, contained in Module 2, does not require the use of VB macros but makes use of both direct database inputs and parameters which are described by @Risk distributions. The models are accessed and run from a ‘Main page’ which also shows the model structure and sequence of calculations. All models have a similar Module 1 main page (Fig 2.2.01a); the Module 2 main pages for the three fruit cases are also the same (Fig 2.2.01b) but differ from that for wheat (Fig 2.2.01c) to reflect the different use, loss and waste streams which apply. Example main pages for the commodity, apples, are shown in Figs 2.2.01a and 2.2.01b. The complete model structure is shown on the main page of both modules. Those parts of the model structure which are not active in the particular module are indicated with pale grey text.
www.efsa.europa.eu/publications
11
EFSA Supporting publication 2016:EN-1062
The present document has been produced and adopted by the bodies identified above as authors. This task has been carried out exclusively by the authors in the context of a contract between the European Food Safety Authority and the authors, awarded following a tender procedure. The present document is published complying with the transparency principle to which the Authority is subject. It may not be considered as an output adopted by the Authority. The European Food Safety Authority reserves its rights, view and position as regards the issues addressed and the conclusions reached in the present document, without prejudice to the rights of the authors.
Quantitative Pathway Analysis QPAFood
EFSA QPAFood Model - Apples PRODUCTION
Proportion Vol infested by Country by Month
Marketed Production by EU Country by Month
IMPORTS
Imports by Source Country by Month
INFESTED TRANSHIPPED (EU-INTRA)
INFESTED IMPORTS
Input: Infestation levels of Imports by Country by Month
Input: Processing percentage by Country by Month
Processing Units by NUTS2
Input: Processing Waste Streams
Infested PROCESSED Waste by NUTS2 by Month
Vol of Infested Commodity Transhipped from MS to MS EXPORTS EU-EXTRA
CONTACT
DISTRIBUTION of INFESTED COMMODITY
Infested Imports RETAILED by NUTS2 by Month
Input: Pest viability after Processing and Retail
Infested RETAILED Waste by NUTS2 by Month
EU-Extra Exports Infested Imports by Source Country by Month
Imports by All Sources by Month
EU28 Retained Commodity
Annual Population data by NUTS2
ALL INFESTED IMPORTS
Infested Imports by All Sources by Month
Total Infested Commodity (Imports and net Transhipments)
Annual Livestock Units by NUTS2
Vulnerability Index by NUTS2 - Retail and Processing
Commodity Area by NUTS2
Processed imports with viable pest
Retailed imports with viable pest
Input: Retail Waste Stream VULNERABILITY
NUTS2 Area
Input: Vulnerable crop phenology
Contact potential by NUTS2 by Month
Module 1 of EFSA QPA Food Model: Import, Infestation levels, Transhipment
Parameter Details Table
Figure 2.2.01a: The main page of the general models; a) The Module 1 main page has the same layout for all models, the example of apple is shown
www.efsa.europa.eu/publications
12
EFSA Supporting publication 2016:EN-1062
The present document has been produced and adopted by the bodies identified above as authors. This task has been carried out exclusively by the authors in the context of a contract between the European Food Safety Authority and the authors, awarded following a tender procedure. The present document is published complying with the transparency principle to which the Authority is subject. It may not be considered as an output adopted by the Authority. The European Food Safety Authority reserves its rights, view and position as regards the issues addressed and the conclusions reached in the present document, without prejudice to the rights of the authors.
Quantitative Pathway Analysis QPAFood
EFSA QPAFood Model - Apples PRODUCTION
Proportion Vol infested by Country by Month
Marketed Production by EU Country by Month
IMPORTS
Imports by Source Country by Month
INFESTED TRANSHIPPED (EU-INTRA)
INFESTED IMPORTS
Input: Infestation levels of Imports by Country by Month
Input: Processing percentage by Country by Month
Processing Units by NUTS2
Input: Processing Waste Streams
Infested PROCESSED Waste by NUTS2 by Month
Vol of Infested Commodity Transhipped from MS to MS EXPORTS EU-EXTRA
CONTACT
DISTRIBUTION of INFESTED COMMODITY
Infested Imports RETAILED by NUTS2 by Month
Processed imports with viable pest
Input: Pest viability after Processing and Retail
Infested RETAILED Waste by NUTS2 by Month
Retailed imports with viable pest
EU-Extra Exports Infested Imports by Source Country by Month
Imports by All Sources by Month
EU28 Retained Commodity ALL INFESTED IMPORTS
Infested Imports by All Sources by Month
Total Infested Commodity (Imports and net Transhipments)
Annual Population data by NUTS2
Annual Livestock Units by NUTS2
Vulnerability by NUTS2 - Retail and Processing
Input: Retail Waste Stream VULNERABILITY
Input: Vulnerable crop phenology
Contact potential by NUTS2 by Month
OUTPUT TABLES & GRAPHICS
Commodity Area by NUTS2
NUTS2 Area
Summary
Module 2 of EFSA QPA Food Model: Distribution, Waste, Vulnerability and Contact
Parameter Details Table
Figure 2.2.01b: The main page of the general models; b) The Module 2 main page has the same layout for all fruit models, the example of apple is shown
www.efsa.europa.eu/publications
13
EFSA Supporting publication 2016:EN-1062
The present document has been produced and adopted by the bodies identified above as authors. This task has been carried out exclusively by the authors in the context of a contract between the European Food Safety Authority and the authors, awarded following a tender procedure. The present document is published complying with the transparency principle to which the Authority is subject. It may not be considered as an output adopted by the Authority. The European Food Safety Authority reserves its rights, view and position as regards the issues addressed and the conclusions reached in the present document, without prejudice to the rights of the authors.
Quantitative Pathway Analysis QPAFood
EFSA QPAFood Model - Wheat PRODUCTION
Proportion Vol infested by Country by Month
Marketed Production by EU Country by Month
IMPORTS
Imports by Source Country by Month
INFESTED TRANSHIPPED (EU-INTRA)
INFESTED IMPORTS
Input: Infestation levels of Imports by Country by Month
Vol of Infested Commodity Transhipped from MS to MS
Infested Imports by Source Country by Month
Imports by All Sources by Month
Input: Pest viability Infested PORT Losses by NUTS2 by Month
Input: % PORT LOSSES
EU28 Retained Commodity
Ports by NUTS2
PORT Losses with viable pest
Input: MILL and OTHER USES Input: % MILL LOSSES
Infested MILL Losses by NUTS2 by Month
MILLS by NUTS2
EXPORTS EU-EXTRA
EU-Extra Exports
CONTACT
DISTRIBUTION of INFESTED COMMODITY
Infested OTHER Losses by NUTS2 by Month
Input: % OTHER LOSSES
OTHER by NUTS2
Input: % ONFARM LOSSES
Infested ON-FARM Losses by NUTS2 by Month
Infested DOMESTIC Waste by NUTS2 by
Annual Population data by NUTS2
Input: % to DOMESTIC WASTE
ALL INFESTED IMPORTS
Infested Imports by All Sources by Month
Total Infested Commodity (Imports and net Transhipments)
VULNERABILITY
OTHER Losses with viable pest ON-FARM Losses with viable pest
Input: ON-FARM and HUMAN USES Annual Livestock Units by NUTS2
MILL Losses with viable pest
DOMESTIC Waste with viable pest
Input: Vulnerable crop phenology Contact potential by NUTS2 by Month
Vulnerability Index by NUTS2 Retail and Processing
Commodity Area by NUTS2
OUTPUT TABLES & GRAPHICS
NUTS2 Area
Summary
Module 2 of EFSA QPA Food Model: Distribution, Waste, Vulnerability and Contact
Parameter Details Table
Figure 2.2.01c: The main page of the general models; c) The Module 2 main page for wheat.
www.efsa.europa.eu/publications
14
EFSA Supporting publication 2016:EN-1062
The present document has been produced and adopted by the bodies identified above as authors. This task has been carried out exclusively by the authors in the context of a contract between the European Food Safety Authority and the authors, awarded following a tender procedure. The present document is published complying with the transparency principle to which the Authority is subject. It may not be considered as an output adopted by the Authority. The European Food Safety Authority reserves its rights, view and position as regards the issues addressed and the conclusions reached in the present document, without prejudice to the rights of the authors.
Quantitative Pathway Analysis QPAFood
A series of ‘panels’ are used to distinguish different parts of the model: Imports, Infestation, Distribution of Infested Commodity, Vulnerability and Contact. Within each panel, text boxes provide links to a series of sheets which contain the model variables and within which the model calculations are performed. The arrows linking the text boxes indicate the conceptual flow and the sequence of calculation. Blue buttons indicate sheets with user input options; within those sheets pale blue cells indicate potential user input points. Text boxes on each sheet with inputs give instructions on the form of input values that can be entered; error traps prevent input of invalid values. At the bottom of the main sheet there is a button that shows the overall Parameter Details Table, which describes each parameter and the values that are used. First, the reasoning underlying the model, the model formulation and the variables are described. The description takes each panel of the model (Fig. 2.2.01), in turn.
2.2.2.
Imports
The commodity import data are obtained directly from Eurostat Data Explorer databases and provide monthly trade volumes of the commodity from the 261 countries/territories of the world, as listed in the databases, to the 28 EU Member States for the years 2010 through 2014. The 261 countries include the EU28 Member States themselves, so the database also provides the means of tracking shipments of the commodity between Member States. This is important in connection with the potential transshipment of commodity from outside the EU to a final destination country within the EU via an intermediate importing country within the EU. These trade data are contained within 261 sheets in the model (one per source country). These tables can be updated periodically directly from Eurostat. The Data Explorer database includes various aggregated regions as well as individual territories, so these must be unselected to give only the 261 distinct source countries/territories, which are then downloaded in the standard Eurostat format for inclusion in the model by pasting the Eurostat sheets. A macro is provided in the model to allow imports from all source countries to EU Member States to be collated in a single table. For aggregated commodities in Eurostat (such as stone fruits) the annual imports to key EU countries can be drawn from more disaggregated annual data in FAOStat and the proportion for the specific commodity can be applied to monthly Eurostat values. The databases incorporated in the general model currently give trade volumes for the most recent five years available (2010-2014) from all potential sources to all EU28 destinations. Specific sources or destinations relevant to particular pathways and pests can be examined from this complete set. Trade volumes representing alternative sets of years could be used if required.
2.2.3.
Infestation
While the QPAFood model is a quantitative commodity pathway model, the pest infestation component is specific to individual pest organisms that may occur on the pathway. The model is parameterized for the source countries of the pathways relevant to the specific pest. As in the case studies, this will usually involve relatively few of the full set of 261 countries. Infestation rates of the pests are obtained from records of at-harvest infestation in the source country, detection rates at export, and survival rates under the prevailing transport conditions (Appendices 1 to 4), or using upper limits that are based on EU phytosanitary standards or commercial contract standards. Infestation rate is measured by the units of the commodity which are infested (%). Infestation is parameterized in this way to reflect how it is recorded in plant health inspection data. There are implications for parameter units throughout the model. For direct transport to an EU Member State from a non-EU MS, the product of the trade volume (hundreds of kg) and infestation rate (%) gives the trade volume that is infested (in 100 kg units). Throughout the pathway, all potential transfer is considered in relation to infested trade volume on import, and parameter estimation is made in the context of this.
www.efsa.europa.eu/publications
15
EFSA Supporting publication 2016:EN-1062
The present document has been produced and adopted by the bodies identified above as authors. This task has been carried out exclusively by the authors in the context of a contract between the European Food Safety Authority and the authors, awarded following a tender procedure. The present document is published complying with the transparency principle to which the Authority is subject. It may not be considered as an output adopted by the Authority. The European Food Safety Authority reserves its rights, view and position as regards the issues addressed and the conclusions reached in the present document, without prejudice to the rights of the authors.
Quantitative Pathway Analysis QPAFood
2.2.4.
Transhipment
Where transport to an EU MS is via another importing intermediate EU MS, a measure of this transshipment of infested commodity to its final destination within the EU is calculated from that proportion of commodity potentially available for export in the intermediate state that has its origin in a pest-affected source country. The commodity available for export in the intermediate state includes any locally produced commodity in that state as well as that imported by that state; the sum of the two gives the total commodity available for potential export. The volume of commodity originating from pest-affected countries can be expressed as a proportion of this total. The volume of infested transshipments is then obtained by multiplying this proportion by the volume of trade in the commodity between Member States. This trade is already incorporated in the import panel (Fig. 2.2.01) and domestic production statistics of the commodity for all Member States are obtained from Eurostat. In calculating the transshipment volumes it is assumed that there is an equal likelihood of a MS exporting its own produce and produce that it has imported. Finally in Module 1, a table of combined infested volumes which includes both direct and transshipped imports is obtained by summing the directly imported and transshipped infested volumes. The infested export volume in this calculation is deducted, otherwise the transshipped volumes would be wrongly counted as direct imports to the state of initial EU entry. This table then provides the link to Module 2.
2.2.5.
Distribution of infested commodity
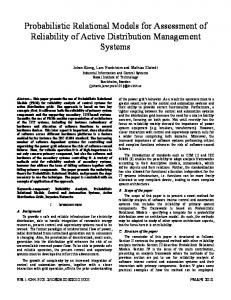
In the case of fruit commodities, two distribution routes for the commodity are considered, retailing of the fresh product and processing. Those types of processing which involve juicing and those which do not (e.g. dried fruit, baking ingredients) are considered separately because the nature of the waste/by-product differs. Three waste/by-product streams are modelled: whole rejected fruit (from juicing and non-juicing type of processing), peel, core and/or stone as appropriate for different fruit types (from juicing and non-juicing) and pulp/pomace (from juicing). In non-juicing types of processing, the peel, core, and/or stone may be removed initially. In juicing, the whole fruit is usually used so that peel, core and/or stone then form part of the pulp residue. In the case of oranges, peel is removed before juicing but with apples and plums it is not. The waste/by-product is destined either for animal feed (usually after further processing) or for land application (usually after composting) in proportions depending of fruit type (Appendices 1 to 3). Waste from retailed fresh fruit is categorized more simply, being either whole rejected fruit or peel, core and/or stone, all of which are destined for land application. This adds up to a total of twelve different combinations of possible waste streams, each with implications for pest survival and each of which is commodity specific (Fig. 2.2.02; Table 2.2.01). The distribution of the infested commodity between commodity use, by-product type and by-product use is modelled in the series of sheets associated with the distribution of the infested commodity. Estimates of the percentage of the commodity destined for the retail and processing routes was obtained from trade sources (Appendices 1 to 3). These values are collated as a 28 EU MS x 12 month table. Values differ between countries and months to reflect any known differences; otherwise an average figure is used. For example, Hungary has a very high proportion of apple processing use and France very low. The EU average for processing apples is 25%. Estimates of by-product type were taken from various sources as described in Appendix B. The proportion of by-product destined for land application and animal feed was also obtained from industry sources (Appendix B).
www.efsa.europa.eu/publications
16
EFSA Supporting publication 2016:EN-1062
The present document has been produced and adopted by the bodies identified above as authors. This task has been carried out exclusively by the authors in the context of a contract between the European Food Safety Authority and the authors, awarded following a tender procedure. The present document is published complying with the transparency principle to which the Authority is subject. It may not be considered as an output adopted by the Authority. The European Food Safety Authority reserves its rights, view and position as regards the issues addressed and the conclusions reached in the present document, without prejudice to the rights of the authors.
Quantitative Pathway Analysis QPAFood
Figure 2.2.02: Structure of the processing waste streams for fruit commodities Table 2.2.01: Twelve waste/by-product streams defined by possible combinations of commodity use, by-product type and by-product use Commodity use
By-product type
By-product use
Processing involving juicing
Rejected whole fruit
Land application Animal feed
Peel, core and/or stone
Land application Animal feed
Pulp / pomace
Land application Animal feed
Processing involving non-juicing
Rejected whole fruit
Land application Animal feed
Peel, core and/or stone
Land application Animal feed
Fresh fruit retail
Rejected whole fruit
Land application
Peel, core and/or stone
Land application
For the three fruit commodities, the distribution of the retailed portion of the commodity between the NUTS2 regions within each country is determined by the human population density, obtained from Eurostat. The proportion of the country total human population located in each NUTS2 region in the country is multiplied by the volume destined for retail in that country to give the volume going to retail in each NUTS2 region. Human population is used as the predictor of the location of end use of raw retailed product.
www.efsa.europa.eu/publications
17
EFSA Supporting publication 2016:EN-1062
The present document has been produced and adopted by the bodies identified above as authors. This task has been carried out exclusively by the authors in the context of a contract between the European Food Safety Authority and the authors, awarded following a tender procedure. The present document is published complying with the transparency principle to which the Authority is subject. It may not be considered as an output adopted by the Authority. The European Food Safety Authority reserves its rights, view and position as regards the issues addressed and the conclusions reached in the present document, without prejudice to the rights of the authors.
Quantitative Pathway Analysis QPAFood
The distribution of processing of the commodity between NUTS2 regions within each country is determined by an estimate of the numbers of fruit and vegetable processing enterprises in each NUTS2 region. The numbers of fruit and vegetable processors is available at NUTS1 level and the number of general food processors is at NUTS2. The estimate of numbers of fruit and vegetable processors at NUTS2 was obtained by assuming that they were distributed at NUTS2 level in the same geographic pattern as general food processors (Appendix B). In the case of wheat, losses of the commodity are considered in relation to the sequence from port to mill or “other” and then, for the milling stream, to farm and domestic consumption (Fig. 2.2.03 and Appendix D). Each point of loss has a pathway leading to that loss and the set of pathways is distinguished in the model. Eight waste/loss streams are defined by combinations of location and waste stream (Table 2.2.02). Losses at the port are recorded and the proportion of wheat imports at each port across the EU is estimated from figures for the tonnage of dry bulk agricultural products. The NUTS2 regions in which these ports are located were identified and the losses at port attributed accordingly. Industrial losses were attributed to NUTS2 region by the distribution of the commodity used in this way between the NUTS2 regions within each country, determined by the proportion of industrial plants categorized under NACE code 20.14, which includes fermentation of sugarcane, corn or similar to produce alcohol and esters, in each NUTS2 region. Losses at milling were attributed to NUTS2 region by the distribution of the milling of the commodity between the NUTS2 regions within each country, determined by the proportion of mills in each NUTS2 region. At the mill different product uses are considered and all have some associated losses. Estimates of the percentage of the commodity destined for use in human consumption and animal feed was obtained, as well as estimates of losses at milling.
Figure 2.2.03: Structure of the waste streams for wheat
www.efsa.europa.eu/publications
18
EFSA Supporting publication 2016:EN-1062
The present document has been produced and adopted by the bodies identified above as authors. This task has been carried out exclusively by the authors in the context of a contract between the European Food Safety Authority and the authors, awarded following a tender procedure. The present document is published complying with the transparency principle to which the Authority is subject. It may not be considered as an output adopted by the Authority. The European Food Safety Authority reserves its rights, view and position as regards the issues addressed and the conclusions reached in the present document, without prejudice to the rights of the authors.
Quantitative Pathway Analysis QPAFood
Table 2.2.02: Eight waste/loss streams defined by possible combinations of location and waste stream Location
Waste steam
Quantity
Port
Port losses
Losses (%)
Mill
Mill losses
Losses (%)
Other (Industrial/Bioethanol)
Industrial losses
Losses (%)
On-Farm
Whole grain Pre-animal losses
Losses (%)
Whole grain Manured losses
% of grain unaffected by alimentary processes
Milled Product Pre-animal losses
Losses (%)
Milled Product Manured losses
% of milled product unaffected by alimentary processes
Domestic waste
% of wheat products to land application
Human Consumer
The distribution of livestock-related commodity use between the NUTS2 regions within each country is determined by the proportion of livestock units in each NUTS2 region, obtained from Eurostat. In most cases data were available at NUTS2 resolution but in the cases of Germany and Croatia no information was available so an even distribution within these countries was used. The proportion of the country total livestock units located in each NUTS2 region in the country is multiplied by the volume used in that country to give the volume going to livestock use in each NUTS2 region. The end-use of grains destined for direct livestock use is expected to be well reflected by the location of livestock units.
2.2.6.
Vulnerability
Vulnerability concerns the potential for pest transfer if the pest is released from an imported commodity. The vulnerability of a NUTS2 region to transfer by an imported pest depends on two factors. Firstly, the greater the area of the NUTS2 region occupied by vulnerable hosts, the more likely there is an opportunity for pest contact. For each NUTS2 region the area occupied by the vulnerable crop is obtained from the Eurostat crop area database. Wild hosts may need to be added sometimes. Secondly, the greater the mobility of the pest, the greater is the opportunity for pest contact. A pest ‘footprint’ was calculated as the area that the pest or pests can potentially reach from a single release point in the period they can survive after release from the imported commodity (or within one month, whichever is the lesser). This area is calculated as the area of the circle with radius equal to the average linear distance that the pest can travel under ideal conditions; the area is expressed as a proportion of the NUTS2 area. For multiple pest release points the most conservative assumption is taken that the footprints do not overlap; pest escape from the imported commodity is usually a rare event so this may often be reasonable. With two pest release points the area of the footprint therefore doubles, for three it trebles, and so on. In terms of total pest footprint area, the combined area for n pest releases, the radius above should be multiplied by √n. This represents the worst case, where no overlap in the pest footprints occurs.
www.efsa.europa.eu/publications
19
EFSA Supporting publication 2016:EN-1062
The present document has been produced and adopted by the bodies identified above as authors. This task has been carried out exclusively by the authors in the context of a contract between the European Food Safety Authority and the authors, awarded following a tender procedure. The present document is published complying with the transparency principle to which the Authority is subject. It may not be considered as an output adopted by the Authority. The European Food Safety Authority reserves its rights, view and position as regards the issues addressed and the conclusions reached in the present document, without prejudice to the rights of the authors.
Quantitative Pathway Analysis QPAFood
Thus we have two quantities: the area of the NUTS2 region occupied by the vulnerable crop and the proportion of the NUTS2 region that can be reached by the pest(s). Whether the two coincide depends on the geography of the vulnerable host and the location of pest release. For a random pest release, then the average area reached by the pest is equal to the product of these two quantities. The maximum is the total pest footprint area or the total area of the vulnerable crop, whichever is the larger. This upper limit occurs for events where the pest release and vulnerable crop entirely coincide geographically. The minimum is zero (in those cases when pest and host do not coincide at all geographically). A measure of vulnerable area (km2) which takes into account pest mobility is thus obtained. Vulnerability is a measure of potential joint occurrence of released pest and host but does not take into account crop phenology which is incorporated into the calculation later.
2.2.7.
Contact
The contact panel (Fig. 2.2.01b/c) brings together the infested volumes associated with the different waste and/or by-product streams of the infested commodity (Tables 2.2.01/02) and the vulnerability of the receptor to determine pest contact potential in each NUTS2 region in each month. The extent of potential contact between commodity and receptor also depends on the viability of the pest having undergone the twelve (or eight for wheat) waste streams described above. Such reduction in viability is taken into account at this point in the calculation. Any loss of pest viability due to duration and conditions of the waste streams will reduce the infestation level. In the general models this is taken into account by multiplying the infested volume by the reduced viability to give a measure of potential pest challenge expressed as a volume. This is the volume (having taken into account loss of viability) which poses equivalent pest challenge to the same volume at the time of commodity arrival. In the consignment models, the infested volume and the level of infestation have been kept separate to allow the infested volume and the level of infestation of that volume to be considered in more detail (Section 2.3). In the general models for fruit, twelve potential waste streams with different volumes and pest viabilities are considered at one time so in order to obtain an integrated measure of risk, pest challenge, as a product of volume and infestation level is used. The same applies to the eight loss streams in the general wheat model. The final step is to incorporate the effect of vulnerable host phenology; not only must contact with a host occur but it must be at the correct stage for the pest concerned to achieve successful establishment. The suitability of the host phenological stage is expressed as the proportion of host production at the correct stage in each MS in each month. The values are grouped according to the geographic zone of commodity production of the Member State but variables for each state are provided separately in case more precise information is available for future cases. Potential contact (100 kg km2) = Infested volume (100 kg) x vulnerable area (km 2) x susceptible phenology (proportion). The contact is between the pests associated with a volume of infested commodity and an area of vulnerable crop, so the potential for pest contact is proportional to the amount of infested waste/by-product and to the vulnerable area of host with which pests from this waste/by-product can come into contact, e.g. a value of ‘1’ can be interpreted as equivalent to 100 kg infested waste/byproduct acting as a potential source of contact with 1 km 2 of crop. A question arises on how to interpret contact units in which there are very low volumes of infested commodity, for instance where the average level of infestation is less than one fruit. Infested volumes which correspond to less than the weight of a single fruit can be interpreted using the Poisson distribution, a discrete probability distribution that expresses the probability of a given number of events occurring in a fixed interval of time and/or space if these events occur with a known average rate and independently of the time since the last event. The Poisson distribution can also be used for the number of events in other specified intervals such as distance, area or volume. The values calculated in the model for the volume of infested imports are average values for the weight of infested fruit. In terms of numbers of fruit, these values can be divided by the weight of a fruit to give the average number of fruit. If the value is less than one fruit, the result can be
www.efsa.europa.eu/publications
20
EFSA Supporting publication 2016:EN-1062
The present document has been produced and adopted by the bodies identified above as authors. This task has been carried out exclusively by the authors in the context of a contract between the European Food Safety Authority and the authors, awarded following a tender procedure. The present document is published complying with the transparency principle to which the Authority is subject. It may not be considered as an output adopted by the Authority. The European Food Safety Authority reserves its rights, view and position as regards the issues addressed and the conclusions reached in the present document, without prejudice to the rights of the authors.
Quantitative Pathway Analysis QPAFood
interpreted as the mean of a Poisson distribution of infested fruit number. The distribution shows the probability that no fruit, one fruit, two fruits etc., are infested. If the mean value 1998) BULGARIA CYPRUS CZECH REPUBLIC (CS->1992) GERMANY (incl DD from 1991) DENMARK ESTONIA SPAIN FINLAND FRANCE UNITED KINGDOM GREECE CROATIA HUNGARY IRELAND ITALY LITHUANIA LUXEMBOURG LATVIA MALTA NETHERLANDS POLAND PORTUGAL ROMANIA SWEDEN SLOVENIA SLOVAKIA Av = average trade for all years (0) = best estimate of infestation rates as in final model (1) = Infestation rate doubled in Cluster 1 countries (2) = Infestation rate doubled in Cluster 2 countries Cluster 1 = Canada, Cluster 2 = US (Plum model)
www.efsa.europa.eu/publications
133
EFSA Supporting publication 2016:EN-1062
The present document has been produced and adopted by the bodies identified above as authors. This task has been carried out exclusively by the authors in the context of a contract between the European Food Safety Authority and the authors, awarded following a tender procedure. The present document is published complying with the transparency principle to which the Authority is subject. It may not be considered as an output adopted by the Authority. The European Food Safety Authority reserves its rights, view and position as regards the issues addressed and the conclusions reached in the present document, without prejudice to the rights of the authors.
Quantitative Pathway Analysis QPAFood
Table 4.4.14: In rank order based on five-year average trade, the NUTS2 regions and months having greatest risk of pest contact which could lead to establishment. This is calculated as the product of the volume of the infested material volume arriving (100 kg units) and vulnerable area accessible by the pest (km2). The changes in ranking are shown for individual years. The colour spectrum highlights higher (red) and lower (blue) ranks associated with particular years. The variance indicates those regions-months where pest contact risk was particularly variable from year to year (darker grey)
NUTS2 Region UKJ4 - Kent UKJ4 - Kent UKJ4 - Kent UKJ2 - Surrey, East and West Sussex UKG1 - Herefordshire, Worcestershire and Warwickshire UKJ4 - Kent UKJ2 - Surrey, East and West Sussex DEA1 - Düsseldorf UKJ2 - Surrey, East and West Sussex UKH1 - East Anglia UKG1 - Herefordshire, Worcestershire and Warwickshire FR10 - Île de France UKG1 - Herefordshire, Worcestershire and Warwickshire DEA3 - Münster DEF0 - Schleswig-Holstein DE11 - Stuttgart UKF3 - Lincolnshire DE21 - Oberbayern DEE0 - Sachsen-Anhalt DE94 - Weser-Ems DE40 - Brandenburg DE92 - Hannover DEA2 - Köln FR10 - Île de France DEA4 - Detmold DE71 - Darmstadt DEG0 - Thüringen DE80 - Mecklenburg-Vorpommern FR51 - Pays de la Loire FR30 - Nord - Pas-de-Calais
Change in rank from 5-year average % of VariMonth Risk 2010 2011 2012 2013 2014 ance Aug 32.9% 0 0 0 0 0 0 Jul 6.8% -2 -3 -3 -3 0 31 Sep 6.4% -3 -1 1 1 -4 28 Aug 6.2% 2 2 1 1 1 11 Aug 5.6% 2 2 1 1 1 11 Jun 1.5% 1 -30 -8 0 -4 981 Jul 1.3% -8 -8 -3 -6 2 177 Aug 1.2% 1 2 -4 -4 0 37 Sep 1.2% -19 -5 3 2 -24 975 Aug 1.2% 2 2 2 0 1 13 Jul 1.2% -8 -7 0 -3 5 147 Aug 1.1% -6 5 3 3 -5 104 Sep 1.1% -16 -4 6 5 -26 1009 Aug 0.8% 5 5 -1 -3 3 69 Aug 0.8% 5 5 -2 -4 3 79 Aug 0.8% 5 5 -2 -4 3 79 Aug 0.8% -6 -4 4 2 -2 76 Aug 0.7% 6 6 -1 -3 4 98 Aug 0.7% 6 6 -1 -3 4 98 Aug 0.7% 6 4 -3 -6 2 101 Aug 0.6% 4 2 -3 -6 1 66 Aug 0.6% 1 0 -3 -7 0 59 Aug 0.6% 1 0 -3 -8 0 74 Jul 0.6% -25 4 8 -4 3 730 Aug 0.5% 1 1 -3 -7 1 61 Aug 0.5% 1 1 -4 -7 1 68 Aug 0.5% 1 1 -4 -8 1 83 Aug 0.5% 1 1 -4 -8 0 82 Aug 0.5% -16 1 8 6 -21 798 Aug 0.5% -16 1 8 6 -21 798
www.efsa.europa.eu/publications
134
EFSA Supporting publication 2016:EN-1062
The present document has been produced and adopted by the bodies identified above as authors. This task has been carried out exclusively by the authors in the context of a contract between the European Food Safety Authority and the authors, awarded following a tender procedure. The present document is published complying with the transparency principle to which the Authority is subject. It may not be considered as an output adopted by the Authority. The European Food Safety Authority reserves its rights, view and position as regards the issues addressed and the conclusions reached in the present document, without prejudice to the rights of the authors.
Quantitative Pathway Analysis QPAFood
Table 4.4.15: With regions-months listed In rank order based on source infestation as parameterised in the final model, Av(0), the changes in risk raking and the percentage changes in risk associated with infestation scenarios where imports from Canada had double the infestation rate, Av(1), and double the infestation rate in the USA, Av(2). The colour spectrum highlights higher (red) and lower (blue) ranks associated with particular cases
Change in rank Change in risk from Av(0) from Av(0) NUTS2 Region Month Av(1) Av(2) Av(1) Av(2) UKJ4 - Kent Aug 0 0 21% 79% UKJ4 - Kent Jul -2 0 5% 95% UKJ4 - Kent Sep 1 0 23% 77% UKJ2 - Surrey, East and West Sussex Aug 1 0 21% 79% UKG1 - Herefordshire, Worcestershire and Aug Warwickshire 0 0 21% 79% UKJ4 - Kent Jun -1 0 0% 100% UKJ2 - Surrey, East and West Sussex Jul -5 0 5% 95% DEA1 - Düsseldorf Aug 2 -5 67% 33% UKJ2 - Surrey, East and West Sussex Sep 1 -1 23% 77% UKH1 - East Anglia Aug 1 1 21% 79% UKG1 - Herefordshire, Worcestershire and Jul Warwickshire -7 3 5% 95% FR10 - Île de France Aug 1 1 23% 77% UKG1 - Herefordshire, Worcestershire and Sep Warwickshire 0 1 23% 77% DEA3 - Münster Aug 4 -1 67% 33% DEF0 - Schleswig-Holstein Aug 1 -2 67% 33% DE11 - Stuttgart Aug 1 -2 67% 33% UKF3 - Lincolnshire Aug -6 3 21% 79% DE21 - Oberbayern Aug 2 -1 67% 33% DEE0 - Sachsen-Anhalt Aug 2 -1 67% 33% DE94 - Weser-Ems Aug 1 -1 67% 33% DE40 - Brandenburg Aug 1 -1 67% 33% DE92 - Hannover Aug 1 -3 67% 33% DEA2 - Köln Aug 1 -3 67% 33% FR10 - Île de France Jul -11 8 11% 89% DEA4 - Detmold Aug 1 -2 67% 33% DE71 - Darmstadt Aug 1 -2 67% 33% DEG0 - Thüringen Aug 1 -2 67% 33% DE80 - Mecklenburg-Vorpommern Aug 1 -2 67% 33% FR51 - Pays de la Loire Aug -9 6 23% 77% FR30 - Nord - Pas-de-Calais Aug -9 6 23% 77%
www.efsa.europa.eu/publications
135
EFSA Supporting publication 2016:EN-1062
The present document has been produced and adopted by the bodies identified above as authors. This task has been carried out exclusively by the authors in the context of a contract between the European Food Safety Authority and the authors, awarded following a tender procedure. The present document is published complying with the transparency principle to which the Authority is subject. It may not be considered as an output adopted by the Authority. The European Food Safety Authority reserves its rights, view and position as regards the issues addressed and the conclusions reached in the present document, without prejudice to the rights of the authors.
Quantitative Pathway Analysis QPAFood
Table 4.4.16: How risk rankings differ between retail and processing. The 30 highest ranked risks are listed from the final model. The deviations from the ranking when retail alone is considered (f-Rf) and when processing alone is considered (f-Pf) are given, together with the percentages of the retail and processing risk which lies in a region-month combination
NUTS2 Region Month f-Rf UKJ4 - Kent Aug 0 UKJ4 - Kent Jul 0 UKJ4 - Kent Sep 0 UKJ2 - Surrey, East and West Sussex Aug 0 UKG1 - Herefordshire, Worcestershire and Aug Warwickshire0 UKJ4 - Kent Jun 0 UKJ2 - Surrey, East and West Sussex Jul 0 DEA1 - Düsseldorf Aug 0 UKJ2 - Surrey, East and West Sussex Sep 0 UKH1 - East Anglia Aug 0 UKG1 - Herefordshire, Worcestershire and Jul Warwickshire0 FR10 - Île de France Aug 0 UKG1 - Herefordshire, Worcestershire and Sep Warwickshire0 DEA3 - Münster Aug 0 DEF0 - Schleswig-Holstein Aug -1 DE11 - Stuttgart Aug 1 UKF3 - Lincolnshire Aug -1 DE21 - Oberbayern Aug 1 DEE0 - Sachsen-Anhalt Aug 0 DE94 - Weser-Ems Aug 0 DE40 - Brandenburg Aug 0 DE92 - Hannover Aug 0 DEA2 - Köln Aug 0 FR10 - Île de France Jul 0 DEA4 - Detmold Aug -1 DE71 - Darmstadt Aug 1 DEG0 - Thüringen Aug 0 DE80 - Mecklenburg-Vorpommern Aug 0 FR51 - Pays de la Loire Aug -1 FR30 - Nord - Pas-de-Calais Aug 1
www.efsa.europa.eu/publications
136
Retail Proc. risk f-Pf risk 33.1% 0 26.6% 6.8% -1 5.5% 6.4% -2 5.2% 6.3% 0 5.4% 5.5% 3 7.1% 1.6% -5 1.3% 1.3% -9 1.1% 1.2% -7 1.1% 1.2% -8 1.0% 1.2% 4 1.7% 1.1% 4 1.5% 1.1% -9 0.8% 1.1% 4 1.4% 0.8% 0 1.1% 0.8% 3 1.2% 0.8% -2 1.0% 0.7% 9 1.4% 0.7% -1 0.9% 0.7% -3 0.8% 0.7% 7 1.2% 0.6% -1036 0.0% 0.6% -4 0.6% 0.6% -13 0.5% 0.6% -14 0.4% 0.5% 2 0.7% 0.5% -2 0.6% 0.5% 2 0.7% 0.5% 8 0.9% 0.5% -1 0.5% 0.5% -7 0.4%
EFSA Supporting publication 2016:EN-1062
The present document has been produced and adopted by the bodies identified above as authors. This task has been carried out exclusively by the authors in the context of a contract between the European Food Safety Authority and the authors, awarded following a tender procedure. The present document is published complying with the transparency principle to which the Authority is subject. It may not be considered as an output adopted by the Authority. The European Food Safety Authority reserves its rights, view and position as regards the issues addressed and the conclusions reached in the present document, without prejudice to the rights of the authors.
Quantitative Pathway Analysis QPAFood
Table 4.4.17: How risk rankings differ in relation to alternative assumptions made about the location of processing based on the location of all fruit and vegetable processing enterprises, as in the final model (f), or an equal distribution across all NUTS2 regions within a country (g). The 30 highest ranked risks are listed in order from the final model (f) and the deviation when Assumption (g) is employed instead (f-g), and similarly when processing risk alone is considered (Pf-Pg). The percentage of the processing risk which lies in each of the top 30 region-month combinations is also shown. For example, Kent in September (which is 3rd overall in rank for total risk), showed no change in ranking when all risks were considered (fg) but increased one place when just processing risks were considered (Pf-Pg); it represented 5.2% of processing risk under Assumption (f) and 6.5% under Assumption (g)
% Risk % Risk NUTS2 Region Month f-g Pf-Pg Pf Pg UKJ4 - Kent Aug 0 0 26.6% 33.4% UKJ4 - Kent Jul 0 0 5.5% 6.9% UKJ4 - Kent Sep 0 1 5.2% 6.5% UKJ2 - Surrey, East and West Sussex Aug 0 -1 5.4% 4.0% UKG1 - Herefordshire, Worcestershire and Warwickshire Aug 0 0 7.1% 7.4% UKJ4 - Kent Jun 0 4 1.3% 1.6% UKJ2 - Surrey, East and West Sussex Jul 0 5 1.1% 0.8% DEA1 - Düsseldorf Aug 0 -9 1.1% 0.5% UKJ2 - Surrey, East and West Sussex Sep 0 5 1.0% 0.8% UKH1 - East Anglia Aug 0 -4 1.7% 0.9% UKG1 - Herefordshire, Worcestershire and Warwickshire Jul 0 -1 1.5% 1.5% FR10 - Île de France Aug -1 -35 0.8% 0.2% UKG1 - Herefordshire, Worcestershire and Warwickshire Sep 1 0 1.4% 1.4% DEA3 - Münster Aug 0 -1 1.1% 0.7% DEF0 - Schleswig-Holstein Aug -1 -5 1.2% 0.6% DE11 - Stuttgart Aug -1 -17 1.0% 0.4% UKF3 - Lincolnshire Aug 2 2 1.4% 1.8% DE21 - Oberbayern Aug -1 -18 0.9% 0.4% DEE0 - Sachsen-Anhalt Aug 1 8 0.8% 0.7% DE94 - Weser-Ems Aug 0 -6 1.2% 0.6% DE40 - Brandenburg Aug 0 1036 0.0% 0.6% DE92 - Hannover Aug 0 8 0.6% 0.6% DEA2 - Köln Aug 0 -14 0.5% 0.3% FR10 - Île de France Jul 0 -48 0.4% 0.1% DEA4 - Detmold Aug 0 3 0.7% 0.6% DE71 - Darmstadt Aug 0 -19 0.6% 0.3% DEG0 - Thüringen Aug 0 -1 0.7% 0.5% DE80 - Mecklenburg-Vorpommern Aug 0 4 0.9% 0.7% FR51 - Pays de la Loire Aug -1 -14 0.5% 0.3% FR30 - Nord - Pas-de-Calais Aug 1 -12 0.4% 0.3%
www.efsa.europa.eu/publications
137
EFSA Supporting publication 2016:EN-1062
The present document has been produced and adopted by the bodies identified above as authors. This task has been carried out exclusively by the authors in the context of a contract between the European Food Safety Authority and the authors, awarded following a tender procedure. The present document is published complying with the transparency principle to which the Authority is subject. It may not be considered as an output adopted by the Authority. The European Food Safety Authority reserves its rights, view and position as regards the issues addressed and the conclusions reached in the present document, without prejudice to the rights of the authors.
Quantitative Pathway Analysis QPAFood
4.4.4.
Wheat model
Sensitivity of infested volume entering Member States The trade volume entering different states from different source countries varies from year to year. The infested volume entering Member States is the final output from Module 1 and gives the amount of infested material arriving in each Member State. The pattern of infested volume entering Member States was in broad terms less stable for wheat over the years 2010 to 2014 than it was for the three fruit commodity case studies. In particular, there was a sharp decline in potentially infested imports in 2014 compared to earlier years; in the highest risk Member State, Italy, the infested imports were less than half those in any of the previous four years. Three Member States, Spain, Germany and Portugal, which suffered moderate risk in most years had particularly high risk in others: Germany in 2013; Spain in 2012 and 2013; and Portugal in 2012 (Table 4.4.18). The results indicate that the risk of infested commodity entering particular Member States is not readily predicted from historical trade averages due to large year to year trade fluctuations in the wheat imports from the pest-infested source counties of this case study. The different source countries of the pest concerned have different patterns of export to the EU so any differences in infestation rates in the commodity from different source countries are expected to result in different risk patterns within the EU. To gain some understanding of the potential importance of such effects, scenarios were simulated in which infestation rates from selected source countries were increased. In this case study, varying infestation rates from geographical clusters had differing effects on Spain and Italy, especially. Doubling the infestation rate of imports from Cluster 1 (South American countries) had a large effect on the risk to Spain, and also to Germany, Portugal and Romania. Doubling infestation from Cluster 2 (Australasian countries) had a large effect on the risk to Italy. France and the UK showed increase in risk associated with both clusters (Table 4.4.19). This result reflects differences in the main source of imports to the Member States, and using the model it is possible to attach a value to the degree of change that might be expected under different circumstances. Sensitivity of risk of pest contact The risk of pest contact is the final model output presented in the final step of Module 2. The risk of pest contact is calculated as the product of the volume of the infested material volume arriving (100 kg units) and vulnerable area accessible by the pest (km2). The risk of contact was calculated for every NUTS2 region in every month of the year. The results were ranked with the highest risk at the top. The top 50 most risky combinations of NUTS2 region and month together represented over 70% of the risk of pest-host contact with the potential for transfer within the EU, with regions of Italy, Spain and the Netherlands dominating the higher end of the risk profile. The variance in risk was high and the distribution skewed to low values but the distribution had a long tail representing a small probability of high levels of pest contact: Fig. 4.4.04 illustrates the contact risk distributions of the highest ranked risk, Emilia Romagna in April and the 30th ranked risk, Andalucía in April (see Table 4.4.19). The x-axes are similarly scaled to show how the distribution of risk declines to low values as one descends the risk ranking. The cut point for the top 5% of the distribution was about 4 times greater in the 1st-ranked than in the 30th-ranked situation. On average, therefore, the decline in risk is less pronounced than for all the fruit case studies suggesting a less concentrated risk pattern than in the fruit case studies. Table 4.4.19 shows the 30 highest ranked with, for example, Emilia Romagna in April posing the highest risk and representing 4.1% of the total contact risk. The same region also carried high risk in five other months, March being, on average, the next highest. The effect of year to year differences in trade on the result is shown by the change in rank in individual years from the overall rank determined by the average of the five year period. Year to year variability was much higher than was the case in any of the fruit case studies with 2014, in particular, having a very different risk profile to the four preceding years. Zuid Holland was the least variable across the five year period implying a more consistence pattern of imports than was the case in some other locations. In contrast imports to Emilia Romagna in Italy and to Castilla y Leon, Aragon and Castilla la Mancha in Spain were the most variable. The very large decline in risk ranking seen in these www.efsa.europa.eu/publications
138
EFSA Supporting publication 2016:EN-1062
The present document has been produced and adopted by the bodies identified above as authors. This task has been carried out exclusively by the authors in the context of a contract between the European Food Safety Authority and the authors, awarded following a tender procedure. The present document is published complying with the transparency principle to which the Authority is subject. It may not be considered as an output adopted by the Authority. The European Food Safety Authority reserves its rights, view and position as regards the issues addressed and the conclusions reached in the present document, without prejudice to the rights of the authors.
Quantitative Pathway Analysis QPAFood
regions, and in others in 2011 and 2014, in particular, were associated with an absence of the usual imports to these regions at those times. It is clear that in the wheat case study risk, although having an underlying pattern across the NUTS2 regions, shows large deviations from this pattern in individual years due primarily to variations in trade patterns from year to year. Reflecting the results seen in terms of infested trade volumes, some NUTS2 regions of Spain showed an increased risk associated with a doubling of commodity infestation rates from Cluster 1 sources (South American countries). Doubling infestation from Cluster 2 sources (Australasian countries) had a large effect on the risk on some NUTS2 regions of Italy. In addition, risk in Zuid Holland increased in association with Cluster 2 infestation, reflecting imports to that region (Table 4.4.20). In general the results reflect differences in the main source of imports to the Member States, and it can be seen that in most of the top 30 risks shown there was usually a strong response to either Cluster 1 infestation (e.g. Andalucía in January) or to Cluster 2 infestation (e.g. Veneto in June); less commonly there was a similar response to both Clusters (e.g. Emilia Romagna in February) These changes represented a maximum of 15 places in risk ranking which is not particularly great but may be sufficient to alter perceptions of the pattern of risk between Member States, should a shift in infestation rate occur in one of the source countries. In the final model, a proportion of the commodity is destined for milling and a proportion for industrial uses. The results are compared with hypothetical situations where the entire commodity goes to milling or the entire commodity goes to industrial uses. In this way we can assess the importance of the assumption concerning the proportion destined for each. When the milling and industrial aspects of risk are disaggregated then, as expected, the patterns of the two were different. To show how the risk rankings differ between milling and industrial, the region-month combinations were again ranked according to the final model, and the deviations from this ranking shown when milling alone is considered and when industrial use alone is considered (Table 4.4.21). The differences when the milling alone scenario is considered were all very small, a maximum of three places in the rankings, but usually less. The differences when the industrial use alone scenario was considered were mixed, with some region-month combination changing very little from the general picture whilst others showed larger declines in risk ranking because they were regions where little industrial use was recorded. Overall the difference in risk profile between milling and industrial uses may have implications for risk management but the overall geographic patterns had much similarity; for example, the top 7 most risky region-month combinations for milling and industrial uses were within one rank place of each other. Approximately 1.44 times more risk was estimated to be associated if the entire commodity went to milling than if the entire commodity went to industrial uses, so per unit of commodity, the risk can be said to be 1.44 times greater associated with milling than industrial uses. In the final model as parameterised, a mode of 91% of the imported commodity went to milling use and 9% went to industrial use. Taking this into account, therefore, the risk associated with milling use was overall 1.44 x (91%/9%) = 14.6 times greater than that associated with industrial use. The percentage of milling-only risk and of the industrial use-only risk are also shown in Table 4.4.21, so for example, the most risky region-month combination overall, Emilia Romagna in April, carried 4.1% of the milling risk and also 4.1 % of the industrial-use risk. The geographical concentration of risk, or the degree to which the risk is concentrated in a few regions-months as opposed to being more spread out, was similar for milling and industrial components of risk.
www.efsa.europa.eu/publications
139
EFSA Supporting publication 2016:EN-1062
The present document has been produced and adopted by the bodies identified above as authors. This task has been carried out exclusively by the authors in the context of a contract between the European Food Safety Authority and the authors, awarded following a tender procedure. The present document is published complying with the transparency principle to which the Authority is subject. It may not be considered as an output adopted by the Authority. The European Food Safety Authority reserves its rights, view and position as regards the issues addressed and the conclusions reached in the present document, without prejudice to the rights of the authors.
Quantitative Pathway Analysis QPAFood
Figure 4.4.04: Frequency distributions of the risk of pest contact which could lead to establishment. This is calculated as the product of the volume of the infested material arriving (100 kg units) and vulnerable area accessible by the pest (km 2), shown on the x-axes. The y-axes indicate the number of simulated scenarios falling in each x-axis category. Two region-month combinations are illustrated, corresponding to risk ranks 1 and 30 (Table 4.4.18)
www.efsa.europa.eu/publications
140
EFSA Supporting publication 2016:EN-1062
The present document has been produced and adopted by the bodies identified above as authors. This task has been carried out exclusively by the authors in the context of a contract between the European Food Safety Authority and the authors, awarded following a tender procedure. The present document is published complying with the transparency principle to which the Authority is subject. It may not be considered as an output adopted by the Authority. The European Food Safety Authority reserves its rights, view and position as regards the issues addressed and the conclusions reached in the present document, without prejudice to the rights of the authors.
Quantitative Pathway Analysis QPAFood
Table 4.4.18: Year to year differences in total Infested commodity, imports and net transhipments, in each Member State (volume units: 100 kg) over the period 2010 to 2014. The colour spectrum highlights higher (red) and lower (blue) volumes
Trade year 2011(0) 2012(0) 2013(0) 2014(0) 0.05 0.02 0.25 0.01 0.33 0.22 3.17 0.01 0.00 0.00 0.08 0.00 0.00 0.00 0.00 0.00 0.00 0.00 0.00 0.00 0.69 0.71 66.56 0.09 0.07 0.06 0.18 0.00 0.00 0.00 0.00 0.00 9.32 145.68 182.83 0.00 0.00 0.00 0.00 0.00 1.49 0.87 0.75 0.06 2.48 0.18 4.63 0.21 0.09 0.01 0.43 0.00 0.00 0.00 0.00 0.00 0.00 0.00 0.00 0.00 0.03 0.00 0.00 0.00 199.52 214.09 198.48 78.99 0.00 0.00 0.01 0.00 0.00 0.00 0.07 0.00 0.00 0.00 0.00 0.00 0.00 0.00 0.78 0.00 1.11 0.43 2.93 0.21 0.01 0.00 0.04 0.00 0.12 27.45 2.03 0.00 0.19 0.00 6.54 0.00 0.00 0.01 0.50 0.00 0.00 0.00 0.00 0.02 0.00 0.00 0.00 0.00
2010(0) AUSTRIA 0.04 BELGIUM (and LUXBG -> 1998) 0.22 BULGARIA 0.00 CYPRUS 0.00 CZECH REPUBLIC (CS->1992) 0.00 GERMANY (incl DD from 1991) 0.40 DENMARK 0.01 ESTONIA 0.00 SPAIN 8.65 FINLAND 0.03 FRANCE 0.38 UNITED KINGDOM 1.81 GREECE 0.04 CROATIA 0.00 HUNGARY 0.00 IRELAND 0.02 ITALY 161.64 LITHUANIA 0.00 LUXEMBOURG 0.00 LATVIA 0.00 MALTA 0.00 NETHERLANDS 0.16 POLAND 0.00 PORTUGAL 0.32 ROMANIA 0.06 SWEDEN 0.02 SLOVENIA 0.01 SLOVAKIA 0.01 2010 = year of trade data (0) = best estimate of infestation rates as in final model
www.efsa.europa.eu/publications
141
EFSA Supporting publication 2016:EN-1062
The present document has been produced and adopted by the bodies identified above as authors. This task has been carried out exclusively by the authors in the context of a contract between the European Food Safety Authority and the authors, awarded following a tender procedure. The present document is published complying with the transparency principle to which the Authority is subject. It may not be considered as an output adopted by the Authority. The European Food Safety Authority reserves its rights, view and position as regards the issues addressed and the conclusions reached in the present document, without prejudice to the rights of the authors.
Quantitative Pathway Analysis QPAFood
Table 4.4.19: Differences in total Infested commodity, imports and net transhipments, in each Member State (volume units: 100 kg) under different infestation scenarios in the source countries of the commodity. The colour spectrum highlights higher (red) and lower (blue) volumes
Infestation cluster scenario Av(0) Av(1) Av(2) 0.10 0.16 0.14 0.90 1.70 0.99 0.00 0.01 0.00 0.00 0.01 0.00 0.00 0.00 0.00 12.23 24.14 12.55 0.09 0.14 0.11 0.00 0.00 0.00 68.02 134.33 69.72 0.01 0.01 0.01 0.75 1.11 1.12 1.35 2.12 1.92 0.10 0.15 0.14 0.00 0.00 0.00 0.01 0.01 0.01 0.02 0.03 0.02 170.72 189.21 322.95 0.00 0.00 0.00 0.01 0.02 0.01 0.00 0.00 0.00 0.23 0.37 0.33 1.37 2.54 1.57 0.06 0.13 0.07 6.84 13.63 6.88 1.86 3.68 1.89 0.10 0.19 0.10 0.00 0.00 0.01 0.01 0.01 0.01
AUSTRIA BELGIUM (and LUXBG -> 1998) BULGARIA CYPRUS CZECH REPUBLIC (CS->1992) GERMANY (incl DD from 1991) DENMARK ESTONIA SPAIN FINLAND FRANCE UNITED KINGDOM GREECE CROATIA HUNGARY IRELAND ITALY LITHUANIA LUXEMBOURG LATVIA MALTA NETHERLANDS POLAND PORTUGAL ROMANIA SWEDEN SLOVENIA SLOVAKIA Av = average trade for all years (0) = best estimate of infestation rates as in final model (1) = Infestation rate doubled in Cluster 1 countries (2) = Infestation rate doubled in Cluster 2 countries Cluster 1 = South American countries; Cluster 2 = Australasian countries (Wheat model)
www.efsa.europa.eu/publications
142
EFSA Supporting publication 2016:EN-1062
The present document has been produced and adopted by the bodies identified above as authors. This task has been carried out exclusively by the authors in the context of a contract between the European Food Safety Authority and the authors, awarded following a tender procedure. The present document is published complying with the transparency principle to which the Authority is subject. It may not be considered as an output adopted by the Authority. The European Food Safety Authority reserves its rights, view and position as regards the issues addressed and the conclusions reached in the present document, without prejudice to the rights of the authors.
Quantitative Pathway Analysis QPAFood
Table 4.4.20: In rank order based on five-year average trade, the NUTS2 regions and months having greatest risk of pest contact which could lead to establishment. This is calculated as the product of the volume of the infested material volume arriving (100 kg units) and vulnerable area accessible by the pest (km2). The changes in ranking are shown for individual years. The colour spectrum highlights higher (red) and lower (blue) ranks associated with particular years. The variance indicates those regions-months where pest contact risk was particularly variable from year to year (darker grey)
Change in rank from 5-year average NUTS2 Region ITH5 - Emilia-Romagna ITH5 - Emilia-Romagna ITH5 - Emilia-Romagna ES61 - Andalucía ITH3 - Veneto ITH3 - Veneto ITH5 - Emilia-Romagna ES41 - Castilla y León ITH3 - Veneto ITG1 - Sicilia ITG1 - Sicilia ITG1 - Sicilia ITH5 - Emilia-Romagna ITH3 - Veneto ES61 - Andalucía NL33 - Zuid-Holland NL33 - Zuid-Holland ES61 - Andalucía ITG1 - Sicilia ITH5 - Emilia-Romagna ES24 - Aragón ITH3 - Veneto ES41 - Castilla y León ES51 - Cataluña ITC1 - Piemonte ES42 - Castilla-la Mancha NL33 - Zuid-Holland ITC1 - Piemonte ITF4 - Puglia ES61 - Andalucía
www.efsa.europa.eu/publications
% of Month Risk 2010 2011 Apr 4.1% -2 -18 Mar 3.7% -5 -78 Jun 3.5% 2 2 Feb 3.3% -8 -411 Apr 2.7% -3 -24 Mar 2.5% -9 -94 May 2.5% -7 -2 Feb 2.4% -16 -989 Jun 2.3% 5 6 Apr 2.3% 0 -23 Jun 2.1% 6 7 Mar 2.0% -5 -99 Feb 1.8% 11 -395 May 1.6% -9 1 Jan 1.5% -288 -206 Apr 1.5% -5 -31 Jun 1.4% 6 10 Mar 1.4% -44 -125 May 1.4% -7 4 Nov 1.3% 7 18 Feb 1.3% -19 -1049 Feb 1.3% 16 -423 Jan 1.2% -448 -447 Feb 1.1% -9 -506 Jun 1.1% 9 17 Feb 1.1% -18 -1070 May 1.0% -10 3 Apr 1.0% 1 -30 Apr 0.9% 0 -31 Apr 0.9% -18 -46
143
2012 2013 -4 0 -13 -7 -5 -5 2 1 -4 3 -19 -11 6 -94 4 3 -10 -9 -3 6 -11 -10 -20 -20 6 -11 11 -99 4 8 -13 10 -13 -9 4 -2 13 -391 -388 -1036 5 9 12 -14 5 13 7 5 -12 -13 6 11 15 -29 -7 14 -7 13 -31 19
Vari2014 ance -626 392220 1 6328 -79 6299 -309 264471 -639 408931 4 9415 -111 21246 -674 1E+06 -80 6642 -834 696130 -313 98275 9 10707 -233 210592 -126 25880 -38 126904 -504 255271 -44 2322 11 17702 -274 228191 -1042 2E+06 -706 2E+06 -249 241526 -127 416836 -356 382927 -753 567692 -711 2E+06 -60 4775 -1034 1E+06 -744 554715 -586 347158
EFSA Supporting publication 2016:EN-1062
The present document has been produced and adopted by the bodies identified above as authors. This task has been carried out exclusively by the authors in the context of a contract between the European Food Safety Authority and the authors, awarded following a tender procedure. The present document is published complying with the transparency principle to which the Authority is subject. It may not be considered as an output adopted by the Authority. The European Food Safety Authority reserves its rights, view and position as regards the issues addressed and the conclusions reached in the present document, without prejudice to the rights of the authors.
Quantitative Pathway Analysis QPAFood
Table 4.4.21: With regions-months listed in rank order based on source infestation as parameterised in the final model, Av(0), the changes in risk ranking and the percentage changes in risk associated with infestation scenarios where imports from Country Cluster 1 (South America) had double the infestation rate, Av(1), and Country Cluster 2 (Australasia) had double the infestation rate, Av(2). The colour spectrum highlights higher (red) and lower (blue) ranks associated with particular cases
NUTS2 Region ITH5 - Emilia-Romagna ITH5 - Emilia-Romagna ITH5 - Emilia-Romagna ES61 - Andalucía ITH3 - Veneto ITH3 - Veneto ITH5 - Emilia-Romagna ES41 - Castilla y León ITH3 - Veneto ITG1 - Sicilia ITG1 - Sicilia ITG1 - Sicilia ITH5 - Emilia-Romagna ITH3 - Veneto ES61 - Andalucía NL33 - Zuid-Holland NL33 - Zuid-Holland ES61 - Andalucía ITG1 - Sicilia ITH5 - Emilia-Romagna ES24 - Aragón ITH3 - Veneto ES41 - Castilla y León ES51 - Cataluña ITC1 - Piemonte ES42 - Castilla-la Mancha NL33 - Zuid-Holland ITC1 - Piemonte ITF4 - Puglia ES61 - Andalucía
www.efsa.europa.eu/publications
Month Apr Mar Jun Feb Apr Mar May Feb Jun Apr Jun Mar Feb May Jan Apr Jun Mar May Nov Feb Feb Jan Feb Jun Feb May Apr Apr Apr
Change in rank Change in risk from Av(0) from Av(0) Av(1) Av(2) Change Av(2) in risk from Av(0) -3 0 6% 94% 0 -1 37% 63% -2 1 0% 100% 3 -6 91% 9% -4 1 7% 93% 0 -3 38% 62% -1 0 19% 81% 5 -9 95% 5% -7 4 0% 100% -5 4 4% 96% -8 3 0% 100% 1 1 31% 69% 1 -1 40% 60% -6 2 19% 81% 8 -15 100% 0% -6 1 19% 81% -8 4 0% 100% 8 -6 79% 21% -4 3 17% 83% -4 2 16% 84% 8 -14 95% 5% 1 2 44% 56% 9 -15 100% 0% 7 -13 90% 10% -5 6 0% 100% 8 -15 95% 5% 0 1 30% 70% -7 7 4% 96% -8 7 5% 95% 4 -2 46% 54%
144
EFSA Supporting publication 2016:EN-1062
The present document has been produced and adopted by the bodies identified above as authors. This task has been carried out exclusively by the authors in the context of a contract between the European Food Safety Authority and the authors, awarded following a tender procedure. The present document is published complying with the transparency principle to which the Authority is subject. It may not be considered as an output adopted by the Authority. The European Food Safety Authority reserves its rights, view and position as regards the issues addressed and the conclusions reached in the present document, without prejudice to the rights of the authors.
Quantitative Pathway Analysis QPAFood
Table 4.4.22: How risk rankings differ between milling (Rf) and industrial uses (Pf). The top 30 highest ranked risks are listed from the final model (f). The deviations from the ranking when milling alone is considered (f-Rf) and when industrial uses alone are considered (f-Pf) are given, together with the percentages of the milling and industrial risk which lies in region-month combination
NUTS2 Region ITH5 - Emilia-Romagna ITH5 - Emilia-Romagna ITH5 - Emilia-Romagna ES61 - Andalucía ITH3 - Veneto ITH3 - Veneto ITH5 - Emilia-Romagna ES41 - Castilla y León ITH3 - Veneto ITG1 - Sicilia ITG1 - Sicilia ITG1 - Sicilia ITH5 - Emilia-Romagna ITH3 - Veneto ES61 - Andalucía NL33 - Zuid-Holland NL33 - Zuid-Holland ES61 - Andalucía ITG1 - Sicilia ITH5 - Emilia-Romagna ES24 - Aragón ITH3 - Veneto ES41 - Castilla y León ES51 - Cataluña ITC1 - Piemonte ES42 - Castilla-la Mancha NL33 - Zuid-Holland ITC1 - Piemonte ITF4 - Puglia ES61 - Andalucía
www.efsa.europa.eu/publications
Month Apr Mar Jun Feb Apr Mar May Feb Jun Apr Jun Mar Feb May Jan Apr Jun Mar May Nov Feb Feb Jan Feb Jun Feb May Apr Apr Apr
f-Rf 0 0 0 0 0 -1 -1 2 -1 1 0 0 0 0 0 -1 -2 0 3 -2 1 -1 2 -2 1 1 -1 1 0 0
Milling risk 4.1% 3.7% 3.5% 3.3% 2.7% 2.5% 2.5% 2.6% 2.4% 2.4% 2.1% 2.0% 1.8% 1.7% 1.5% 1.4% 1.4% 1.4% 1.5% 1.3% 1.3% 1.3% 1.3% 1.1% 1.1% 1.1% 1.0% 1.0% 0.9% 0.9%
145
f-Pf 0 0 0 0 0 -1 1 -44 1 -14 -17 -17 3 -1 -2 7 5 4 -23 0 -33 4 -63 13 -8 -27 8 -12 3 7
Indust. risk 4.1% 3.9% 3.5% 3.2% 2.6% 2.5% 2.5% 0.5% 2.2% 1.1% 1.0% 0.9% 2.0% 1.6% 1.4% 2.1% 2.0% 1.6% 0.7% 1.3% 0.5% 1.4% 0.3% 2.0% 0.9% 0.5% 1.4% 0.8% 1.0% 1.1%
EFSA Supporting publication 2016:EN-1062
The present document has been produced and adopted by the bodies identified above as authors. This task has been carried out exclusively by the authors in the context of a contract between the European Food Safety Authority and the authors, awarded following a tender procedure. The present document is published complying with the transparency principle to which the Authority is subject. It may not be considered as an output adopted by the Authority. The European Food Safety Authority reserves its rights, view and position as regards the issues addressed and the conclusions reached in the present document, without prejudice to the rights of the authors.
Quantitative Pathway Analysis QPAFood
4.5. 4.5.1.
Consignment model results Orange model
Four trade chains were identified as pathways of potential pest entry on sweet orange commodity. These four trade chains involved different combinations of ten stages: on arrival; at airport or harbour; in transport to wholesale; at wholesale and storage; in transport to processor; at processor; in transport to retail; at retail; in transport to consumer; and at consumer. In each case, better evidence was available to support an estimate of mean duration of each of these stages than to estimate the variance. Lower limits could be estimated on the basis of the most rapid duration that was logistically practical, but the upper limits were more uncertain. As a result, the sensitivity analysis focussed on the effect of changes in the upper limits on the distribution of commodity durations along the trade chains. It is not possible to show all the results, but a summary of the distributions of durations associated with the last stage of each of the four trade chains is shown in Fig. 4.5.01. Two scenarios are shown for comparison: the results from the final model as parameterised, and where the upper limit of each stage was 25% longer than that estimated for the final model. A 25% increase was used in the case of the fruit models because they are perishable products, so there was less potential for the commodity to spend longer in each stage than was the case with wheat. The increase in overall period that the commodity could occur at the final point of the trade chain was between 1.08 and 1.16-fold greater in the scenario where the maximum of each stage was increased by 25% (this being measured by the duration which encompassed 95% of the distribution, Fig. 4.5.01.). The smallest increase was seen in Trade chain 1 so this had the least sensitive assumptions about maximum stage duration. The largest increase was seen in Trade chain 2, so this was correspondingly more sensitive (Table 4.5.01). These increases in duration did not reflect a corresponding change in the potential for pest risk. The model incorporates pest mortality along the trade chain and as the time for the commodity to move through the trade chain increases this can lead to reduced infestation rates at later stages of the chain, depending on the biology of the pest concerned. If the later stages carry proportionately high risk of pest release, then an increase in duration can lead to lower risk as a whole. This was particularly true for Trade chain 4 (Table 4.5.01) where, compared to the other trade chains, a higher risk was associated with the last stage in the chain, at the consumer. In the other trade chains, there was less impact of increased trade chain duration on potential pest risk. It was Trade chains 1 and 2 that carried, per unit commodity, the highest relative risk potential for pest release which could lead to introduction. This reflects the higher risk associated with fresh retail rather than processed retail. It is important to remember that these results are per unit commodity travelling along the trade chain so that actual distribution of risk across all trade chains also depends upon the amounts associated with each trade chain. The @RISK software also provides a built-in function to show the most significant inputs determining any chosen output. Here we determine the key inputs associated with the upper quartile (top 25%) of trade chain durations. Table 4.5.02 shows those input variables where the median associated with the upper quartile of the results differed most (i.e. at least ½ a standard deviation) from the overall median. As can be seen in Table 4.5.02, in Trade chains 1 and 2 which were concerned with the fresh commodity, time spent at the consumer (Trade chain 1) or at the wholesaler and at the consumer (Trade chain 2) were the most influential in determining overall trade chain duration. In contrast, with those trade chains which were concerned with the processed commodity, total trade chain duration was influenced more widely by the various steps in their respective chains.
www.efsa.europa.eu/publications
146
EFSA Supporting publication 2016:EN-1062
The present document has been produced and adopted by the bodies identified above as authors. This task has been carried out exclusively by the authors in the context of a contract between the European Food Safety Authority and the authors, awarded following a tender procedure. The present document is published complying with the transparency principle to which the Authority is subject. It may not be considered as an output adopted by the Authority. The European Food Safety Authority reserves its rights, view and position as regards the issues addressed and the conclusions reached in the present document, without prejudice to the rights of the authors.
Quantitative Pathway Analysis QPAFood
Final model as parameterised
Maximum duration of all stages 25% longer
Trade chain 1 (Port to Retail to Consumer)
Trade chain 2 (Port to Wholesale/storage to Retail to Consumer)
Trade chain 3 (Port to Wholesaler/storage to Processor to Retailer to Consumer)
Trade chain 4 (Port to Processor to Retailer to Consumer)
Figure 4.5.01: Sensitivity of the trade chain durations to a 25% increase in the maximum duration in all stages of the chain. Results are shown for all the commodity routes modelled www.efsa.europa.eu/publications
147
EFSA Supporting publication 2016:EN-1062
The present document has been produced and adopted by the bodies identified above as authors. This task has been carried out exclusively by the authors in the context of a contract between the European Food Safety Authority and the authors, awarded following a tender procedure. The present document is published complying with the transparency principle to which the Authority is subject. It may not be considered as an output adopted by the Authority. The European Food Safety Authority reserves its rights, view and position as regards the issues addressed and the conclusions reached in the present document, without prejudice to the rights of the authors.
Quantitative Pathway Analysis QPAFood
Table 4.5.01: Summary of the change in risk period and the change in pest risk potential associated with a 25% increase in the maximum duration in all stages of the trade chain. The change in risk period calculated as the shift in the 95th percentile of the duration of the final stage of each trade chain (see Fig. 4.5.01; the change in pest risk potential is the sum of infested volume lost, corrected for infestation level, across all stages of the trade chain. The relative risk potential shows, per unit commodity on the trade chain, the percentage of the risk associated with each trade chain
Trade chain number
Change in risk period (95 %ile)
1 2 3 4
108% 116% 112% 111%
Relative risk potential Change in As Stage pest risk paramter durations + potential ised 25% 92% 89% 94% 68%
51% 43% 6% 0.1%
52% 42% 6% 0.1%
Table 4.5.02: Key inputs in the scenario where output is in the upper quartile (greater than 75%) of trade chain duration. Input percentiles are shown for each key input; this shows the strength of the association with simulations where the output values were highest, the higher the percentile the stronger the association
Trade chain number 1 2 3 4
Key inputs associated with long duration scenarios At consumer At wholesaler and storage; At consumer At airport; Transport to wholesaler and storage; At retailer At processor; At airport; Transport to retail; At consumer
www.efsa.europa.eu/publications
148
Input percentiles 86% 81%; 76% 76%; 68%; 67% 81%; 79%; 68%; 69%
EFSA Supporting publication 2016:EN-1062
The present document has been produced and adopted by the bodies identified above as authors. This task has been carried out exclusively by the authors in the context of a contract between the European Food Safety Authority and the authors, awarded following a tender procedure. The present document is published complying with the transparency principle to which the Authority is subject. It may not be considered as an output adopted by the Authority. The European Food Safety Authority reserves its rights, view and position as regards the issues addressed and the conclusions reached in the present document, without prejudice to the rights of the authors.
Quantitative Pathway Analysis QPAFood
4.5.2.
Apple model
Four trade chains were identified as pathways of potential pest entry on desert apple commodity. These four trade chains involved different combinations of ten stages: on arrival; at airport or harbour; in transport to wholesale; at wholesale and storage; in transport to processor; at processor; in transport to retail; at retail; in transport to consumer; and at consumer. In each case better evidence was available to support an estimate of mean duration of each of these stages than to estimate the variance. Lower limits could be estimated on the basis of the most rapid duration that was logistically practical, but the upper limits were more uncertain. As a result, the sensitivity analysis focussed on the effect of changes in the upper limits on the distribution of commodity durations along the trade chains. It is not possible to show all the results, but to summarise, the distribution of durations associated with the last stage of each of the four trade chains is shown in Fig. 4.5.02. Two scenarios are shown for comparison: the results from the final model as parameterised, and where the upper limit of each stage was 25% longer than that estimated for the final model. A 25% increase was used in the case of the fruit models because it is a perishable product so there was less potential for the commodity to spend longer in each stage than was the case with wheat. The increase in overall period that the commodity could occur at the final point of the trade chain was between 1.13 and 1.18-fold greater in the scenario where the maximum of each stage was increased by 25% (this being measured by the duration which encompassed 95% of the distribution, Fig. 4.5.02). The smallest increase was seen in Trade chain 3 (therefore, this contained the least sensitive assumptions about maximum stage duration) and the largest increase was seen in Trade chain 1, but in the apple case study, there was little difference between the trade chains (Table 4.5.03). These increases in duration did not reflect a corresponding change in the potential for pest risk. The model incorporates pest mortality along the trade chain and as the time for the commodity to move through the trade chain increases this can lead to reduced infestation rates at later stages of the chain, depending on the biology of the pest concerned. If the later stages carry proportionately higher risk of pest release, then an increase in duration can lead to lower risk as a whole. This was particularly true for Trade chains 1 and 2 (Table 4.4.04), where compared to the other trade chains, a higher risk was associated with the last stage in the chain, at the consumer. In the other trade chains, there was less impact of increased trade chain duration on potential pest risk. As with the orange case study, it was Trade chains 1 and 2 that carried, per unit commodity, the highest relative risk potential for pest release leading to introduction. This reflects the higher risk associated with fresh retail rather than processed retail. It is important to remember that these results are per unit commodity travelling along the trade chain so that actual distribution of risk across all trade chains also depends upon the amounts associated with each trade chain. The @RISK software also provides a built-in function to show the most significant inputs determining any chosen output. Here we determine the key inputs associated with the upper quartile (top 25%) of trade chain durations. Table 4.5.04 shows those input variables where the median associated with the upper quartile of the results differed most (i.e. at least half a standard deviation) from the overall median. As can be seen in Table 4.5.04, in Trade chain 1, the total trade chain duration was strongly dependent on the period the commodity spent at the consumer before disposal. Trade chains 2 and 3 were more dependent on other steps in the chain, at wholesale and retail stages (Trade chain 2) and at airport and processor (Trade chain 3). Trade chain 4 showed dependency on some of the transport stages because in this trade chain the time spent at each stage was short, so the effects of transport time have more impact on the overall duration.
www.efsa.europa.eu/publications
149
EFSA Supporting publication 2016:EN-1062
The present document has been produced and adopted by the bodies identified above as authors. This task has been carried out exclusively by the authors in the context of a contract between the European Food Safety Authority and the authors, awarded following a tender procedure. The present document is published complying with the transparency principle to which the Authority is subject. It may not be considered as an output adopted by the Authority. The European Food Safety Authority reserves its rights, view and position as regards the issues addressed and the conclusions reached in the present document, without prejudice to the rights of the authors.
Quantitative Pathway Analysis QPAFood
Final model as parameterised
Maximum duration of all stages 25% longer
Trade chain 1 (Port to Retail to Consumer)
Trade chain 2 (Port to Wholesale/storage to Retail to Consumer)
Trade chain 3 (Port to Wholesaler/storage to Processor to Retailer to Consumer)
Trade chain 4 (Port to Processor to Retailer to Consumer)
Figure 4.5.02: Sensitivity of the trade chain durations to a 25% increase in the maximum duration in all stages of the chain. Results are shown for all the commodity routes modelled
www.efsa.europa.eu/publications
150
EFSA Supporting publication 2016:EN-1062
The present document has been produced and adopted by the bodies identified above as authors. This task has been carried out exclusively by the authors in the context of a contract between the European Food Safety Authority and the authors, awarded following a tender procedure. The present document is published complying with the transparency principle to which the Authority is subject. It may not be considered as an output adopted by the Authority. The European Food Safety Authority reserves its rights, view and position as regards the issues addressed and the conclusions reached in the present document, without prejudice to the rights of the authors.
Quantitative Pathway Analysis QPAFood
Table 4.5.03: Summary of the change in risk period and the change in pest risk potential associated with a 25% increase in the maximum duration in all stages of the chain. The change in risk period calculated as the shift in the 95 th percentile of the duration of the final stage of each trade chain (see Fig. 4.5.02; the change in pest risk potential is the sum of infested volume lost, corrected for infestation level, across all stages of the chain). The relative risk potential shows, per unit commodity on the trade chain, the percentage of the risk associated with each trade chain
Trade Change in chain risk period number (95 %ile) 1 2 3 4
118% 117% 113% 116%
Relative risk potential Change in As Stage pest risk paramter durations + potential ised 25% 92% 88% 96% 98%
54% 38% 5% 3%
55% 37% 5% 3%
Table 4.5.04: Key inputs in the scenario where output is in the upper quartile (greater than 75%) of trade chain duration. Input percentiles are shown for each key input; this shows the strength of the association with simulations where the output values were highest, the higher the percentile the stronger the association
Trade chain number 1 2 3 4
Key inputs associated with long duration scenarios At consumer At retailer; At wholesaler and storage; At consumer At airport; At processor; At consumer At airport; Transport to retail; Transport to processor
www.efsa.europa.eu/publications
151
Input percentiles 85% 78%; 76%; 80% 78%; 73%; 70% 80%; 74%; 69%
EFSA Supporting publication 2016:EN-1062
The present document has been produced and adopted by the bodies identified above as authors. This task has been carried out exclusively by the authors in the context of a contract between the European Food Safety Authority and the authors, awarded following a tender procedure. The present document is published complying with the transparency principle to which the Authority is subject. It may not be considered as an output adopted by the Authority. The European Food Safety Authority reserves its rights, view and position as regards the issues addressed and the conclusions reached in the present document, without prejudice to the rights of the authors.
Quantitative Pathway Analysis QPAFood
4.5.3.
Plum model
Four trade chains were identified as pathways of potential pest entry on the plum commodity. These four trade chains involved different combinations of ten stages: on arrival; at airport or harbour; in transport to wholesale; at wholesale and storage; in transport to processor; at processor; in transport to retail; at retail; in transport to consumer; and at consumer. In each case better evidence was available to support an estimate of mean duration of each of these stages than to estimate the variance. Lower limits could be estimated on the basis of the most rapid that was logistically practical, but the upper limits were uncertain. As a result, the sensitivity analysis focussed on the effect of changes in the upper limits on the distribution of commodity durations along the trade chains. It is not possible to show all the results, but to summarise, the distribution of durations associated with the last stage of each of the four trade chains is shown in Fig. 4.5.03. Two scenarios are shown for comparison: the results from the final model as parameterised, and where the upper limit of each stage was 25% longer than that estimated for the final model. A 25% increase was used in the case of the fruit models because it is a perishable product so there was less potential for the commodity to spend longer in each stage than was the case with wheat. The increase in overall period that the commodity could occur at the final point of the trade chain was between 1.11 and 1.17-fold greater in the scenario where the maximum of each stage was increased by 25% (this being measured by the duration which encompassed 95% of the distribution, Fig. 4.5.03). The smallest increase was seen in Trade chain 2 (therefore, it was least sensitive to assumptions about maximum stage duration) and the largest increase was seen in Trade chain 1, but as with the apple case study, there was little difference between the trade chains in the plum case study (Table 4.5.05). These increases in duration did not reflect a corresponding change in the potential for pest risk. The model incorporates pest mortality along the trade chain and as the time for the commodity to move through the trade chain increases this can lead to reduced infestation rates at later stages of the chain, depending on the biology of the pest concerned. If the later stages carry proportionately higher risk of pest release, then an increase in duration can lead to lower risk as a whole. In the case of plum, the effects were comparatively small but lowering of risk was most evident in Trade chain 1 and 2 (Table 4.5.05), where a higher risk was associated with the last stage in the chain, fresh fruit waste at the consumer. In the other trade chains, there was almost no impact of increased trade chain duration on potential pest risk. As with the orange and apple case studies, it was Trade chains 1 and 2 that carried, per unit commodity, the highest relative risk potential for pest release which could lead to introduction. This reflects the higher risk associated with fresh retail rather than processed retail. It is important to remember that these results are per unit commodity travelling along the trade chain so that actual distribution of risk across all trade chains also depends upon the amounts associated with each trade chain. The @RISK software also provides a built-in function to show the most significant inputs determining any chosen output. Here we determine the key input values associated with the upper quartile (top 25%) of trade chain durations. Table 4.5.06 shows those input variables where the median associated with the upper quartile of the results differed most (i.e. at least half a standard deviation) from the overall median. As can be seen in Table 4.5.06, in Trade chain 1, the total trade chain duration was strongly dependent on the period the commodity spent at the consumer before disposal. Trade chain 2 was also dependent on the period at wholesale. Trade chains 3 and 4 showed a broader spectrum of dependency on the input variables including some of the transport stages. As with apple, this was because in these trade chains, the time spent at each stage was short, so the effects of transport time have more impact on the overall duration.
www.efsa.europa.eu/publications
152
EFSA Supporting publication 2016:EN-1062
The present document has been produced and adopted by the bodies identified above as authors. This task has been carried out exclusively by the authors in the context of a contract between the European Food Safety Authority and the authors, awarded following a tender procedure. The present document is published complying with the transparency principle to which the Authority is subject. It may not be considered as an output adopted by the Authority. The European Food Safety Authority reserves its rights, view and position as regards the issues addressed and the conclusions reached in the present document, without prejudice to the rights of the authors.
Quantitative Pathway Analysis QPAFood
Final model as parameterised
Maximum duration of all stages 25% longer
Trade chain 1 (Port to Retail to Consumer)
Trade chain 2 (Port to Wholesale/storage to Retail to Consumer)
Trade chain 3 (Port to Wholesaler/storage to Processor to Retailer to Consumer)
Trade chain 4 (Port to Processor to Retailer to Consumer)
Figure 4.5.03: Sensitivity of the trade chain durations to a 25% increase in the maximum duration in all stages of the chain. Results are shown for all the commodity routes modelled
www.efsa.europa.eu/publications
153
EFSA Supporting publication 2016:EN-1062
The present document has been produced and adopted by the bodies identified above as authors. This task has been carried out exclusively by the authors in the context of a contract between the European Food Safety Authority and the authors, awarded following a tender procedure. The present document is published complying with the transparency principle to which the Authority is subject. It may not be considered as an output adopted by the Authority. The European Food Safety Authority reserves its rights, view and position as regards the issues addressed and the conclusions reached in the present document, without prejudice to the rights of the authors.
Quantitative Pathway Analysis QPAFood
Table 4.5.05: Summary of the change in risk period and the change in pest risk potential associated with a 25% increase in the maximum duration in all stages of the chain. The change in risk period calculated as the shift in the 95 th percentile of the duration of the final stage of each trade chain (see Fig. 4.5.03; the change in pest risk potential is the sum of infested volume lost, corrected for infestation level at that stage, across all stages of the chain. The relative risk potential shows, per unit commodity on the trade chain, the percentage of the risk associated with each trade chain
Relative risk potential Trade Change in Change in As Stage chain risk period pest risk paramter durations + number (95 %ile) potential ised 25% 1 2 3 4
117% 111% 112% 112%
94% 93% 97% 99%
38% 34% 17% 11%
38% 33% 18% 11%
Table 4.5.06: Key inputs in the scenario where output is in the upper quartile (greater than 75%) of trade chain duration. Input percentiles are shown for each key input; this shows the strength of the association with simulations where the output values were highest, the higher the percentile the stronger the association
Trade chain number 1 2 3 4
Key inputs associated with long duration scenarios At consumer At consumer; At wholesaler and storage Transport to processor; At retailer; At airport; At processor Transport to retail; At retailer; At processor; At airport; At consumer
www.efsa.europa.eu/publications
154
Input percentiles 87% 85%; 71% 71%; 70%; 69%; 68% 74%; 75%; 75%; 70%; 70%
EFSA Supporting publication 2016:EN-1062
The present document has been produced and adopted by the bodies identified above as authors. This task has been carried out exclusively by the authors in the context of a contract between the European Food Safety Authority and the authors, awarded following a tender procedure. The present document is published complying with the transparency principle to which the Authority is subject. It may not be considered as an output adopted by the Authority. The European Food Safety Authority reserves its rights, view and position as regards the issues addressed and the conclusions reached in the present document, without prejudice to the rights of the authors.
Quantitative Pathway Analysis QPAFood
4.5.4.
Wheat model
Eight trade chains were identified as pathways of potential pest entry on wheat grain commodity. These eight trade chains involved different combinations of seventeen stages: at airport or harbour, in transport to wholesale, at wholesale and storage, in transport to mill, at mill, in transport to feed manufacturer, at feed manufacturer, in transport to farm, at farm storage, in transport to livestock, at livestock, in transport to food processor, at food processor, in transport to retailer, at retailer, in transport to consumer, and at consumer. In each case better evidence was available to support an estimate of mean duration of each of these stages than to estimate the variance. Lower limits could be estimated on the basis of the most rapid duration that was logistically practical, but the upper limits were uncertain. As a result, the sensitivity analysis focussed on the effect of changes in the upper limits on the distribution of commodity durations along the trade chains. It is not possible to show all the results, but to summarise, the distribution of durations associated with the last stage of each of the eight trade chains is shown in Fig. 4.5.04. Two scenarios are shown for comparison: the results from the final model as parameterised, and where the upper limit of each stage was 50% longer than that estimated for the final model. A 50% increase was used in the case of the wheat model because it is a less perishable product than the fruit case studies, so there is more potential for the commodity to spend longer in each stage. The increase in overall period that the commodity could occur at the final point of the trade chain was between 1.2 and 1.44-fold greater in the scenario where the maximum of each stage was increased by 50% (this being measured by the duration which encompassed 95% of the distribution, Fig. 4.5.04). The smallest increases were seen in Trade chains 8, 7 and 6 so these were less sensitive assumptions about maximum stage duration. The largest increases were seen in Trade chains 4, 2 and 8, so these were correspondingly more sensitive (Table 4.5.07). These increases in duration did not reflect a corresponding change in the potential for pest risk. The model incorporates pest mortality along the trade chain and as the time for the commodity to move through the trade chain increases this can lead to reduced infestation rates at later stages of the chain, depending on the biology of the pest concerned. If the later stages carry proportionately high risks of pest release, then an increase in duration can lead to lower risk as a whole. This was particularly true for Trade chain 3 (Table 4.5.07), where the highest risk was associated with the last stage in the chain, the point of feeding to livestock. Trade chain 1 reflected similar circumstances of higher risk at later stages. In the other trade chains, there was little impact of increased trade chain duration on potential pest risk. It was also Trade chains 1 and 3 that carried, per unit commodity, the highest relative risk potential for pest contact which could lead to introduction. An increase in all trade chain durations therefore had most impact in reducing risk on those trade chains that carried the highest risk. It is important to remember that these results are per unit commodity travelling along the trade chain so that the actual distribution of risk across all trade chains also depends upon the amounts associated with each trade chain. The @RISK software also provides a built-in function to show the most significant inputs determining any chosen output. Here we determine the key inputs associated with the upper quartile (top 25%) of trade chain durations. Table 4.5.07 shows those input variables where the median associated with the upper quartile of the results differed most (i.e. at least ½ a standard deviation) from the overall median. As can be seen in Table 4.5.08, where some form of storage was involved in a trade chain this was usually the critical step, otherwise the critical step or steps were often associated with the various processing activities (milling, feed manufacture). It is of note that transport duration itself was never a critical variable.
www.efsa.europa.eu/publications
155
EFSA Supporting publication 2016:EN-1062
The present document has been produced and adopted by the bodies identified above as authors. This task has been carried out exclusively by the authors in the context of a contract between the European Food Safety Authority and the authors, awarded following a tender procedure. The present document is published complying with the transparency principle to which the Authority is subject. It may not be considered as an output adopted by the Authority. The European Food Safety Authority reserves its rights, view and position as regards the issues addressed and the conclusions reached in the present document, without prejudice to the rights of the authors.
Quantitative Pathway Analysis QPAFood
Final model as parameterised
Maximum duration of all stages 50% longer
Trade chain 1 (Port to Mill, grain feed to Farm to Livestock)
Trade chain 2 (Port to Mill; grain plus by-product to Feed manufacturer)
Trade chain 3 (Port to Storage to Mill, grain feed to Farm to Livestock)
Figure 4.5.04: Sensitivity of the trade chain durations to a 50% increase in the maximum duration in all stages of the chain. Results are shown for all the commodity routes modelled
www.efsa.europa.eu/publications
156
EFSA Supporting publication 2016:EN-1062
The present document has been produced and adopted by the bodies identified above as authors. This task has been carried out exclusively by the authors in the context of a contract between the European Food Safety Authority and the authors, awarded following a tender procedure. The present document is published complying with the transparency principle to which the Authority is subject. It may not be considered as an output adopted by the Authority. The European Food Safety Authority reserves its rights, view and position as regards the issues addressed and the conclusions reached in the present document, without prejudice to the rights of the authors.
Quantitative Pathway Analysis QPAFood
Final model as parameterised
Maximum duration of all stages 50% longer
Trade chain 4 (Port to Storage to Mill, grain plus by-product to Feed manufacturer)
Trade chain 5 (Port to Mill, flour and grain products to Food Processor)
Trade chain 6 (Port to Storage to Mill, flour and grain products to Food processor)
Figure 4.5.04: Sensitivity of the trade chain durations to a 50% increase in the maximum duration in all stages of the chain. Results are shown for all the commodity routes modelled
www.efsa.europa.eu/publications
157
EFSA Supporting publication 2016:EN-1062
The present document has been produced and adopted by the bodies identified above as authors. This task has been carried out exclusively by the authors in the context of a contract between the European Food Safety Authority and the authors, awarded following a tender procedure. The present document is published complying with the transparency principle to which the Authority is subject. It may not be considered as an output adopted by the Authority. The European Food Safety Authority reserves its rights, view and position as regards the issues addressed and the conclusions reached in the present document, without prejudice to the rights of the authors.
Quantitative Pathway Analysis QPAFood
Final model as parameterised
Maximum duration of all stages 50% longer
Trade chain 7 (Port to Mill, flour products to Retail to Consumer)
Trade chain 8 (Port to Storage to Mill, flour products to Retail to Consumer)
Figure 4.5.04: Sensitivity of the trade chain durations to a 50% increase in the maximum duration in all stages of the chain. Results are shown for all the commodity routes modelled
www.efsa.europa.eu/publications
158
EFSA Supporting publication 2016:EN-1062
The present document has been produced and adopted by the bodies identified above as authors. This task has been carried out exclusively by the authors in the context of a contract between the European Food Safety Authority and the authors, awarded following a tender procedure. The present document is published complying with the transparency principle to which the Authority is subject. It may not be considered as an output adopted by the Authority. The European Food Safety Authority reserves its rights, view and position as regards the issues addressed and the conclusions reached in the present document, without prejudice to the rights of the authors.
Quantitative Pathway Analysis QPAFood
Table 4.5.07: Summary of the change in risk period and the change in pest risk potential associated with a 50% increase in the maximum duration in all stages of the chain. The change in risk period calculated as the shift in the 95 th percentile of the duration of the final stage of each trade chain (see Fig. 3.2.4.1; the change in pest risk potential is the sum of infested volume lost, corrected for infestation level, across all stages of the chain. The relative risk potential shows, per unit commodity on the trade chain, the percentage of the risk associated with each trade chain
Trade Change in chain risk period number (95 %ile) 1 2 3 4 5 6 7 8
131% 136% 131% 145% 128% 120% 126% 136%
Relative risk potential Change in As Stage pest risk paramteri durations potential sed + 25% 83% 99% 67% 93% 99% 93% 99% 103%
56% 4% 15% 5% 4% 5% 4% 5%
54% 5% 12% 6% 5% 6% 5% 6%
Table 4.5.08: Key inputs in the scenario where output is in the upper quartile (greater than 75%) of trade chain duration. Input percentiles are shown for each key input; this shows the strength of association with simulations where the output values were highest, the higher the percentile the stronger the association
Trade chain number 1 2 3 4 5 6 7 8
Key inputs associated with long duration scenarios At farm storage At mill; At feed manufacturer At wholesaler and storage At wholesaler and storage At mill; At food processor At wholesaler and storage At consumer; At mill; At retailer At wholesaler and storage
www.efsa.europa.eu/publications
Input percentiles 87% 83%; 75% 87% 87% 82%; 72% 87% 85%; 77%; 67% 87%
159
EFSA Supporting publication 2016:EN-1062
The present document has been produced and adopted by the bodies identified above as authors. This task has been carried out exclusively by the authors in the context of a contract between the European Food Safety Authority and the authors, awarded following a tender procedure. The present document is published complying with the transparency principle to which the Authority is subject. It may not be considered as an output adopted by the Authority. The European Food Safety Authority reserves its rights, view and position as regards the issues addressed and the conclusions reached in the present document, without prejudice to the rights of the authors.
Quantitative Pathway Analysis QPAFood
4.6. 4.6.1.
Comparison of models General models
The four case studies using the models revealed some interesting differences in the patterns of risk across EU Member States. In the summaries presented in this section for model comparison, two sets of figures are shown. Figures 4.6.01 to 4.6.04 show the percentages of EU imports of the pest-infested commodity entering each EU Member State over the period of the study, 2010 to 2014. The import percentages include the net transhipments of infested commodity between Member States. The second set of figures, Figures 4.6.05 to 4.6.08 show the NUTS2 regions and months having greatest risk of pest contact which could lead to establishment. This is calculated as the product of the volume of the infested material volume arriving (100 kg units) and vulnerable area accessible by the pest (km2). To show the relative risk associated with different types of use, the contact risk is disaggregated into that associated with the retail trade chains and that associated with processing trade chains. Contact risk therefore depends upon both imports and presence of hosts in the Member State, so for example, there are large imports of infested sweet orange into the Netherlands but the contact risk is negligible because there is no commercial production. In the orange pest case study, more than 50% of the total infested imports entered two states, Spain and the Netherlands, and the top eight importers represented about 90% of all imports (Fig. 4.6.01). Of these, Spain, Italy and Portugal, and to a lesser extent, France, offered the greatest opportunity for pest contact. This was reflected in the detailed analysis of contact risk by NUTS2 region and month of the year. Of the 30 most risky region-month combinations, 24 were in Spain, 4 in Italy and 2 in Portugal (Fig. 4.6.05). For Spain only, highly commodity specific information was available about the locations of orange processors and risk associated processing use was therefore associated only with those NUTS2 regions specifically identified to contain orange processors. Of these, Andalucía, Valencia and Murcia featured with some significant risk associated with processing. It is also evident that risk associated with processing uses is very small compared to retail uses. This is because comparatively expensive imported commodity is used mainly for higher value retail uses. In countries other than Spain, the locations of processors were determined by the distribution of fruit and vegetable processing enterprises in general and very small risk associated with processing risk was identified in Lombardia, Italy and Lisboa, Portugal. In the apple pest case study, nearly 90% of the total infested imports were to the UK with most of the remainder in Finland, Sweden, Ireland, Spain and Netherlands. The source countries of the pest were limited to US and Canada and the export patterns of these countries explains the much more focussed fate of infested commodity in a particular EU state than was the case with orange (Fig. 4.6.02). However, within the UK, the risk was widely spread across many locations, reflecting both the wide distribution of apple production and food processing. As a percentage of total imported apple use, apple processing use was a more significant component of risk than was the case for orange. All of the top 30 most risky region-month combinations occurred in the UK (Fig. 4.6.06). The most risky non-UK region was ranked 87th and was Lietuva (Lithuania), in July, which was associated with 0.3% of the total EU risk. In the plum pest case study, the sources of the pest were also restricted to US and Canada but, reflecting the import patterns, the risk showed a wider distribution between Member States with UK, Belgium, France, Netherlands and Germany together associated with about 95% of the infested imports to the EU (Fig. 4.6.03). The UK represented about two-thirds of the total infested imports. Within Member States, the risk was very highly localised compared to the apple case study with about one-third of all EU risk occurring in one NUTS2 region in one month, Kent (UK) in August (Fig. 4.6.07). The top 5 region and month combinations represented nearly 60% of all risk. All were in the UK. Although the risk distribution curve declines steeply (Fig. 4.6.07), within the top 30, the risk was also widely distributed in Germany (14 of top 30) and also present in France (two of top 30). Processing of imported plums was a very minor use and this was reflected in the proportion of risk associated with processing (Fig. 4.6.07). In the wheat pest case study, the sources of the pest were various countries in South America and Australasia. Italy and Spain together accounted for about 90% of the entry of potentially infested imports, with Germany and Portugal, and to a lesser extent Romania, Netherlands and the UK, accounting for the remainder (Fig. 4.6.04). Within the importing countries the risk was widely distributed between NUTS2 www.efsa.europa.eu/publications
160
EFSA Supporting publication 2016:EN-1062
The present document has been produced and adopted by the bodies identified above as authors. This task has been carried out exclusively by the authors in the context of a contract between the European Food Safety Authority and the authors, awarded following a tender procedure. The present document is published complying with the transparency principle to which the Authority is subject. It may not be considered as an output adopted by the Authority. The European Food Safety Authority reserves its rights, view and position as regards the issues addressed and the conclusions reached in the present document, without prejudice to the rights of the authors.
Quantitative Pathway Analysis QPAFood
regions; there were similarities with the apple case study in this respect. Of the 30 most risky region and month combinations, there were 19 in Italy, eight in Spain, and three in Netherlands, Zuid Holland in particular (Fig. 4.6.08). The latter was associated particularly with the port of entry, Rotterdam. The overall pattern of risk also reflected other major ports of entry, e.g Hamburg and Liverpool. Risk associated with milling uses dominated which reflected the dominant commodity use. The distribution amongst NUTS2 regions was based on the number of milling enterprises. The location of Industrial uses was based on the locations of biofuel enterprises attributed to NUTS2 region categorized under NACE code 20.14, which includes fermentation of sugarcane, corn or similar to produce alcohol and esters. The pattern of risk associated with industrial uses was widespread across NUTS2 regions, to a degree appearing to be correlated with milling risks but not in every case. For example risk associated with industrial used was very low in Sicilia, Castilla y Lion and Castilla la Mancha (Fig. 4.6.08).
www.efsa.europa.eu/publications
161
EFSA Supporting publication 2016:EN-1062
The present document has been produced and adopted by the bodies identified above as authors. This task has been carried out exclusively by the authors in the context of a contract between the European Food Safety Authority and the authors, awarded following a tender procedure. The present document is published complying with the transparency principle to which the Authority is subject. It may not be considered as an output adopted by the Authority. The European Food Safety Authority reserves its rights, view and position as regards the issues addressed and the conclusions reached in the present document, without prejudice to the rights of the authors.
Quantitative Pathway Analysis QPAFood
35.0%
100.0% 90.0%
30.0%
80.0%
25.0%
70.0%
20.0%
60.0% 50.0%
15.0%
40.0%
10.0%
30.0%
20.0%
5.0%
10.0%
CYPRUS
ESTONIA
LUXEMBOURG
LATVIA
HUNGARY
SLOVENIA
MALTA
BULGARIA
FINLAND
SLOVAKIA
GREECE
CROATIA
AUSTRIA
ROMANIA
LITHUANIA
IRELAND
CZECH REPUBLIC (CS->1992)
POLAND
DENMARK
SWEDEN
PORTUGAL
BELGIUM (and LUXBG -> 1998)
ITALY
GERMANY (incl DD from 1991)
FRANCE
UNITED KINGDOM
SPAIN
0.0%
NETHERLANDS
0.0%
Figure 4.6.01: The percentages of EU imports and net transhipments of pest-infested sweet orange entering each EU Member State over the period 2010 to 2014. Member States are shown in rank order (histogram) and the cumulative percentage is also indicated (red line)
CROATIA
CYPRUS
SLOVENIA
BULGARIA
MALTA
HUNGARY
GREECE
AUSTRIA
ROMANIA
SLOVAKIA
LUXEMBOURG
ITALY
LATVIA
PORTUGAL
0.0%
POLAND
10.0%
0.0%
CZECH REPUBLIC (CS->1992)
10.0%
ESTONIA
20.0%
DENMARK
30.0%
20.0%
FRANCE
40.0%
30.0%
LITHUANIA
40.0%
GERMANY (incl DD from 1991)
50.0%
NETHERLANDS
60.0%
50.0%
BELGIUM (and LUXBG -> 1998)
70.0%
60.0%
SPAIN
80.0%
70.0%
IRELAND
80.0%
SWEDEN
90.0%
FINLAND
100.0%
90.0%
UNITED KINGDOM
100.0%
Figure 4.6.02: The percentages of EU imports and net transhipments of pest-infested desert apple entering each EU Member State over the period 2010 to 2014. Member States are shown in rank order (histogram) and the cumulative percentage is also indicated (red line)
www.efsa.europa.eu/publications
162
EFSA Supporting publication 2016:EN-1062
The present document has been produced and adopted by the bodies identified above as authors. This task has been carried out exclusively by the authors in the context of a contract between the European Food Safety Authority and the authors, awarded following a tender procedure. The present document is published complying with the transparency principle to which the Authority is subject. It may not be considered as an output adopted by the Authority. The European Food Safety Authority reserves its rights, view and position as regards the issues addressed and the conclusions reached in the present document, without prejudice to the rights of the authors.
Quantitative Pathway Analysis QPAFood
70.0%
100.0% 90.0%
60.0%
80.0%
50.0%
70.0%
40.0%
60.0% 50.0%
30.0%
40.0%
20.0%
30.0%
20.0%
10.0%
10.0%
BULGARIA
GREECE
CYPRUS
SLOVENIA
MALTA
CROATIA
ROMANIA
HUNGARY
LATVIA
SLOVAKIA
ESTONIA
PORTUGAL
AUSTRIA
LUXEMBOURG
CZECH REPUBLIC (CS->1992)
SWEDEN
FINLAND
ITALY
DENMARK
POLAND
IRELAND
SPAIN
LITHUANIA
GERMANY (incl DD from 1991)
FRANCE
NETHERLANDS
UNITED KINGDOM
0.0%
BELGIUM (and LUXBG -> 1998)
0.0%
Figure 4.6.03: The percentages of EU imports and net transhipments of pest-infested plum entering each EU Member State over the period 2010 to 2014. Member States are shown in rank order (histogram) and the cumulative percentage is also indicated (red line) 70.0%
100.0%
90.0%
60.0%
80.0%
50.0%
70.0%
40.0%
60.0% 50.0%
30.0%
40.0%
20.0%
30.0% 20.0%
10.0%
10.0%
CROATIA
LATVIA
ESTONIA
CZECH REPUBLIC (CS->1992)
CYPRUS
LITHUANIA
SLOVENIA
BULGARIA
FINLAND
SLOVAKIA
HUNGARY
LUXEMBOURG
IRELAND
POLAND
DENMARK
GREECE
SWEDEN
MALTA
AUSTRIA
FRANCE
BELGIUM (and LUXBG -> 1998)
UNITED KINGDOM
ROMANIA
NETHERLANDS
PORTUGAL
GERMANY (incl DD from 1991)
ITALY
0.0%
SPAIN
0.0%
Figure 4.6.04: The percentages of EU imports and net transhipments of pest-infested wheat entering each EU Member State over the period 2010 to 2014. Member States are shown in rank order (histogram) and the cumulative percentage is also indicated (red line)
www.efsa.europa.eu/publications
163
EFSA Supporting publication 2016:EN-1062
The present document has been produced and adopted by the bodies identified above as authors. This task has been carried out exclusively by the authors in the context of a contract between the European Food Safety Authority and the authors, awarded following a tender procedure. The present document is published complying with the transparency principle to which the Authority is subject. It may not be considered as an output adopted by the Authority. The European Food Safety Authority reserves its rights, view and position as regards the issues addressed and the conclusions reached in the present document, without prejudice to the rights of the authors.
Quantitative Pathway Analysis QPAFood
0.0%
2.0%
4.0%
6.0%
8.0%
ES61 - Andalucía, Sep ES61 - Andalucía, Aug
ES51 - Cataluña, Sep ES61 - Andalucía, Oct ES30 - Comunidad de Madrid, Sep ES52 - Comunidad Valenciana, Sep ES51 - Cataluña, Aug ES30 - Comunidad de Madrid, Aug ES52 - Comunidad Valenciana, Aug ES61 - Andalucía, Jul ES51 - Cataluña, Oct
ITC4 - Lombardia, Jul ES42 - Castilla-la Mancha, Sep ES30 - Comunidad de Madrid, Oct ES41 - Castilla y León, Sep ES52 - Comunidad Valenciana, Oct ES62 - Región de Murcia, Sep ITF3 - Campania, Jul ES42 - Castilla-la Mancha, Aug ES41 - Castilla y León, Aug
PT17 - Lisboa, Aug ES51 - Cataluña, Jul ITC4 - Lombardia, Aug ES30 - Comunidad de Madrid, Jul ITF3 - Campania, Sep PT17 - Lisboa, Jul
Retail risk
ES62 - Región de Murcia, Aug
Proc. risk
ES42 - Castilla-la Mancha, Oct
Figure 4.6.05: The percentage of the total EU risk falling in particular EU regions and months. In rank order based on five-year average trade, the top 30 NUTS2 regions and months having greatest risk of pest contact which could lead to establishment. This is calculated as the product of the volume of the infested material volume arriving (100 kg units) and vulnerable area accessible by pest (km 2). The contact risk is disaggregated into that associated with retail use and that associated with processing use of imported sweet orange
www.efsa.europa.eu/publications
164
EFSA Supporting publication 2016:EN-1062
The present document has been produced and adopted by the bodies identified above as authors. This task has been carried out exclusively by the authors in the context of a contract between the European Food Safety Authority and the authors, awarded following a tender procedure. The present document is published complying with the transparency principle to which the Authority is subject. It may not be considered as an output adopted by the Authority. The European Food Safety Authority reserves its rights, view and position as regards the issues addressed and the conclusions reached in the present document, without prejudice to the rights of the authors.
Quantitative Pathway Analysis QPAFood
0.0%
1.0%
2.0%
3.0%
4.0%
5.0%
UKH1 - East Anglia, May UKH1 - East Anglia, Jun UKH1 - East Anglia, Jul UKK1 - Gloucestershire, Wiltshire and Bristol/Bath area, May UKJ1 - Berkshire, Buckinghamshire and Oxfordshire, May UKF2 - Leicestershire, Rutland and Northamptonshire, May
UKJ3 - Hampshire and Isle of Wight, May UKF1 - Derbyshire and Nottinghamshire, May UKK1 - Gloucestershire, Wiltshire and Bristol/Bath area, Jun UKJ1 - Berkshire, Buckinghamshire and Oxfordshire, Jun UKH3 - Essex, May UKK1 - Gloucestershire, Wiltshire and Bristol/Bath area, Jul UKJ1 - Berkshire, Buckinghamshire and Oxfordshire, Jul UKF2 - Leicestershire, Rutland and Northamptonshire, Jun UKG1 - Herefordshire, Worcestershire and Warwickshire, May
UKJ4 - Kent, May UKF2 - Leicestershire, Rutland and Northamptonshire, Jul UKH2 - Bedfordshire and Hertfordshire, May UKE1 - East Yorkshire and Northern Lincolnshire, May UKH1 - East Anglia, Aug UKG3 - West Midlands, May UKJ3 - Hampshire and Isle of Wight, Jun UKF1 - Derbyshire and Nottinghamshire, Jun UKJ3 - Hampshire and Isle of Wight, Jul Retail risk
UKF1 - Derbyshire and Nottinghamshire, Jul UKH3 - Essex, Jun
Proc. risk
UKG2 - Shropshire and Staffordshire, May UKH3 - Essex, Jul
Figure 4.6.06: The percentage of the total EU risk falling in particular EU regions and months. In rank order based on five-year average trade, the top 30 NUTS2 regions and months having greatest risk of pest contact which could lead to establishment. This is calculated as the product of the volume of the infested material volume arriving (100 kg units) and vulnerable area accessible by pest (km 2). The contact risk is disaggregated into that associated with retail use and that associated with processing use of imported apple
www.efsa.europa.eu/publications
165
EFSA Supporting publication 2016:EN-1062
The present document has been produced and adopted by the bodies identified above as authors. This task has been carried out exclusively by the authors in the context of a contract between the European Food Safety Authority and the authors, awarded following a tender procedure. The present document is published complying with the transparency principle to which the Authority is subject. It may not be considered as an output adopted by the Authority. The European Food Safety Authority reserves its rights, view and position as regards the issues addressed and the conclusions reached in the present document, without prejudice to the rights of the authors.
Quantitative Pathway Analysis QPAFood
0.0%
10.0%
20.0%
30.0%
40.0%
UKJ4 - Kent, Aug UKJ4 - Kent, Jul
UKJ4 - Kent, Sep UKJ2 - Surrey, East and West Sussex, Aug UKG1 - Herefordshire, Worcestershire and Warwickshire, Aug UKJ4 - Kent, Jun UKJ2 - Surrey, East and West Sussex, Jul DEA1 - Düsseldorf, Aug UKJ2 - Surrey, East and West Sussex, Sep UKH1 - East Anglia, Aug UKG1 - Herefordshire, Worcestershire and Warwickshire, Jul
FR10 - Île de France, Aug UKG1 - Herefordshire, Worcestershire and Warwickshire, Sep DEA3 - Münster, Aug DEF0 - Schleswig-Holstein, Aug DE11 - Stuttgart, Aug UKF3 - Lincolnshire, Aug DE21 - Oberbayern, Aug DEE0 - Sachsen-Anhalt, Aug DE94 - Weser-Ems, Aug
DE40 - Brandenburg, Aug DE92 - Hannover, Aug DEA2 - Köln, Aug FR10 - Île de France, Jul DEA4 - Detmold, Aug DE71 - Darmstadt, Aug
Retail risk
DEG0 - Thüringen, Aug
Proc. risk
DE80 - Mecklenburg-Vorpommern, Aug
Figure 4.6.07: The percentage of the total EU risk falling in particular EU regions and months. In rank order based on five-year average trade, the top 30 NUTS2 regions and months having greatest risk of pest contact which could lead to establishment. This is calculated as the product of the volume of the infested material volume arriving (100 kg units) and vulnerable area accessible by pest (km 2). The contact risk is disaggregated into that associated with retail use and that associated with processing use of imported plum
www.efsa.europa.eu/publications
166
EFSA Supporting publication 2016:EN-1062
The present document has been produced and adopted by the bodies identified above as authors. This task has been carried out exclusively by the authors in the context of a contract between the European Food Safety Authority and the authors, awarded following a tender procedure. The present document is published complying with the transparency principle to which the Authority is subject. It may not be considered as an output adopted by the Authority. The European Food Safety Authority reserves its rights, view and position as regards the issues addressed and the conclusions reached in the present document, without prejudice to the rights of the authors.
Quantitative Pathway Analysis QPAFood
0.0%
1.0%
2.0%
3.0%
4.0%
5.0%
ITH5 - Emilia-Romagna, Apr ITH5 - Emilia-Romagna, Mar
ITH5 - Emilia-Romagna, Jun ES61 - Andalucía, Feb ITH3 - Veneto, Apr ITH3 - Veneto, Mar ITH5 - Emilia-Romagna, May ES41 - Castilla y León, Feb ITH3 - Veneto, Jun ITG1 - Sicilia, Apr ITG1 - Sicilia, Jun
ITG1 - Sicilia, Mar ITH5 - Emilia-Romagna, Feb ITH3 - Veneto, May ES61 - Andalucía, Jan NL33 - Zuid-Holland, Apr NL33 - Zuid-Holland, Jun ES61 - Andalucía, Mar ITG1 - Sicilia, May ITH5 - Emilia-Romagna, Nov
ES24 - Aragón, Feb ITH3 - Veneto, Feb ES41 - Castilla y León, Jan ES51 - Cataluña, Feb ITC1 - Piemonte, Jun
Milling risk Indust. risk
ES42 - Castilla-la Mancha, Feb NL33 - Zuid-Holland, May ITC1 - Piemonte, Apr
Figure 4.6.08: The percentage of the total EU risk falling in particular EU regions and months. In rank order based on five-year average trade, the top 30 NUTS2 regions and months having greatest risk of pest contact which could lead to establishment. This is calculated as the product of the volume of the infested material volume arriving (100 kg units) and vulnerable area accessible by pest (km 2). The contact risk is disaggregated into that associated with milling use and that associated with industrial use of imported wheat
www.efsa.europa.eu/publications
167
EFSA Supporting publication 2016:EN-1062
The present document has been produced and adopted by the bodies identified above as authors. This task has been carried out exclusively by the authors in the context of a contract between the European Food Safety Authority and the authors, awarded following a tender procedure. The present document is published complying with the transparency principle to which the Authority is subject. It may not be considered as an output adopted by the Authority. The European Food Safety Authority reserves its rights, view and position as regards the issues addressed and the conclusions reached in the present document, without prejudice to the rights of the authors.
Quantitative Pathway Analysis QPAFood
4.6.2.
Consignment models
The models of the three fruit commodities were developed to share a common structure which has the potential to be employed for other similar risk analysis objectives relating to fruit pests. In these models, four possible routes for trade chains were identified associated with the use of fresh fruit imports to EU Member States:
Trade chain 1 (Port/Airport to Retail to Consumer)
Trade chain 2 (Port/Airport to Wholesale/storage to Retail to Consumer)
Trade chain 3 (Port/Airport to Wholesaler/storage to Processor to Retailer to Consumer)
Trade chain 4 (Port/Airport to Processor to Retailer to Consumer)
Analysis of the models revealed commonalities and differences between the three fruit pest case studies. Trade chain durations were of broadly similar length for the three fruit models with plum traveling through the chains slightly more quickly because of its more perishable nature compared to the other fruits. For all three fruits the duration of the risk period (at the final stage of the trade chains) was long, being up to about two weeks, depending on the specific trade chain (Table 4.6.09). For all the fruit models, Trade chains 1 and 2 where about twice the duration of Trade chains 3 and 4. This was because retail and consumption of whole fresh product has a longer time frame than that of processed product such as fruit pieces. Due to their inherent features, some chains were more likely to result in pest release than others and Trade chains 1 and 2, associated with fresh produce, carried higher risk for all fruits. It is interesting to note that in the case of plum, risk was spread more evenly across all trade chains (Table 4.6.10). For orange, risk was very low for Trade chain 4. This table concerns potential risk as a property of the trade chain. The actual distribution of risk also depends on the distribution of commodity use as discussed in the general model. By identifying the values of the various inputs in those simulations which result in high (long duration) values, it is possible to identify those inputs which are most influential in causing long duration situations. In Table 4.2.3, the influential inputs for the three fruit models are compared for each trade chain in turn. For all fruits, the duration or Trade chain 1 was heavily influenced by the time the fruit spends at the consumer before any waste occurs. Trade chain 2 was also influenced strongly by the period at the consumer and also by the period spent at the wholesaler; apple in particular was associated with period at the retailer. The durations of Trade chains 3 and 4 had a more complicated dependency for all fruits and notably the period spent at the airport after arrival was consistently influential. The period of transportation to retail was also consistently influential in Trade chain 4. The more complicated dependency in Trade chains 3 and 4 was caused by the rapid throughput of these chains which made the otherwise relatively rapid stages such as transport a more significant part of the whole period. The colour-shaded cells in Table 4.6.11 show the row and column frequencies of the influential inputs. Over all the trade chains, the best way to speed up the movement of commodity, and therefore reduce the period of pest exposure would be, in order of importance, to reduce time spent at the consumer, at the airport and at the retailer and at the processor (if appropriate). However, if we consider that Trade chains 1 and 2 had consistently higher inherent risk, and that fresh use has much higher volume than processed (see general models) then it is the periods at the consumer and at the wholesaler (if appropriate) which are the overwhelmingly critical steps.
www.efsa.europa.eu/publications
168
EFSA Supporting publication 2016:EN-1062
The present document has been produced and adopted by the bodies identified above as authors. This task has been carried out exclusively by the authors in the context of a contract between the European Food Safety Authority and the authors, awarded following a tender procedure. The present document is published complying with the transparency principle to which the Authority is subject. It may not be considered as an output adopted by the Authority. The European Food Safety Authority reserves its rights, view and position as regards the issues addressed and the conclusions reached in the present document, without prejudice to the rights of the authors.
Quantitative Pathway Analysis QPAFood
Table. 4.6.09: Comparison of trade chain durations (days from arrival) in the three fruit final models as parameterised, showing the start and ends times of the bulk of the distribution (from the 5 th to 95th percentiles) and the period between them
Trade 5th percentile 95th percentile Interval chain Orange Apple Plum Orange Apple Plum Orange Apple Plum 1 12.3 12.7 11.0 25.9 24.9 23.9 13.7 12.3 12.9 2 16.8 17.0 15.3 31.6 31.5 29.0 14.8 14.5 13.7 3 9.4 9.3 7.9 15.7 16.0 12.7 6.3 6.7 4.8 4 7.7 8.0 6.6 13.7 13.4 10.3 6.0 5.4 3.7
Table 4.6.10: Comparison between the three fruit models of the relative pest risk potential associated with each trade chain, per unit commodity on the trade chain
Trade Relative risk potential chain Orange Apple Plum 1 51% 54% 38% 2 43% 38% 34% 3 6% 5% 17% 4 0.1% 3% 11%
Table 4.6.11: Comparison of the three fruit models, orange (Or.), apple (Ap.) and plum (Pl.) showing at which points in the trade chains the key inputs associated with long trade chain durations occur. The input percentiles are shown for each key input; this shows the strength of the association with high (above 75th percentile) output values; the higher the percentile the stronger the association
Stage in trade chain on arrival at Airport or harbour in Transport to wholesale at wholesale and storage in Transport to processor at Processor in Transport to retail at Retail in Transport to consumer at Consumer Total cases
www.efsa.europa.eu/publications
Trade chain 1 Or. Ap. Pl.
Trade chain 2 Or. Ap. Pl.
Trade chain 3 Or. Ap. Pl. 76 68
76
76
85 1
87 1
81 2
80 3
169
69
73
71 68
71
78 86 1
78
67 85 2
3
70 70 3
4
Trade chain 4 Total Or. Ap. Pl. cases 0 79 80 70 6 1 3 69 2 81 75 4 68 74 74 3 75 4 0 69 70 9 4 3 5
EFSA Supporting publication 2016:EN-1062
The present document has been produced and adopted by the bodies identified above as authors. This task has been carried out exclusively by the authors in the context of a contract between the European Food Safety Authority and the authors, awarded following a tender procedure. The present document is published complying with the transparency principle to which the Authority is subject. It may not be considered as an output adopted by the Authority. The European Food Safety Authority reserves its rights, view and position as regards the issues addressed and the conclusions reached in the present document, without prejudice to the rights of the authors.
Quantitative Pathway Analysis QPAFood
The wheat model was more complex reflecting the uses of this imported commodity. The wheat model has the potential to be employed for other similar risk analysis objectives relating to grain pests. In this model, eight possible routes for trade chains were identified associated with the use of wheat grain imports to EU Member States:
Trade chain 1 (Port to Mill, grain feed to Farm to Livestock)
Trade chain 2 (Port to Mill; grain plus by-product to Feed manufacturer)
Trade chain 3 (Port to Storage to Mill, grain feed to Farm to Livestock)
Trade chain 4 (Port to Storage to Mill, grain plus by-product to Feed manufacturer)
Trade chain 5 (Port to Mill, flour and grain products to Food Processor)
Trade chain 6 (Port to Storage to Mill, flour and grain products to Food processor)
Trade chain 7 (Port to Mill, flour products to Retail to Consumer)
Trade chain 8 (Port to Storage to Mill, flour products to Retail to Consumer)
Analysis of the model revealed differences in the pest risk implications of the eight trade chains. Trade chain durations clustered into two groups depending upon whether a storage stage was present in the chain. When no storage stage was present the distribution of trade chain durations was from 16 and 65 days, with an associated risk period of about three to five weeks, depending on the specific chain (Table 4.6.12). When a storage stage was present the duration was between 44 and 167 days with an associated risk period of about 3.5 to 4 months. Due to their inherent features, some chains were more likely to result in pest release than others and Trade chain 1 and to a lesser extent Trade chain 3 were the most inherently risky chains, being associated with the feeding of whole grain feed to livestock. The lower risk associated with Trade chain 3 was due to pest mortality during the period of storage prior to feeding (Table 4.6.12). By identifying the values of the various inputs in those simulations which result in high (long duration) values, it is possible to identify those inputs which are most influential in causing long duration situations. In Table 4.6.12, the influential inputs for the wheat model are compared for each trade chain. For those trade chains which involved a period of storage, there was a dominant influence of the period spent in wholesale or storage because this was much longer than any of the other stages. For the non-storage trade chains the period at the mill was a key influence in three of the four chains. Other key influences were related to the specific of particular chains. The colour-shaded cells in Table 4.6.13 show the row and column frequencies of the influential inputs. Over all the trade chains, the best way to speed up the movement of commodity, and thereby reduce the period of pest exposure would, in order of importance, be to reduce time spent at the wholesaler/storage and at the mill. However, if we consider that Trade chains 1 and 3 had consistently higher inherent risk, then at farm storage is also a critical step.
www.efsa.europa.eu/publications
170
EFSA Supporting publication 2016:EN-1062
The present document has been produced and adopted by the bodies identified above as authors. This task has been carried out exclusively by the authors in the context of a contract between the European Food Safety Authority and the authors, awarded following a tender procedure. The present document is published complying with the transparency principle to which the Authority is subject. It may not be considered as an output adopted by the Authority. The European Food Safety Authority reserves its rights, view and position as regards the issues addressed and the conclusions reached in the present document, without prejudice to the rights of the authors.
Quantitative Pathway Analysis QPAFood
Table. 4.6.12: Comparison of trade chain durations (days from arrival) in the wheat model as parameterised, showing the start and ends times of the bulk of the distribution (from the 5 th to 95th percentiles) and the period between them, and comparison of the relative pest risk potential associated with each trade chain, per unit commodity on the trade chain
5th 95th Trade percent percent Interval chain ile ile 1 16.9 51.2 34.3 2 18.2 38.7 20.5 3 46.3 162.6 116.3 4 43.7 150.9 107.2 5 17.6 39.6 22.0 6 41.8 163.5 121.7 7 25.9 65.0 39.1 8 57.5 176.0 118.5
Trade chain 1 2 3 4 5 6 7 8
Relative risk potential 56% 4% 15% 5% 4% 5% 4% 5%
Table 4.6.13: Comparison of the three fruit models, orange (Or.), apple (Ap.) and plum (Pl.) showing at which points in the trade chains the key inputs associated with long trade chain durations occur. The input percentiles are shown for each key input; this shows the strength of the association with high (above 75th percentile) output values; the higher the percentile the stronger the association
Stage in trade chain
1
on arrival at Airport or harbour in Transport to wholesale at wholesale and storage in Transport to mill at Mill in Transport to feed manufacturer at Feed manufacturer in Transport to farm at Farm storage 87 in Transport to livestock at Livestock in Transport to food processor at Food processor in Transport to retailer at Retailer in Transport to consumer at Consumer Total cases 1
www.efsa.europa.eu/publications
2
3
87
Trade chain 4 5 6
87
83
87 82
75
72
2
1
1
171
2
1
Total cases 0 0 0 87 4 0 77 3 0 1 0 1 0 0 0 1 0 67 1 0 85 1 3 1 7
8
EFSA Supporting publication 2016:EN-1062
The present document has been produced and adopted by the bodies identified above as authors. This task has been carried out exclusively by the authors in the context of a contract between the European Food Safety Authority and the authors, awarded following a tender procedure. The present document is published complying with the transparency principle to which the Authority is subject. It may not be considered as an output adopted by the Authority. The European Food Safety Authority reserves its rights, view and position as regards the issues addressed and the conclusions reached in the present document, without prejudice to the rights of the authors.
Quantitative Pathway Analysis QPAFood
5.
Research Needs
Infestation levels of imports, especially differences between source countries and in relation to the time of year when the exports occur is an important driver in all the models. Sensitivity analysis showed examples of how risk patterns change when different source countries exhibit differing infestation rates. The issue is not just the infestation rate expressed as a percentage of commodity units but the numbers of pests per unit volume of commodity. Because the levels of infestation are extremely low in most cases, it is unlikely to be possible in most circumstances to obtain good estimates from interception records. Indeed for three of the case studies in the project, no interception records were available. Information was available about the proportions of the commodities going to different uses and this is given in detail in the Appendices 1-4. It was possible to obtain general figures in most case as well as a few country-specific estimates. The main division is between processing uses and retail uses and further research could help to establish more accurately differences between Member States and differences related whether fruit is locally produced or imported. Research to obtain more country-specific estimates would improve the partitioning of risk spatially within Member States because distributions associated with retail and processing uses differ. Similar issues apply to the different uses of grains for milling, animal feed and other uses. The location of processing activity within Member States also has an important impact. The spatial scale of the model was the NUTS2 region and with the exception of orange processing in Spain, where commodity specific data were available, the location of commodity processors for all the fruit commodities was based on the numbers of general vegetable and fruit processors in each NUTS2 region. The pattern of processing of specific fruit commodities is expected to have commodity specific variation within this general pattern of processing enterprise distribution. Research to find out the distributions of processing with respect to specific fruit of interest would increase the accuracy of the within-country distribution of risk associated with processing uses. Estimates of pest survival were relatively easy to obtain but the data did not always reflect the conditions pertaining to the commodity or its handling and processing. In many cases the processes to which fruit are subjected are certain to cause mortality. There are however some processes which allow some level of pest survival. Better understanding is required of pest survival in such cases where some survival is possible. The models consider potential contact through the coincidence of the destinations of infested commodity and the locations of hosts of the pest and a suitable time of year and host growth stage. The capacity of the pest to transfer in such circumstances was inferred from its general dispersal ability in relation to the probability of host encounter. This final transfer stage of pest entry is critical and very uncertain. Particularly in relation to the assessment of time scales of risk using the consignment models, further research to determine more accurately the periods of the various stages of the trade chains would help to reduce the variability expressed in the results. Little information was available, but as a general principle it is known that the industry tries to move a commodity through the chain as quickly as practicable. Such research would require more practical work in collaboration with industry to establish the detailed timescales of the various commodity pathways. As a general issue, estimates of means or modes of parameters could often be estimated with reasonable confidence but variability was largely unreported. Lack of information about variance does not in general affect the rank in the assessment of relative risk because this depends on the means, or ranking of means. However, the degree to which outcomes overlap is dependent on knowledge of variance and this is important if a more detailed understanding of the pattern of risk is required, e.g. how likely is the risk to exceed a certain threshold. It would be useful to carry out further work to classify in detail which management responses to risk rely on a relative estimate of risk or risk ranking, which on an absolute measure of mean risk as a true probability, and which rely on variability in risk.
www.efsa.europa.eu/publications
172
EFSA Supporting publication 2016:EN-1062
The present document has been produced and adopted by the bodies identified above as authors. This task has been carried out exclusively by the authors in the context of a contract between the European Food Safety Authority and the authors, awarded following a tender procedure. The present document is published complying with the transparency principle to which the Authority is subject. It may not be considered as an output adopted by the Authority. The European Food Safety Authority reserves its rights, view and position as regards the issues addressed and the conclusions reached in the present document, without prejudice to the rights of the authors.
Quantitative Pathway Analysis QPAFood
6.
Conclusions
6.1.
Potential to build quantitative pathway models
The focus of the work in QPAFood was on three fruit commodities and one grain commodity, each with a selected pest which posed an import risk to the European Union. For this series of four case studies, two types of quantitative pathway model have been developed: general and consignment. Both allow analysis of aspects of risk associated with the entry of alien pest species to Member States of the European Union. The general models focus on the geographical distribution of pest entry across the EU and the consignment models focus on the timing of events along the commodity trade chains that may lead to entry. The models make use of diverse information available about commodity trade, production and use, and about pest infestation of imports, host needs, dispersal and pest biology. The detail and accuracy with which quantitative estimates could be made varied widely in the different parts of the models. Each of the models has potential to describe a range of pathway routes, but are specified for only one pest organism at a time. Despite the limitation imposed by lack of or poor quantitative information, the models have led to new insights in a way that is not possible through the use of qualitative models which employ ordinal linguistically-defined ratings to describe risk.
6.1.1.
Data limitations that limit quantification
The models have been prepared in as generic a way as possible. This has the advantage of producing a consistent form of analysis with comparable interpretation across cases. However, it means that the models are relatively large and contain streams of calculation that are redundant for specific pathways. The models have been constructed so that only data relevant to specific pathways need to be entered. Trade data are available on a monthly basis for major food commodities, but data on minor commodities are generally aggregated. Furthermore, within the generality of a commodity trade there may be highly specific trade networks that are atypical of the overall trade pattern, for instance for commodities of interest to particular communities or for consumption at a specific season. Domestic production data is generally only available on an annual basis. Infestation data is generally not available, and interception data is variable depending on effort and reporting. Estimates of potential distributions of infestation within commercial quality specifications give some quantification of pest infestation proportion, but not pest numbers. Use streams are variable according to market demands and opportunities. Retail consumption can be broadly estimated based on human populations within regions, and livestock feed use can be based on livestock numbers, but this assumes consumption patterns are similar across regions. The presence of businesses involved in processing fruit and vegetables is recorded on a regional basis, but is not specified according to type of product or type of processing; also some processing is carried out by mobile processing units mounted on lorries, so that they can move seasonally. The seasonality of processing activities is not recorded or available centrally. Domestic production and area data for crops is available, but non-crop host area and availability are not as readily available. Biological information on natural dispersal is often available, but there is no clear evidence on the number of dispersal kernels to expect. The model was built using @RISK in order to incorporate the different forms of uncertainty directly in the calculations. Incorporating variance in parameter values led to outcomes in which the distribution of risk was typically strongly skewed to a high probability of low risk but with a long tail indicating a small probability of higher risks. Throughout the work, it proved very difficult to estimate parameter variance, as typically, the information that was obtainable to estimate parameters was based on a single value. Whilst the variance of outcomes provided an extra dimension to the perception of risk, the overall patterns of risk between uses and regions are unaffected by this variance. It is often the primary statistics (means) rather than the secondary statistics (variance) that are most needed in order to make decisions to improve risk management, e.g. allocation of resources at locations and times of (average) high risk. Apart from the poor estimates of variance, the general models also have a very large number of parameters, and together this made analysis of the most important sources of variance intractable. The simpler representation of the consignment models did allow identification of steps in the trade chain where value uncertainty was most influential on the final result. This was described in the sensitivity analysis. www.efsa.europa.eu/publications
173
EFSA Supporting publication 2016:EN-1062
The present document has been produced and adopted by the bodies identified above as authors. This task has been carried out exclusively by the authors in the context of a contract between the European Food Safety Authority and the authors, awarded following a tender procedure. The present document is published complying with the transparency principle to which the Authority is subject. It may not be considered as an output adopted by the Authority. The European Food Safety Authority reserves its rights, view and position as regards the issues addressed and the conclusions reached in the present document, without prejudice to the rights of the authors.
Quantitative Pathway Analysis QPAFood
6.1.2.
Intrinsic limitations to quantification
Trade volume is a key driver for potential distribution of exotic pest organisms. The data demonstrates substantial variability in trade patterns between and within years. Pest risks associated with new trade are particularly difficult to assess, as there is no history of volumes or distribution routes on which to base estimates. New trade also has no history of interceptions that might inform pest infestation estimates. The models can be used with projected volumes and routes, but trade patterns are difficult to predict with accuracy. Trade in fruit commodities is based on markets that generally have a high commercial quality standard with rapid transportation and handling to get them to consumers in good condition with minimal waste. This implicitly means that quantitative estimates of distributions are highly skewed to low presence of infestation and are difficult to validate through practical inspection regimes. The analysis in these models has demonstrated the importance of scale in both time and space. The risk at an annual and national level can be very different from specific monthly risks at a regional level. It is likely that risks may also be different if they could be modelled at weekly and local levels. Probabilistic distributions are made up of sets of very specific events determined by their immediate circumstances, which may be different from the average conditions. Quantitative pathway analysis may serve a useful purpose in highlighting the conditions under which risks are greatest, so that appropriate action can be taken. Relative and subjective values may be sufficient to focus management in many cases, even where absolute data are limited. In many cases the very low levels of pest infestation in imported commodities make detection very unlikely with any practicable phytosanitary procedures so there is no direct basis to calculate infestation rate in the imported commodity. In the QPAFood project inferences were made using any information about infestation at the place of production and assumptions about survival in transit. In the sensitivity analysis it was shown that differences in infestation between source countries can cause large differences in the risk profile across Member States, due to differences in both the infestations and trade patterns. Another aspect of the pest on the pathway which defies measurement is the release and movement of the pest from the commodity and its waste. Estimates of whether any pests present are likely to survive in the commodity or its waste to potential release points is possible but in most cases there is unlikely to be any basis to estimate the probability of whether a surviving pest actually establishes on a host in the country in which it arrives. Even if a pest organism has been found on hosts in a destination country, these events are too few to establish any relationship between these and pest transfer probability.
6.1.3.
Value of quantitative models in pathway analysis
The general models proceed as a sequence of steps with outputs available at different stages. The initial part deals with the distribution of pest infestations through trade and the dilution effects of local production. Accurate and detailed data on import volumes and domestic production are available so it is possible to make good quantitative predictions with respect to trade volumes entering and moving between Member States. The infestation levels of the imports were much more uncertain, not only in the infestation rate or proportion of commodity units infested but more particularly in the pest load associated with an infestation. So, it is difficult to be certain about the proportion of a commodity infested, and even more uncertain how many units of a pest are present as potential propagules of new infestation. This must be regarded as one of the key limits of an absolute quantification of the pest load arriving in each Member State. However, knowledge of the relative pest load, based on trade volume, arriving in each Member State and region is valuable in helping to set priorities on management.
6.2.
Level of detail in models
The general QPAFood models cover aggregate commodity movements on a monthly timescale from export sources at national level to destinations at EU NUTS2 level. All retail use is aggregated, but major processing use streams are segregated. The consignment QPAFood models cover individual consignments through separate defined use streams on a daily timescale. The inputs within use streams are based on relatively generic information about the www.efsa.europa.eu/publications
174
EFSA Supporting publication 2016:EN-1062
The present document has been produced and adopted by the bodies identified above as authors. This task has been carried out exclusively by the authors in the context of a contract between the European Food Safety Authority and the authors, awarded following a tender procedure. The present document is published complying with the transparency principle to which the Authority is subject. It may not be considered as an output adopted by the Authority. The European Food Safety Authority reserves its rights, view and position as regards the issues addressed and the conclusions reached in the present document, without prejudice to the rights of the authors.
Quantitative Pathway Analysis QPAFood
commodity, the pests and the process. However, very specific parameter values could be available for particular consignments if there is historical data on a particular pathway.
6.2.1.
Problems in high detail
More detailed models require greater parameterisation effort, but if the estimates are highly variable the added effort of detailed parameterisation may not yield a result that is immediately useful. Sensitivity analysis can indicate which parameters are of highest importance. However, it can never be possible to address pest risks across a large area and time period in a way that includes local or short-term incidents of risk-causing behaviour or conditions. A high level of detail necessarily implies a very large numbers of parameters. This can lead to practical difficulties of estimating all the parameters in order to apply the models to a given case. A high level of detail can also lead to wasted effort as there is a tendency to include precision where it is available but use general estimates where it is not. This leads to unbalanced models with very accurate information in some parts and very weak information in others. The inclusion of uncertainty values at least helps to indicate where such imbalances occur.
6.2.2.
Benefits in high detail
Analysis indicates that risks based on data aggregated in space and time differ considerably from more specific cases, and outputs are more uncertain in aggregation. The QPAFood models can provide much disaggregated temporal and geographical information about the nature and pattern of the pest risk. The models can also use detailed Eurostat data to maximum effect.
6.2.3.
Approach to parameterisation which allows variable detail
Considerable effort has been made in the QPAFood project to reach a level of detail that is practically and generally available for the parameters in the models, and to demonstrate outputs of the models based on such data. The models are intended to be general models and so they have been designed with data limitations in mind. Distributions, with more or less uncertainty, are used throughout in the expectation that at least ranges and likely values can be estimated, so the models can operate with limited data in parts, but at the cost of greater uncertainty in output values. The model parameter entry tables are provided in such a way that maximum detail can be included if available, for example the proportions of fruit being used for processing by individual Member States. If, however an indicative proportion is used for the EU as a whole, this value is simply copied across the range of input cells.
6.3. 6.3.1.
Generality in the models A general fruit model and a general grain model
The three fruit models share a common structure and the experience with the model indicates that this is suitably generic for fresh fruits. The grain model is also intended to be general and includes livestock feed and milling uses that would be common to many grains other than wheat. The fruit pathways had sufficient similarity that a single general fruit model could be developed. This has the advantage that the models can be applied to other fruit pest cases. There are differences, for example where the peel forms a separate waste stream. These differences are accommodated by parameterisation, so for example plum has no separate waste stream of peel whereas orange does. Only one grain-related model was developed, for wheat, but the model was built with flexibility of application in mind and the objective is that the wheat model could be applied to other grains by appropriate parameterisation. Wheat use is diverse and complicated and for some other grains, this will be less so. Particular pathways that are not relevant in other grains can be given 0% for that use type, which effectively switches off unused branches of the pathway. www.efsa.europa.eu/publications
175
EFSA Supporting publication 2016:EN-1062
The present document has been produced and adopted by the bodies identified above as authors. This task has been carried out exclusively by the authors in the context of a contract between the European Food Safety Authority and the authors, awarded following a tender procedure. The present document is published complying with the transparency principle to which the Authority is subject. It may not be considered as an output adopted by the Authority. The European Food Safety Authority reserves its rights, view and position as regards the issues addressed and the conclusions reached in the present document, without prejudice to the rights of the authors.
Quantitative Pathway Analysis QPAFood
6.3.2.
Provision of a tool for other pests and commodities
The QPAFood models can be parameterised for a wide range of pest organisms. However, they have not been designed with anticipation of long lag times for pest activity, so this could require adaptation if that is a factor for specific pests. Risk assessments will be more certain for pests with narrow, commercial crop host ranges than for generalist pests, because the structure only allows a single or aggregated host area and phenology in each case. The models use both data tables and parameters which are specific to the pest and commodity concerned. The data tables for trade and production are specific to the commodity. The data tables for human population (determining retail distribution), livestock distribution (determining feed distribution) and, processing enterprise distribution are expected to be common to different commodities. The models are provided with a consistent clear approach to parameterisation so despite the potentially large number of parameters, parameter entry requirements are restricted to certain clearly labelled sheets and within those sheets in clearly labelled cells. The application of the models to other commodities and pests requires some work to assemble parameter estimates but is intended to be achievable by the general user who has an understanding of pest risk analysis.
6.4.
Features of the tools provided
Models of pathway entry can be very complex and QPAFood illustrates this complexity. An important feature of the QPAFood approach has been modularity and an interface that allows users to focus on each parameter or step in the pathway, while still seeing the wider context. It is expected that the models would be used in assessing risk scenarios, as well as making assessments on available data. The models are versatile in this respect, so that user inputs can be adapted for many different scenarios. The model structure is also intended to facilitate the creation of scenarios because the step by step approach provides a scenario outline. The modelling tools are provided as systematically constructed spreadsheets which are clearly labelled and documented. The general model, which is more complicated, is provided with an interactive main page which allows navigation to all part of the models by the use of macro-buttons on the screens. The model calculations are available to view at all stages and the key results are also conveyed using graphical tools. The general model is provided in two modules which can be configured independently, so for example a series of trade or pest infestation scenarios represented in different realisations of Module 1 can easily be linked to the same distribution, use and host contact model in Module 2.
6.4.1.
Insights from the case studies
Well-established trade in major commodities are relatively easy to assess with the QPAFood models. New trade requires assessment based on trade scenarios. Well-studied pests with narrow host ranges are more straightforward to assess within the models. High volume trade to regions where consumption occurs in close proximity to host crops at susceptible stages poses the greatest pest risk, in principle. Spatial and temporal management of distribution chains could greatly reduce risks without additional direct treatment of commodities. The evidence of pest risk used as a basis for proposing any controls on trade chains needs to be considered at appropriate scales that reflect the scale of potential management units in the trade chains. While the QPAFood models have been built to NUTS2 regional and monthly scales these may not reflect the organisation and adaptability of food supply chains, which may be organised on larger spatial scales and very variable temporal scales. The patterns of risk associated with the four case study pests and their commodity hosts yielded some interesting and potentially useful results for the understanding and management of the risk posed by alien species carried by fresh food trade. Two of the fruit case studies, apple and plum, showed a risk pattern in which risk was very concentrated on a specific Member State. For the orange and wheat case studies the risk was spread more widely over Member States. Within Member States the risk was very concentrated in certain NUTS2 regions but for the apple case study the risk was more widely spread within the high risk
www.efsa.europa.eu/publications
176
EFSA Supporting publication 2016:EN-1062
The present document has been produced and adopted by the bodies identified above as authors. This task has been carried out exclusively by the authors in the context of a contract between the European Food Safety Authority and the authors, awarded following a tender procedure. The present document is published complying with the transparency principle to which the Authority is subject. It may not be considered as an output adopted by the Authority. The European Food Safety Authority reserves its rights, view and position as regards the issues addressed and the conclusions reached in the present document, without prejudice to the rights of the authors.
Quantitative Pathway Analysis QPAFood
country. It was very clear that the patterns of risk between and within Member States was very different primarily due to trade pattern, host distribution and commodity distribution influenced by use. A particular issue which came to light was the effect of geographical scale on risk perception. Those countries which had overall the highest risk, did not necessarily contain the NUTS2 regions which individually suffered the highest risk. This was in part due to the number of NUTS2 regions within a country, so that for example in Germany, which has 38 NUTS2 regions, the commodity arriving in the country has the potential to be divided over many sub-regions. In contrast Lithuania has only one NUTS2 region, so all the commodity arriving in Lithuania goes to that one NUTS2 region. Additionally, for a given area of host crop, large countries on average have proportionately less host crop in each NUTS2 region.
6.4.2.
Insights of wider importance
The QPAFood models reinforce the importance of trade volume as a primary driver of pest risk. However, they demonstrate that specific use-streams and details of immediate dispersal of pest organisms are critical to the risk in particular regions and months. The spatial and temporal scale of the assessment is important in the interpretation of risk outputs. Some but not all the results obtained for the case studies were as might have been expected, for example a high risk associated with the orange pest case study in high production areas like Andalucía and Murcia, but some were more of a surprise. The models are new in providing a very detailed description of the pattern of risk across and within EU Member States and regions. Some of the locations revealed as high risk could not have otherwise been predicted, for instance apples in East Anglia. Also the ranking of risk and the degree of equivalence in risk between particular sub-regions could not have been predicted without such an analysis. It is expected that corresponding insights would be provided in the use of the models for other commodities and pests.
6.4.3.
Potential contribution to risk management and plant health
The general QPAFood models give an indication of the distribution of risks from specific pests on a monthly basis across EU NUTS2 regions. This allows priority setting for inspection, surveillance and other management for specific pathways. The model also allows comparison of risks from different source countries and months for specific pest-commodity sets. Management practices that affect values of parameters in the models can be tested to determine their relative impact on risk reduction, in time and space. Conversely, changes in practices that may increase risk can also be analysed through modelling scenario values. The modular structure of QPAFood is particularly well-suited to analysing specific scenario components. Because transhipments within the EU are a part of the model, QPAFood can also be used as a tool to predict trade-assisted spread of new pests within the EU territory. The QPAFood models can also be used as part of forensic investigations to determine how outbreaks may have arisen. If for example, an outbreak is suspected of originating in a particular country outside the EU or in a particular Member State, scenarios can be simulated to compare the expected risk distribution with the known occurrence of secondary outbreaks, or with trade patterns at the time of the likely introduction.
www.efsa.europa.eu/publications
177
EFSA Supporting publication 2016:EN-1062
The present document has been produced and adopted by the bodies identified above as authors. This task has been carried out exclusively by the authors in the context of a contract between the European Food Safety Authority and the authors, awarded following a tender procedure. The present document is published complying with the transparency principle to which the Authority is subject. It may not be considered as an output adopted by the Authority. The European Food Safety Authority reserves its rights, view and position as regards the issues addressed and the conclusions reached in the present document, without prejudice to the rights of the authors.
Quantitative Pathway Analysis QPAFood
References Agnello, A., Nyrop, J., Reissig, H. & Straub, R., (2002) Reduced-risk pest management in apples using pheromone disruption and a selective pesticide program. USDA RAMP PROJECT - New York 2002 http://web.entomology.cornell.edu/agnello/assets/RAMP_2002_NY_Full_Report.pdf Agnello, A., Nyrop, J., Reissig, H. & Straub, R., (2003) Reduced-risk pest management in apples using pheromone disruption and a selective pesticide program. USDA RAMP PROJECT - New York 2003 http://web.entomology.cornell.edu/agnello/assets/RAMP_2003_NY_Full_Report.pdf Agnello, A., Nyrop, J., Reissig, H. & Straub, R., (2004) Reduced-risk pest management in apples using pheromone disruption and a selective pesticide program. USDA RAMP PROJECT - New York 2004 http://web.entomology.cornell.edu/agnello/assets/RAMP_2004_NY_Full_Report.pdf Agnello, A., Nyrop, J., Reissig, H. & Straub, R., (2005) Reduced-risk pest management in apples using pheromone disruption and a selective pesticide program. USDA RAMP PROJECT - New York 2005 http://web.entomology.cornell.edu/agnello/assets/RAMP_2005_NY_Full_Report.pdf Agriculture and Agri-Food Canada (2011) Statistical Overview of Canadian Horticulture 2009-2010 http://www.agr.gc.ca/eng/industry-markets-and-trade/statistics-and-market-information/by-productsector/horticulture/horticulture-canadian-industry/sector-reports/statistical-overview-ofcanadian-horticulture-2009-2010-1-of-8/statistical-overview-of-canadian-horticulture-2009-2010-5-of8/?id=1319484763399#tab44 (Tables 41b, 42b, 43b & 44b) Agriculture and Agri-Food Canada (2012) Statistical Overview of the Canadian Fruit Industry – 2011. Market Analysis and Information Section, Horticulture and Cross Sectoral Division. http://publications.gc.ca/collections/collection_2012/agr/A71-33-2011-eng.pdf Agrosynergie, 2006. Evaluation of measures on citrus fruit. 5pp. http://ec.europa.eu/agriculture/eval/ reports/agrumes/sum_en.pdf Ahmad, S.R., Gokulakrishnan, P., Giriprasad, R. & Yatoo, M.A. (2013) Fruit Based Natural Antioxidants in Meat and Meat Products: A Review. Critical Reviews in Food Science & Nutrition, 53. DOI: 10.1080/10408398.2012.701674 Anon (2001) The Food Processing Residual Management Manual. http://www.elibrary.dep.state.pa.us/dsweb/View/Collection-8342 Chapter 13: Fruit case studies. http://www.elibrary.dep.state.pa.us/dsweb/Get/Version-48902/254-5400-100%20Chapter%2013.pdf Anon. (2000) Council Directive 2000/29/EC of 8 May 2000 on protective measures against the introduction into the Community of organisms harmful to plants or plant products and against their spread within the Community. Official Journal of the European Communities 43 no. L 169 pp 1 - 112. Anon. (2006) Fresh fruit and vegetables. Factsheet describing shipping and transport conditions for fresh fruit and vegetables. http://www.ukpandi.com/fileadmin/uploads/uk-pi/LP%20Documents/ Carefully_to_Carry/Fresh%20fruit%20and%20vegetables.pdf Anon. (2007) Controlled Atmosphere Storage (CA). Washington State Apple Advertising Commission. http://web.archive.org/web/20080311010006/http://www.bestapples.com/facts/facts_controlled.shtml Anon. (2011) COMMISSION IMPLEMENTING REGULATION (EU) No 543/2011 of 7 June 2011 Laying down detailed rules for the application of Council Regulation (EC) No 1234/2007 in respect of the fruit and vegetables and processed fruit and vegetables sectors. Consolidated Text: Annex I; Part 1 of Part B Marketing Standard for Apples. https://www.gov.uk/government/uploads/system/ uploads/attachment_data/file/299240/Apples.pdf Anon. (2013) Fruit Juice Supply Chain Analysis – Europe. EU Fruit Juice CSR Platform. http://juicecsr.eu/wpcontent/uploads/2013/09/CSR_Platform_Fruit_supply_research.pdf
www.efsa.europa.eu/publications
178
EFSA Supporting publication 2016:EN-1062
The present document has been produced and adopted by the bodies identified above as authors. This task has been carried out exclusively by the authors in the context of a contract between the European Food Safety Authority and the authors, awarded following a tender procedure. The present document is published complying with the transparency principle to which the Authority is subject. It may not be considered as an output adopted by the Authority. The European Food Safety Authority reserves its rights, view and position as regards the issues addressed and the conclusions reached in the present document, without prejudice to the rights of the authors.
Quantitative Pathway Analysis QPAFood
Armstrong T. (1958) Life-history and ecology of the plum curculio, Conotrachelus nenuphar (Hbst.) (Coleoptera: Curculionidae), in the Niagara Peninsula, Ontario. Canadian Entomologist, 90:8-17. Arroyo, F.T., Jiménez-Bocanegra, J.A., García-Galavís, P.A., Santamaría, C., Camacho, M., Castejón, M., PérezRomero, L.F. & Daza, A (2013) Comparative tree growth, phenology and fruit yield of several Japanese plum cultivars in two newly established orchards, organic and conventionally managed. Spanish Journal of Agricultural Research 11:155-163. . http://revistas.inia.es/index.php/sjar/article/view/3282/1791 Bai, B.B., Schwarz, K., Puls, K. & O'Neil, J. (2000) Flight Phenology of Oriental Fruit Moth and Lesser Apple Worm in the Willamette Valley, Oregon. Proceedings of the 74th Annual Western Orchard Pest and Disease Management Conference 5-7 January 2000, Imperial Hotel, Portland, OR. WOPDMC, 74:73-74. 2000. http://entomology.tfrec.wsu.edu/wopdmc/2000PDF/6-BIOLOGY/Biology%2000-5.pdf Balestra, G. M., Sechler, A, Schuenzel, E., Schaad, N. W. 2008. First report of citrus canker caused by Xanthomonas citri in Somalia. Plant Disease 92(6): p. 981. Barcenas, N.M., Unruh, T.B. & Neven, L.G. (2005) DNA diagnostics to identify internal feeders (Lepidoptera: Tortricidae) of pome fruits of quarantine importance. Journal of Economic Entomology 98:299-306 Barker, G.M., 1988. Effect of temperature on development and survival of Argentine stem weevil (Listronotus bonariensis) immature stages. New Zealand Journal of Zoology 15, 287-390. Barker, G.M.; Pottinger, R.P.; Addison, P.J. 1989. Flight behavior of Listronotus bonariensis (Coleoptera: Curculionidae) in the Waikato, New Zealand Environmental Entomology 18 (6), 996-1005. Barta, J., Patkai, G.Y., Gion, B. & Kormendy, I. (1997) Presentation of an alternative, waste-free processing technology illustratedby the example of inulin containing crops. Acta Alimentaria, 26:88-89. Bates, R.P., Morris, J.R. & Crandall, P.G. (2001) Principles and practices of small- and medium-scale fruit juice processing. Chapter 13 Tree Fruit: Apple, Pear, Peach, Apricot and Plums. FAO Agricultural Services Bulletin 146. http://www.fao.org/docrep/005/y2515e/y2515e15.htm Belasque, J. Jr., Rodrigues-Neto, J, 2000. Survival of the citrus canker bacterium in non-infected orange fruits. Summa Phytopathologica, 26: p. 128. Ben Mimoun, M. & DEJONG, T. M. (1999). Using the relation between growing degree hours and harvest date to estimate run-times for PEACH: a tree growth and yield simulation model. Acta Horticulturae, 499, 107–114. Bennett, B. (2002) Feeding Crop Waste to Livestock and the risk of chemical residues.Information Notes Series. Department of Primary Industries, Vicoria, Australia. Bernal-Vicente A, Ros M, Tittarelli F, Intrigliolo F and Pascual JA, 2008. Citrus compost and its water extract for cultivation of melon plants in greenhouse nurseries. Evaluation of nutriactive and biocontrol effects. Bioresource Technology, 99, 8722-8728. Bettini, 2014. EU-28 Citrus Annual Report. Gain Report No. SP14114. USDA Global Agricultural Information Network. 12/2/2014 Bhutani, V.P. & Joshi, V.K. (1995) Plum. p203 - 241, In: Salunkhe, D.K. & Kadam, S.S. (Eds) (1995) Handbook of fruit science and technology: production, composition, storage and processing. Marcel Dekker Inc. New York. https://books.google.co.uk/books?isbn=0824796438 Bishop, A.L., Powell, K.S., Gibson, T.S., Barchia, I.M. & Wong, P.T.W. (2002) Mortality of grape phylloxera in composting organics. Australian Journal of Grape and Wine Research 8:48-55. BizEe Degree Days 2015. BizEE Software limited. Degree Days.net – Custom Degree Day Data. Accessed 19/03/2015. Blasse W. & Hofmann S. (1993) Phänologische Untersuchungen an Sorten von Pflaume, Pfirsich und Aprikose. Erwerbsobstbau, 35(2):36-39. www.efsa.europa.eu/publications
179
EFSA Supporting publication 2016:EN-1062
The present document has been produced and adopted by the bodies identified above as authors. This task has been carried out exclusively by the authors in the context of a contract between the European Food Safety Authority and the authors, awarded following a tender procedure. The present document is published complying with the transparency principle to which the Authority is subject. It may not be considered as an output adopted by the Authority. The European Food Safety Authority reserves its rights, view and position as regards the issues addressed and the conclusions reached in the present document, without prejudice to the rights of the authors.
Quantitative Pathway Analysis QPAFood
Bousquet, Y. (1991) Checklist of Beetles of Canada and Alaska Research Branch, Agriculutre Canada. Publication 1861/E., Ottawa. 430pp Brandt, R.C. & Martin, K.S. (1994) Food Processing Residual Management Manual. Pennsylvania Department of Environmental Protection. http://www.elibrary.dep.state.pa.us/dsweb/ Get/Document-48928/01%20Table%20of%20Contents.pdf Flow diagrams (Fig 5, 6 & 7) = http://www.elibrary.dep.state.pa.us/dsweb/GetRendition/Document48902/html#bmk1 British Colombia MAFF (2004) An overview of British Colombia’s Peach, Nectarine, Apricot, Plum and Prune Industries. http://www.agf.gov.bc.ca/treefrt/profile/stonefrt.pdf Brown G. E. and Schubert T. S., 1987. Use of Xanthomonas campestris pv. vesicatoria to evaluate surface disinfectants for canker quarantine treatment of citrus fruit. Plant Disease, 71: 319–323. Butac et al. (2011) Overview of plum breeding in Europe. Presentation made at 2nd Balkans Symposium on Fruit Growing, Romania. Many pictures of plum varieties. http://bsfg2011.icdp.ro/materiale/somepresentations/04Overview%20of%20Plum%20Breeding%20in%2 0Europe.pdf CABI (2014) Prunus domestica (plum) datasheet. Last updated 14th March 2014. CABI Crop Protection Compendium, http://www.cabi.org/cpc/datasheet/44278 CABI CPC (2013) CABI Crop Protection Compendium, Malus domestica datasheet. Last updated 20 June 2013. http://www.cabi.org/cpc/datasheet/31964/aqb CABI CPC. (2012) CABI Crop Protection Compendium, Grapholita prunivora datasheet. Last updated 04 Sept 2012. http://www.cabi.org/isc/datasheet/29907 CABI/EPPO, 2006. Xanthomonas axonopodis pv. citri. Distribution Maps of Plant Diseases, No. 11. Wallingford, UK: CAB International. Campbell, J.M., Sarazin, M.J. & Lyons, D.B. (1989) Canadian beetles injurious to crops, ornamentals, stored products and buildings. Research Branch Agriculture Canada, Publication 1826. Canteros, B.I. 2004. Management of citrus canker in Argentina. A review. In Proceedings of the Tenth International Society of Citriculture Congress, Agadir, Morocco, 15–20 February 2004 (Eds A. AitOubahou, M. El-Otmani) Vol. 1, pp. 448–451. CargoHandling.com (2014) Plums. http://www.cargohandbook.com/index.php/Plums Chauinard, G., Hill, S.B. & Vincent, C. (1993) Spring behaviour of the plum curculio (Coleoptera: Curculionidae) within caged dwarf apple trees. Annals of the Entomological Society of America , 86, 333340. Chen, H., Kaufmann, C. & Scherm, H. (2006) Laboratory Evaluation of Flight Performance of the Plum Curculio (Coleoptera: Curculionidae) Journal of Economic Entomology, 99 (6), 2065-2071. DOI: 10.1603/0022-0493-99.6.2065 Childers, N.F., Morris, J.R. & Sibbett, G.S. (1995) Modern Fruit Science: Orchard and Small Fruit Culture. Horticultural Publications, Gainesville, FL, USA. Chmielewski, F-M., Müller, A. & Bruns, E. (2013) Climate changes and trends in phenology of fruit trees and field crops in Germany, 1961–2000. Agricultural and Forest Meteorology 121:69-78. Christiano, R.S.C., Dalla Pria, M., Jesus, W.C. Jr., Parra ,J.R.P., Amorim, L., Filho, A.B. 2007. Effect of citrus leaf-miner damage, mechanical damage and inoculum concentration on severity of symptoms of Asiatic citrus canker in Tahiti lime. Crop Protection, 26, 59-65. Codex 2004. Codex Alimentarius International Food http://www.codexalimentarius.org/standards/list-standards/en www.efsa.europa.eu/publications
180
Standards.
Accessed
22/2/2015
EFSA Supporting publication 2016:EN-1062
The present document has been produced and adopted by the bodies identified above as authors. This task has been carried out exclusively by the authors in the context of a contract between the European Food Safety Authority and the authors, awarded following a tender procedure. The present document is published complying with the transparency principle to which the Authority is subject. It may not be considered as an output adopted by the Authority. The European Food Safety Authority reserves its rights, view and position as regards the issues addressed and the conclusions reached in the present document, without prejudice to the rights of the authors.
Quantitative Pathway Analysis QPAFood
Compton, L., Fagan, M. 2000. Stepped-up canker eradication effort is launched. Florida Department of Agriculture Press Release No. 2-23-2000. Connellan, J., Hardy, S., Sanderson, G. and Wangdi, P. 2010. Production guide for mandarin orchards in Bhutan, Australian Centre for International Agricultural Research: Canberra, 1-21. Crawley, M.J.; Brown, S.L. 2004. Spatially structured population dynamics in feral oilseed rape. Proc. Biol. Sci. 271(1551):1909–1916. Cromey, M. G.; Grvavac, N.; Sheridan, J. E. 1980. Diseases and pests of cereals in Wairarapa. A six year study. In: Proceedings of the 33rd New Zealand Weed and Pest Control Conference, Palmerston North, New Zealand, 254-257. New Zealand Weed and Pest Control Soc. Inc. Ministry of Agric. And Fisheries. Cullen, A.C., Frey, H.C. 1999. Probabilistic techniques in exposure assessment: A handbook dealing with variability and uncertainty in models and inputs. Plenum Press, New York, USA. 335pp. ISBN 0-30645956-6 DAFF (2012) Dept. of Agriculture, Forestry & Fisheries. Republic of South Africa. A profile of the South African plum market value chain, 2012 http://www.nda.agric.za/docs/AMCP/Plum2012.pdf Dalla Pria M., Christiano R. C. S., Furtado E. L., Amorim L. and Bergamin Filho A., 2006. Effect of temperature and leaf wetness duration on infection of sweet oranges by Asiatic citrus canker. Plant Pathology, 55, 657–663. Das, A. K. 2003. Citrus Canker- a review. J. Appl. Hort. 5:52-60. Davies, Undated. An overview of climatic effects on citrus flowering and fruit quality in various parts of the world. Horticulture Science Department, Gainsville, Florida, US. Day, K.R., Klonsky, K.M. & De Moura, R.L. (2009) Sample costs to establish and produce plums (Fresh Market). University of California Cooperative Extension (available via : http://www.agmrc.org/commodities__products/fruits/plums) De Paepe, D., Coudijzer, K., Noten, K., Valkenborg, D., Servaes, K., De Loose, M., Diels, L., Voorspoels, S. & , Van Droogenbroeck, B. (2015) A comparative study between spiral-filter press and belt press implemented in a cloudy apple juice production process. Food Chemistry 173:986–996. DeJong, T., Day, K., Lopez, G. & Johnson, S. (2008) Using Spring Weather Data to Predict Harvest Date and Sizing Potential for Peaches Nectarines and Plums. http://ucanr.edu/datastoreFiles/391-434.pdf Derso, E., Vernière, C., Pruvost, O. 2009. First report of Xanthomonas citri pv. citri-A* causing citrus canker on lime in Ethiopia. Plant Disease 93(2), p. 203. Dhillon, G.S., Kaur, S. &, Kaur Brar, S. (2013) Perspective of apple processing wastes as low-cost substrates for bioproduction of high value products: A review. Renewable and sustainable energy reviews, 27:789805. Dwivedi, S.K. (2012) Studies on extraction, characterization and antioxidant activity of biocolour extracted from plum waste. Training workshop on Characterisation of Fresh and Processed Fruit Quality, organised by the CUC, University of Southampton and the Nong Lam University, Vietnam funded by Leverhulme Trust, UK. Dated: 23-25 July, 2012. http://blog.soton.ac.uk/fruits/files/2011/12/Rev.-6-Dr.-ShailendraVietnam.pdf
.
EC DG Environment. 2010. Preparatory study on food waste across EU27. Brussels, Belgium 210pp. DOI : 10.2779/85947 EFSA 2010. Scientific opinion on a quantitative pathway analysis of the likelihood of Tilletia indica M. introduction into EU with importation of US wheat. EFSA Journal 2010; 8(6):1621.
www.efsa.europa.eu/publications
181
EFSA Supporting publication 2016:EN-1062
The present document has been produced and adopted by the bodies identified above as authors. This task has been carried out exclusively by the authors in the context of a contract between the European Food Safety Authority and the authors, awarded following a tender procedure. The present document is published complying with the transparency principle to which the Authority is subject. It may not be considered as an output adopted by the Authority. The European Food Safety Authority reserves its rights, view and position as regards the issues addressed and the conclusions reached in the present document, without prejudice to the rights of the authors.
Quantitative Pathway Analysis QPAFood
EFSA, 2011 Scientific Opinion on the request from the USA regarding export of Florida citrus fruit to the EU. EFSA Panel on Plant Health (PLH).European Food Safety Authority (EFSA), Parma, Italy EFSA Journal 2011,9 (12):2461. EFSA, 2014. Scientific Opinion on the risk to plant health of Xanthomonas citri pv. citri and Xanthomonas citri pv. aurantifolii for the EU territory. EFSA Panel on Plant Health (PLH) European Food Safety Authority (EFSA), Parma, Italy. EFSA Journal 2014,12 (2):3556. EPPO PQR (2014) EPPO Plant quarantine data retrieval system. V5.3.2 (updated 08-09/2014), EPPO, Paris. EPPO, 2014 PQR-EPPO database on quarantine pests (available online). http://www.eppo.int. Ethical Corporation (2006) The sustainability of European food supply https://www.google.co.uk/webhp?sourceid=chrome-instant&ion=1&espv=2&ie=UTF8#q=sustainability+of+European+food+supply+chains
chains.
328pp.
EUFIC (2012) Fruit and vegetable consumption in Europe – do Europeans get enough? European Food Information Council, Review 01/2012. http://www.eufic.org/article/en/expid/Fruit-vegetableconsumption-Europe/ European Commission EU FADN (2013) EU Cereals farm report 2012 Based on FADN data. http://ec.europa.eu/agriculture/rica/pdf/cereal_report_2012.pdf Eurostat European Commission (2008) NACE Rev.2 Statistical classification of economic activities in the European Community. Eurostat Methodologies and Working papers. . http://epp.eurostat.ec.europa.eu/cache/ITY_OFFPUB/KS-RA-07-015/EN/KS-RA-07-015-EN.PDF Ewing, W.N. (1997) The Feeds Directory, Vol 1. Commodity Products, Context, Packington. FAO (2008) International Standards for Phytosanitary Measures, ISPM No. 31 Methodologies for sampling of consignments, FAO, Rome, 19pp. FAO (2011) Global food losses and food waste http://www.fao.org/docrep/014/mb060e/mb060e.pdf
–
Extent,
causes
and
prevention.
Rome
FAO (2012) International Standards for Phytosanitary Measures, ISPM No. 5 Glossary of phytosanitary terms, FAO, Rome, 35pp. FAO (2016) International Standards for Phytosanitary Measures, ISPM No. 5 Glossary of phytosanitary terms, FAO, Rome, 38pp. Faust, M. & Surányi, D. (1998) Origin and dissemination of plums. Horticultural Reviews, 23:179-231. Ferguson, C.M.; Evans, A. A.; Barratt, B .I. P. 1996. Phenology of Listronotus bonariensis (Kuschel) (Coleoptera: Curculionidae) in Otago. Proc. 49th N.Z. Plant Protection Conf. 1996: 270-274. Ferguson, C.M.; Evans, A. A.; Shand, J.A.; Barratt, B .I. P. 1994. Factors affecting the distribution of Listronotus bonariensis (Kuschel) (Coleoptera: Curculionidae) in Otago and Southland. Proc. 47th N.Z. Weed and Pest Control Conf.: 279-281. Fernandez-Stasrk, K, Bamber, P., Gereffi, G. (2011) The fruit and vegetables global value chain. Duke University, Durham, USA. 63pp. http://www.cggc.duke.edu/pdfs/2011-11-10_CGGC_Fruit-andVegetables-Global-Value-Chain.pdf Fitchett, J. M. 2013 Phenological response of citrus flowering to climate variability and change in iran: 19602010. Dissertation submitted to the Faculty of Science in fulfilment of the requirements for the degree Master of Science. University of the Witwatersrand School of Geography, Archaeology and Environmental Sciences. Johannesburg, April 2013. Fletcher, J. (1898) The plum moth or lesser apple worm ( Grapholita (Semasia) prunivora Walsh). Rep. Exp. Farms Branch Dep Agric Can 199-201
www.efsa.europa.eu/publications
182
EFSA Supporting publication 2016:EN-1062
The present document has been produced and adopted by the bodies identified above as authors. This task has been carried out exclusively by the authors in the context of a contract between the European Food Safety Authority and the authors, awarded following a tender procedure. The present document is published complying with the transparency principle to which the Authority is subject. It may not be considered as an output adopted by the Authority. The European Food Safety Authority reserves its rights, view and position as regards the issues addressed and the conclusions reached in the present document, without prejudice to the rights of the authors.
Quantitative Pathway Analysis QPAFood
Fletcher, L. R.; Easton, H. S. 1997. The evaluation and use of endophytes for pasture improvement. In: Bacon, C. W.; Hill, N. S. ed. Neotyphodium/Grass Interactions. New York, Plenum Press. pp. 209-227. Fletcher, L. R.; Harvey, I. C. 1981. An association of Lolium endophyte with ryegrass staggers. New Zealand Veterinary Journal 29: 185-186. Food Science Australia (2005) Food Science Australia Fact Sheet: Refrigerated storage of perishable foods. Food Science Australia. February 2005. Fowler, G., Caton, B., Jackson, L., et al. (2006) Risks to the Southern United States Associated with Pine Shoot Beetle, Tomicus piniperda (Linnaeus), (Coleoptera: Scolytidae), on Pine Bark Nuggets, Logs and Lumber with Bark and Stumps from the United States Quarantined Area. USDA, Raleigh, USA. 96pp. FPJ (2010) Re:fresh Directory 2010. FPJ, Peterbourgh, UK. 364pp. FPJ (2011) Re:fresh Directory 2011. FPJ, Peterbourgh, UK. 372pp. Freshfel Europe (2011) Marketing standards Apples (Malus domestica http://www.freshquality.eu/cms-upload/files/Marketing_standards/Apples.pdf
Borkh),
v
2011
EU
Freshfel Europe (2011) Marketing standards Plums (Prunus domestics L. ssp.), v 2011 EU. Freshfel Europe 2011. Marketing standards Citrus fruit (Var http://www.freshquality.eu/cms-upload/files/Marketing_standards/Citrus.pdf
spp.),
v
2011
EU
Froman, M.B.G. (2014) Report on sanitary and phytosanitary measures. The Office of the United States Trade Representative (USTR) https://ustr.gov/sites/default/files/FINAL-2014-SPS-Report-Compiled.pdf Gassen, D. N. 1984. Insectos associados a cultura do trigo no Brasil, Passo Fundo. EMBRAPA-CNPT Circular Tecnica 3. GDV (2014) Cargo information: Apples, Transport Information Service GDV Gesamtverband der Deutschen Versicherungswirtschaft e.V., Berlin. http://www.tisgdv.de/tis_e/ware/obst/apfel/apfel.htm#anfang Goldson S. L. (1981) Non-reproductive determination of 'migratory' flight in Argentine stem weevils, Listronotus bonariensis. Physiol. Entomol. 6:283-288. Goldson, S. L. 1981. Reproductive diapause in the Argentine stem weevil, Listronotus bonariensis (Kuschel) (Coleoptera: Curculionidae), in New Zealand. Bull. Ent. Res. 71:275-287. Goldson, S. L.; Barker, G. M.; Barratt, B. I. P; Barlow, N. D. 1994. Progress in the biological control of Argentine stem weevil and comment on its potential. Proceedings of the New Zealand Grassland Association 56: 39-42. Goldson, S. L.; McNeill, M. R.; Proffitt, J. R.; Barker, G. M.; Addison, P. J.; Barrett, B. I. P.; Ferguson, C.M.I. 1993. Systematic mass rearing and release of Microctonus hyperodae (Hym.: Braconidae, Euphorinae), a parasitoid of the Argentine stem weevil Listronotus bonariensis (Col.:Curculionidae) and records of its establishment in New Zealand. Entomophaga 38:527-536. Goldson, S. L.; Penman, D. R. 1979. Effect of time of sowing on Argentine stem weevil ( Hyperodes bonariensis Kuschel) damage in autumn-sown Tama reyegrass. New Zealand Journal of Agricultural Research 22: 367-371. Goldson, S. L.; Proffitt, J. R., Baird, D. B. (1999a). Listronotus bonariensis (Coleoptera: Curculionidae) flight in Canterbury, New Zealand. Bulletin of Entomological Research 89 (5), 423-431. Goldson, S. L.; Proffitt, J. R.; McNeill, M. R.; Baird, D. B. 1999b. Linear patterns of dispersal and build-up of the introduced parasitoid Microctonus hyperodae (Hymenoptera: Braconidae), in Canterbury, New Zealand. Bulletin of Entomological Research 89: 347-353. Golmohammadi, M., Cubero, J., Peñalver, J. M., Quesada, J.M., López, M. M., Llop, P. 2007. Diagnosis of Xanthomonas axonopodis pv. citri, causal agent of citrus canker, in commercial fruits by isolation www.efsa.europa.eu/publications
183
EFSA Supporting publication 2016:EN-1062
The present document has been produced and adopted by the bodies identified above as authors. This task has been carried out exclusively by the authors in the context of a contract between the European Food Safety Authority and the authors, awarded following a tender procedure. The present document is published complying with the transparency principle to which the Authority is subject. It may not be considered as an output adopted by the Authority. The European Food Safety Authority reserves its rights, view and position as regards the issues addressed and the conclusions reached in the present document, without prejudice to the rights of the authors.
Quantitative Pathway Analysis QPAFood
and PCR-based methods. Journal of Applied Microbiology, 103(6): 2309-2315. http://www.blackwellsynergy.com/loi/jam Goto, M. 1962. Studies on citrus canker. I. Bull. Fac. Agric. Shizuoka Univ. Itwada, Japan, 12 : 3-72. (In Japanese with English summary). Goto, M. 1969. Studies on citrus canker in Japan. Proc. 1st Intn. Citrus Symp., Vol. 3, 1251-1252. Goto, M. 1970. Studies on citrus canker III. Survival of Xanthomonas citri (Hasse) Dowson in soils and on the surface of weeds. Bull. Fac. Agric. Shizuoka Univ., 20: 21-29. Goto, M. 1972. Survival of Xanthomonas citri in the bark tissues of citrus trees. Can. J. Bot., 50: 2629-2635., Goto, M. K. O., Okabe, N. 1975a. Studies on the saprophytic survival of Xc 2. Longevity and survival density of the bacterium on artificially infested weeds, plant residues and soils. Ann. Phytopath. Soc. Japan 41, 141-147. Goto, M., K. O. Okabe, N. 1975b. Studies on the saprophytic survival of Xc. 1. Detection of the bacterium from a grass (Zoysia japonica). Ann. Phytopath. Soc. Japan 41, 9-14. Goto, M., Toyoshima, A., Tanaka, S. 1978. Studies on saprophytic survival of Xanthomonas citri (Hasse) Dowson. 3. Inoculum density of the bacterium surviving in the saprophytic form. Annals of the Phytopathological Society of Japan, 44(2), 197–201. Gottwald T. R., Bassanezi R. B., Amorim L. and Bergamin Filho A., 2007. Spatial pattern analysis of citrus canker-infected plantings in São Paulo, Brazil, and augmentation of infection elicited by the Asian leafminer. Phytopathology, 97, 674–683. Gottwald, T. R., Graham, J. H. 1992. A device for precise and nondisruptive stomatal inoculation of leaf tissue with bacterial pathogens. Phytopathology 82: 930-935. Gottwald, T. R., Graham, J. H., Egel, D. S. 1992a. Analysis of foci of Asiatic citrus canker in a Florida citrus orchard. Plant Dis. 76: 389-396. Gottwald, T. R., Graham, J. H., Schubert, T. S. 1997. An epidemiological analysis of the spread of citrus canker in urban Miami, Florida, and synergistic interaction with the Asian citrus leafminer. Fruits 52:371378. Gottwald, T. R., Graham, J. H., Schubert, T. S. 2002a. Citrus canker: The pathogen and its impact. Online Plant Health Progress doi:10.1094/PHP-2002-0812-01-RV. Gottwald, T. R., McGuire, R. G., Garran, S. 1988. Asiatic citrus canker: Spatial and temporal spread in simulated new planting situations in Argentina. Phytopathology 78:739-745. Gottwald, T. R., Sun, X., Riley, T., Graham, J. H., Ferrandino, F., Taylor, E. L. 2002b. Georeferenced spatiotemporal analysis of the urban citrus canker epidemic in Florida. Phytopathology 92: 361-377. Gottwald, T. R., Hughes, G., Graham, J. H., Sun, X., Riley, T. 2001. The citrus canker epidemic in Florida: The scientific basis of regulatory eradication policy for an invasive species. Phytopathology 91:30-34. Gottwald, T., Graham, J., Bock, C., Bonn, G., Civerolo, E., Irey, M., Leite, R., McCollum, G., Parker, P., Ramallo, J., Riley, T., Schubert, T., Stein, B., Taylor, E. 2009. The epidemiological significance of post-packinghouse survival of Xanthomonas citri subsp. citri for dissemination of Asiatic citrus canker via infected fruit. Crop Protection, 28, 508–524. Graham, J. H., Gottwald, T. R., 1989. Variation in aggressiveness of Xanthomonas campestris pv. citrumelo associated with citrus bacterial spot (CBS) in Florida. Phytopathology, 79, 1182. Graham, J. H. and Leite, R. P., 2004a. Lack of control of citrus canker by induced systemic resistance compounds. Plant Disease, 88:745–750. Graham, J. H., McGuire, R. G. and Miller J. W., 1987. Survival of Xanthomonas campestris pv. citri in citrus plant debris and soil in Florida and Argentina. Plant Disease, 71:1094–1098 www.efsa.europa.eu/publications
184
EFSA Supporting publication 2016:EN-1062
The present document has been produced and adopted by the bodies identified above as authors. This task has been carried out exclusively by the authors in the context of a contract between the European Food Safety Authority and the authors, awarded following a tender procedure. The present document is published complying with the transparency principle to which the Authority is subject. It may not be considered as an output adopted by the Authority. The European Food Safety Authority reserves its rights, view and position as regards the issues addressed and the conclusions reached in the present document, without prejudice to the rights of the authors.
Quantitative Pathway Analysis QPAFood
Graham, J.H., and Gottwald, T. R. 1991. Research perspectives on eradication of citrus bacterial diseases in Florida. Plant Dis. 75:1193-1200. Graham, J.H., Gottwald, T.R., Riley, T.D., Bruce, M. A., 1992. Susceptibility of citrus fruit to bacterial spot and citrus canker. Phytopathology, 82:452-457. Graham, J.H., Gottwald, T.R., Civerolo, E.L., McGuire, R.G. 1989. Population dynamics and survival of Xanthomonas campestris in soil in citrus nurseries in Maryland and Argentina. Plant Dis. 73:423-427. Graham, J.H., Gottwald, T.R., Cubero, J., and Achor, D.S. 2004b. Xanthomonas axonopodis pv citri: factors affecting successful eradication of citrus canker.Molec. Plant Pathol. 5:1-15. Graham, J.H., Gottwald, T.R., Riley, T.D., Cubero, J., and Drouillard, D.L. 2000. Survival of Xanthomonas campestri pv. citri (Xcc) on various surfaces and chemical control of Asiatic citrus canker (ACC). (Abstr.) Proc. Int. Citrus Canker Res. Workshop, June 20-22, 2000. Florida Department of Agriculture and Consumer Services. Published online. Hansen, J.D. (2002) Effects of cold temperature treatments on the morality of eggs and feeding larvae of the oriental fruit moth. HortTech 12: 203-205. Hardy, R. J.; Terauds, A.; Rapley, P. E. L.; Williams, M. A.; Ireson, J. E.; Miller, L. A.; Brieze-Stegeman, R.; McQuillan, P. B. 1979: Insect pest survey. Tasmanian Department of Agriculture Report 11. Harpster, H.W., D.R. Buckmaster, D.R. & Adams, R.S. (1993). Recycling food industry wastes as livestock feed. In Utilization of food processing residuals, Ed. P.D. Robillard and K.S. Martin, NRAES-69, 4-14. Northeast Regional Agricultural Engineering Service. Ithaca, NY. Hasse, C.H. 1915. Pseudomonas citri - the cause of citrus canker. J. Agric. Res., 4: 97-100 HDC (2002) Apple Best Practice Guide. Horticultural Development Company. http://pdfcrowd.com/url_to_pdf/?use_print_media=1
.
Hecht, M.; Oehen, B.; Schulze, J.; Brodmann, P.; Bagutti, C. 2014. Detection of feral GT73 transgenic oilseed rape (Brassica napus) along railway lines on entry routes to oilseed factories in Switzerland. Environ. Sci. Pollut. Res. 21: 1455-1465. HGCA. 2008. The wheat growth guide 2nd edition. www.hgca.com. Higgins, J.P.T. & Green, S. (eds). (2009) Cochrane Handbook for Systematic Reviews of Interventions, Version 5.0.2 [updated September 2009]. www.cochrane-handbook.org Hill, D.S. (1983) Agricultural Insect Pests of the Tropics and their control, 2nd Edn., Cambridge University Press, London, 746pp. Hingley, M.K., Lindgreen, A., and Casswell, B. (2005) “Supplier-retailer relationships in United Kingdom fresh produce supply chain”, Journal of International Food & Agribusiness Marketing, Vol. 18, No. 1/2, pp. 4986. (ISSN 0897-4438) http://orca.cf.ac.uk/55287/1/Article%2022.pdf Hoffmann, E.J., Coombs, A.B. & Whalon, M.E. (2004) Reproductive development of Northern and Southern Strains of Plum Curculio (Coleoptera: Curculionidae) Journal of Economic Entomology 97(1), 27-32. doi: http://dx.doi.org/10.1603/0022-0493-97.1.27 Huffman, W.E (2012) The Status of Labor-saving Mechanization in U.S. Fruit and Vegetable Harvesting. http://migrationfiles.ucdavis.edu/uploads/cf/files/2012-may/huffman-fruit-feg-harvesters-042412a.pdf Hui Y.H. (Ed) (2006) Handbook of fruits and fruit processing. Blackwell, London. IBIS (2014) IBIS World Industry Report, Global Fruit & Vegetables Processing, August 2014 http://www.ibisworld.com/gosample.aspx?cid=0&rtid=1 ISPM 2008. International standards for Phytosanitary measures: ISPM No. 31. Methodologies for sampling of Consignments. International Plant Protection Convention. FAO, 2008.
www.efsa.europa.eu/publications
185
EFSA Supporting publication 2016:EN-1062
The present document has been produced and adopted by the bodies identified above as authors. This task has been carried out exclusively by the authors in the context of a contract between the European Food Safety Authority and the authors, awarded following a tender procedure. The present document is published complying with the transparency principle to which the Authority is subject. It may not be considered as an output adopted by the Authority. The European Food Safety Authority reserves its rights, view and position as regards the issues addressed and the conclusions reached in the present document, without prejudice to the rights of the authors.
Quantitative Pathway Analysis QPAFood
ISPM 2010. International standards for Phytosanitary measures: ISPM No. 5. Glossary of phytosanitary terms. International Plant Protection Convention. FAO, 2010. Italmopa (Associazione Industriale Mugnai d’Italia), 2010. Cited in EFSA 2010 Jaeger, H., Schulz, M., Lu, P. & Knorr, D. (2012) Adjustment of milling, mash electroporation and pressing for the development of a PEF assisted juice production in industrial scale. Innovative Food Science & Emerging Technologies, 14:46-60. Janse, J.D. 2012. Bacterial diseases that may or do emerge, with (possible) economic damage for Europe and the Mediterranean basin: notes on epidemiology, risks, prevention and management on first occurrence. Journal of Plant Pathology, 94:29. Jenkins, T.M., Easton, T.D., Cottrell, T.E., Amis, A., Horton, D.L. & Alston, D.G. (2013) A DNA marker to track Conotrachelus nenuphar (Coleoptera: Curculionidae) dispersal. Journal of Entomological Science, 49:9193. Jetter K. M., Summer D. A. and Civerolo E. L., 2000. Ex ante economics of exotic disease policy: citrus canker in California. Proceedings of the Integrating Risk Assessment and Economics for Regulatory Decisions, 7 December 2000, Washington, DC, USA, 57 pp. Judd, G.J.R. & Gardiner, M.G.T. (2006) Temperature, irradiation and delivery as factors affecting spring-time flight activity and recapture of mass-reared male codling moths released by the OkanaganKootenay sterile insect programme. Journal of The Entomological Society of British Columbia 103:19-32. http://journal.entsocbc.ca/index.php/journal/article/viewFile/110/107111 Kawata, M.; Murakami, K.; Ishikawa, T. 2009. Dispersal and persistence of genetically modified oilseed rape around Japanese harbors. Environ. Sci. Pollut. Res. 16(2):120–126. Keen, B.P., Bishop, A.L., Gibson, T.S., Spohr, L.J. & Wong, P.T.W. (2002) Phylloxera mortality and temperature profiles in compost. Australian Journal of Grape and Wine Research 8:56-61. Kemp, H. (1996) Flowering phenology in European countries apple, pear, plum and cherry. Acta Horticulturae 423: 299-302. 2nd Workshop on Pollination. http://www.actahort.org/books/423/423_32.htm Kennedy, M., List, D., Lu, Y., Foo, L.Y., Newman, R.H., Sims, I.M., Bain, P.J.S., Hamilton, B. & Fenton, G. (1999) Apple pomace and products derived from apple pomace: uses, composition and analysis. pp75-119, In: Linkens, H.F. & Jackson, J.F. (Eds) (1999) Modern Methods of Plant Analysis Volume 20: Analysis of Plant Waste materials. Springer, New York. Koizumi. 1977. Behaviour of Xanthomonas citri (Hasse) Dowson and histological changes of diseased tissues in the process of lesion extension. Annals of the Phytopathological Society of Japan, 43, 129–136. Konopacka D, Jesionkowska K, Kruczyńska D, Stehr R, Schoorl F, Buehler A, Egger S, Codarin S, Hilaire C, Höller I, Guerra W, Liverani A, Donati F, Sansavini S, Martinelli A, Petiot C, Carbó J, Echeverria G, Iglesias I, Bonany J. (2010) Apple and peach consumption habits across European countries. Appetite 55:478 483. Krautgartner, R., Pinckaers, M., Nemes, F., Bettini, O. & DeBelder, T. (2013) EU-28 Fresh deciduous fruit annual production in 2013. USDA Foreign Agricultural Service, Global Agricultural Information Network (GAIN) Report Number AU1309. http://gain.fas.usda.gov/Recent%20GAIN%20Publications/Fresh%20Deciduous%20Fruit%20Annual_Vien na_EU-27_11-25-2013.pdf Krawczyk, G. & Johnson, J.W. (1996) Occurrence and pest status of lesser apple worm Grapholita prunivora Walsh in Michigan apple orchards. Acta Horticulturae 422, International Conference on Integrated Fruit Production, 356-357. http://www.actahort.org/books/422/422_78.htm
www.efsa.europa.eu/publications
186
EFSA Supporting publication 2016:EN-1062
The present document has been produced and adopted by the bodies identified above as authors. This task has been carried out exclusively by the authors in the context of a contract between the European Food Safety Authority and the authors, awarded following a tender procedure. The present document is published complying with the transparency principle to which the Authority is subject. It may not be considered as an output adopted by the Authority. The European Food Safety Authority reserves its rights, view and position as regards the issues addressed and the conclusions reached in the present document, without prejudice to the rights of the authors.
Quantitative Pathway Analysis QPAFood
Kuhara, S. 1978. Present epidemic status and control of citrus canker disease Xanthomonas citri (Hasse) Dow. in Japan. Rev. Plant Prot. Res., 11: 132-142. Lan, Z., Scherm, H. & Horton, D.L. (2004) Temperature-dependent development and prediction of emergence of the summer generation of plum curculio (Coleoptera: Curculionidae) in the southeastern United States. Environmental Entomology 33, 174–181. Lee, P, Willis, P. 2010. Waste arisings in the supply of food and drink to households in the UK. WRAP, 85pp. Legave, J.M., Blanke. M., Christen, D., Giovannini, D., Mathieu, V. & Oger, R. (2012) A comprehensive overview of the spatial and temporal variability of apple bud dormancy release and blooming phenology in Western Europe. 10.1007/s00484-012-0551-9
International
Journal
of
Biometeorology
57:317–331.
DOI
Leite Jr, R. P. and Mohan S. K., 1987. Survival of Xanthomonas campestris pv. citri (Hasse) Dye in soil and in association with some gramineous plants. Proceedings of the International Society of Citriculture, São Paulo, Brazil, 365–368 Leite Jr, R. P., Mohan, S. K., Pereira, A. L. G., and Campacci, C. A. 1987. Integrated control of citrus cankereffect of genetic resistance and application of bactericides. Fitopatol. Bras. 12: 257-263. Leite, R. P., and Mohan, S. K. 1990. Integrated management of the citrus bacterial canker disease caused by Xanthomonas campestris pv. citri in the state of Parana, Brazil. Lemanowicz, M. & Krukowski, A. (2009) Quantitative description of the fruit industry and fruit supply chains in Poland. Paper prepared for presentation at the 113th EAAE Seminar “A resilient European food industry and food chain in a challenging world”, Chania, Crete, Greece, date as in: September 3 - 6, 2009. http://ageconsearch.umn.edu/bitstream/58083/2/Lemanowicz.pdf Leskey, T.C. & Wright, S.E. (2007) Host preference of the plum curculio Entomologia Experimentalis et Applicata 123 (3), 217-227. Levine, E. & Hall, F.R. (1977) Effect of feeding and oviposition by the plum curculio on apple and plum fruit abscission. Journal of Economic Entomology 70:603–607 Lienk, S.E.(1980) Plum Curculio Conotrachelus nenuphar (Herbst) (Coleoptera: Curculionidae) Tree fruit IPM. Insect Identification Sheet No. 3. http://nysipm.cornell.edu/factsheets/treefruit/pests/pc/pc.pdf MacLeod, A. (2015) Case study: Pome fruit (apples) from USA and Canada with potential infestation by Cydia prunivora. EFSA QPA Food. Working paper on case study pathways (pests and commodities) to inform inputs to the quantitative models CFT/EFSA/PLH/2011/01 Development of probabilistic models for quantitative pathway analysis of plant pests introduction for the EU territory, Lot 1 Unpublished Working Paper report: February 2015. MacLeod, A., et al., (2012). Pest risk assessment for the European Community Plant Health: a comparative approach with case studies. EFSA external science report, Supporting publications 2012:EN-319. http://www.efsa.europa.eu/en/supporting/pub/319e.htm Mani, E. & Wildbolz, T. (1977) The dispersal of male codling moths ( Laspeyresia pomonella L.) in the upper Rhine valley. Z. Ang. Ent. 83:161–168. Mannapperuma, J.D. (2005) Residual management in fruit processing plants. In: Barrett, D.M., Somogyi, L. & Ramaswamy, H. (Eds) Processing Fruits, Science and Technlogy, 2nd Edn. Chapter 17 p423-454. CRC Press, Boca Raton. Mantey, K.D., Moffitt, H.R. & Neven, L.G. (2000) Laboratory rearing of lesser appleworm (Lepidoptera: Tortricidae) Journal of Economic Entomology 93:1021- 1024 Marshall Ingredients (2015) Plum Fiber. http://www.marshallingredients.com/pdfs/Plum-2014.pdf. McElroy, T. 2000. Crawford unveils bold new canker plan. Florida Department of Agriculture Press Release 02-11-2000. www.efsa.europa.eu/publications
187
EFSA Supporting publication 2016:EN-1062
The present document has been produced and adopted by the bodies identified above as authors. This task has been carried out exclusively by the authors in the context of a contract between the European Food Safety Authority and the authors, awarded following a tender procedure. The present document is published complying with the transparency principle to which the Authority is subject. It may not be considered as an output adopted by the Authority. The European Food Safety Authority reserves its rights, view and position as regards the issues addressed and the conclusions reached in the present document, without prejudice to the rights of the authors.
Quantitative Pathway Analysis QPAFood
Medina-Urrutia, V. M., Stapleton, J. J. 1986. Control of mexican lime bacteriosis with copper-based products. Proc. Fla. State Hortic. Soc. 98: 22-25. Meier, U. (2001) (Ed) Growth stages of mono-and dicotyledonous plants. BBCH Monograph. 2nd Edition, Federal Biological Research Centre for Agriculture and Forestry. . http://www.bba.de/veroeff/bbch/bbcheng.pdf Meijer, H., van Elk, P., van Dieren, M.C.A. Heijerman-Peppelman, G. & Maas, F.M. (2013) Selection of large, blue and sweet European plums for the "Lazoet" concept. Acta Horticulturae 985, 261-265. Xth International Symposium on Plum and Prune Genetics, Breeding and Pomology, Davis, California, USA May 20th -25th, 2012 Mendes, D. M. 2011 EU-28 Citrus Annual Report. Gain Report No. SP1128. USDA Global Agricultural Information Network. 12/14/2011. Metcalf, R.L. & Metcalf, R.A. (1993) Destructive & Useful Insects, 5th Edn., McGraw-Hill, New York Michigan Department of Environmental Quality (2007) Michigan Fruit and Vegetable Processors’s guide to environmental regulations. http://www.michigan.gov/documents/deq/deq-ess-p2tasFVGuidebook_199592_7.pdf Michigan Plum Growers Association (2012) Michigan Plums, Insects http://www.michiganplum.org/insects/ Milala, J., Kosmala, M., Sójka, M., Kołodziejczyk, K., Zbrzeźniak, M. & Markowski, J. (2013) Plum pomaces as a potential source of dietary fibre: composition and antioxidant properties Journal of Food Science & Technology, 50 (5), 1012–1017. DOI: 10.1007/s13197-011-0601-z Minas, I.S., Crisostoa, G.M., Holcroft, D., Vasilakakis, M. & Crisostoa, C.H. (2013) Postharvest handling of o plums (Prunus salicina Lindl.) at 10 C to save energy and preserve fruit quality using an innovative application system of 1-MCP. Postharvest Biology and Technology 76, 1–9 Moffitt, H.R. (1988) Status of efforts to meet Japanese import quarantine requirements for apples. Proceedings of the Washington Entomological Society, 50: 863-864. Monfreda, C., Ramankutty, N. & Foley, J.A. (2008) Farming the planet: 2. Geographic distribution of crop areas, yields, physiological types, and net primary production in the year 2000, Global Biogeochemical Cycles, 22, GB1022, doi:10.1029/2007GB002947 Monspart-Senyi, J. (2006) Fruit Processing Waste Management. In: Hui Y.H. (Ed) Handbook of fruits and fruit processing. Chapter 10, p171-186. Blackwell, London. http://www.slideshare.net/Hariezt24/handbook-of-fruits-and-fruit-processing Muraro, R. P., Roka, F., and Spreen, T. H. (2000). An overview of Argentina’s citrus canker control program with applicable costs for a similar program in Florida. (Abstr.) In: Proceedings of the International Citrus Canker Research Workshop, Ft. Pierce FL, June 20-22, 2000. Online. Division of Plant Industry, Florida Department of Agriculture and Consumer Services. Muraro, R.P., Roka, F., Spreen, T.H. (2001) “Grower Costs of Having Citrus Canker in Florida.” Extension fact sheet No. FE 286, Florida Cooperative Extension Service, University of Florida, September, 2001. Available at http://edis.ifas.ufl.edu/FE286 NAEGA, (North American Export Grain Association, Washington, D.C.), (2006). Cited in EFSA 2010. NAPPO, 2013. Phytosanitary Alert System: Detection of Citrus Canker (Xanthomonas axonopodis pv. citri) in Louisiana. NAPPO. http://www.pestalert.org/oprDetail.cfm?oprID=550 NASS (2015) USDA National Agricultural Statistics Service, Non-citrus Fruits and Nuts 2014, Preliminary Summary. January 2015. http://usda.mannlib.cornell.edu/usda/current/NoncFruiNu/NoncFruiNu-01-232015.pdf
www.efsa.europa.eu/publications
188
EFSA Supporting publication 2016:EN-1062
The present document has been produced and adopted by the bodies identified above as authors. This task has been carried out exclusively by the authors in the context of a contract between the European Food Safety Authority and the authors, awarded following a tender procedure. The present document is published complying with the transparency principle to which the Authority is subject. It may not be considered as an output adopted by the Authority. The European Food Safety Authority reserves its rights, view and position as regards the issues addressed and the conclusions reached in the present document, without prejudice to the rights of the authors.
Quantitative Pathway Analysis QPAFood
National Research Council (1983) Underutilized resources as animal feedstuffs. National Research Council Subcommittee on underutilized resources as animal feedstuffs. National Academies Press, Washington http://www.nap.edu/openbook.php?record_id=41&page=R2 Neven, L.G. (2004) Effects of low temperature on egg and larval stages of the lesser apple worm (Lepidoptera: Tortricidae) Journal of Economic Entomology 97:820-823 Niemczyk, H.D. (2012) The Annual Bluegrass Weevil, Listronotus maculicolis – 2012. http://entomology.osu.edu/~bugdoc/HDN/HDNpics/ABGW%20HANDOUT%20Report%2009-2712%20FINAL%20.pdf
.
Ohioline, 2003. Recommended Storage Temperature and Relative Humidity Compatibility Groups Ohio State University Extension web site “Ohioline” (http://ohioline.osu.edu). Ostojá-Starzewski, J. 2011. Argentine stem weevil Listronotus bonariensis (Kuschel). Plant pest factsheet. The Food and Environment Research Agency (Fera). Owens, E.D., Hauschild, K.I., Hubbell, G.L. & Prokopy, R.J. (1982) Diurnal behaviour of plum curculio (Coleoptera: Curculionidae) adults within host trees in nature. Annals of the Entomological Society of America, 75:92-98. Parfitt, J, Barthel, M, Macnaughton, S. 2010. Food waste within food supply chains: quantification and potential for change to 2050. Phil. Trans. R. Soc. B 2010 365 3065-3081. DOI: 10.1098/rstb.2010.0126. Peck, G.M., Merwin, I.A., Brown, M.G. & Agnello, A.M. (2010) Integrated and Organic Fruit Production Systems for 'Liberty' Apple in the Northeast United States: A Systems-based Evaluation, Hortscience, 45:1038-1048. http://hortsci.ashspublications.org/content/45/7/1038.full.pdf+html Pecoroni, S., Flocke, R., Günnewig, W. & Schmitt, I. (2008) Systems and Processes from GEA Westfalia Separator for the Fruit-Processing and Juice-Making Industries. GEA Westfalia Separator Brochure. http://us.westfaliaseparator.com/fileadmin/GEA_WS_US/Documents/Brochures/Beverage/GEA_WS_Juice-Brochure.pdf Peltier, G. L., 1920. Influence of temperature and humidity of the grown of Pseudomonas citri and its host plants and on infection and development of the disease. Journal of Agricultural Research, 20, 447–506. Peterson GL, Whitaker TB, Stefanski RJ, Podleckis EV, Phillips JG, Wu JS, Martinez WH (2009) A risk assessment model for importation of United States milling wheat containing Tilletia contraversa. Plant Disease 96: 560-573. doi: 10.1094/PDIS-93-6-0560 Pfaltzgraff, L. A. 2014.The study and development of an integrated and additive-free waste orange peel biorefinery. Doctorate thesis, Green Chemistry Center of Excellence, University of York UK. Ploper, L. D., Ramallo, C.J. and Fogliata, G M., 2004. Proposal for monitoring citrus farms according to packing plant ability to remove fruits with quarantine diseases symptoms. Technical report. Annex VIII of the Report of the Second Meeting of the Expert Working Group on The Use of Integrated Measures in a Systems Approach for Pest Risk Management. IPPC (International Plant Protection Convention), 2006, 54–60. Available from: https://www.ippc.int/index.php?id=1110798&tx_publication_pi1[showUid]=124423&frompage=179725&t ype=publication&subtype=&L=0#item Polavarapu, S., Kyryczenko-Roth, V. & Barry, J.D. (2004) Phenology and infestation patterns of plum curculio (Coleoptera: Curculionidae) on four highbush blueberry cultivars. J Econ Entomol 97:1899-1905. Potter, D. (2012) Basic Information on the stone fruit crops. In: Kole, C. & Abbott, A.G. (Eds) Genetics, Genomics and Breeding of Stone Fruits, CRC Press 418 pp. Pottinger, R. P. 1961: Argentine stem weevil Hyperodes bonariensis, an insect pest of pastures. Canterbury Chamber of Commerce Agricultural Bulletin 380.
www.efsa.europa.eu/publications
189
EFSA Supporting publication 2016:EN-1062
The present document has been produced and adopted by the bodies identified above as authors. This task has been carried out exclusively by the authors in the context of a contract between the European Food Safety Authority and the authors, awarded following a tender procedure. The present document is published complying with the transparency principle to which the Authority is subject. It may not be considered as an output adopted by the Authority. The European Food Safety Authority reserves its rights, view and position as regards the issues addressed and the conclusions reached in the present document, without prejudice to the rights of the authors.
Quantitative Pathway Analysis QPAFood
Pottinger, R. P. 1966. Observations of the flight activity of stem weevil, Hyperodes bonariensis Kuschel in Canterbury. Proceedings of the New Zealand weed and pest control conference 19: 186-196. Pottinger, R. P.; Barker, G. M.; Wrenn, N. R.; Addison, P. J.; McGhie, R. A. 1984. Insecticidal control of adult Argentine stem weevil: a review and bioassay evaluations. Proceedings of the New Zealand Weed and Pest Control Conference 37: 101-105. Prestidge, R. A.; Barker, G. M.; Pottinger, R. P. 1991: The economic cost of Argentine stem weevil in pastures in New Zealand. Proceedings of the 44th New Zealand Weed and Pest Control Conference. pp. 165-170. Prestidge, R. A.; Barker, G. M.; Pottinger, R. P., Steele, K. M. 1985: Endophyte fungus increases ryegrass persistence through improved pest control. Proceedings of the XVth International Grassland Congress, Kyoto, Japan. Pp. 789-790. Prestidge, R. A.; Pottinger, R. P.; Barker, G. M. 1982: An association of Lolium endophyte with ryegrass resistance to Argentine stem weevil. Proceedings of the 35th New Zealand Weed and Pest Control Conference. pp119-122. Prestidge, R.A. & van der Zijpp, S.G. (1985) Argentine stem weevil (Listronotus bonariensis) survival in the Central North island. New Zealand Journal of Agricultural Research, 28:133-140. Prokopy, R.J., Chandler, B.W., Leskey, T.C. & Wright, S.E. (2000) Comparison of traps for monitoring plum curculio adults (Coleoptera: Curculionidae) in apple orchards. Journal of Entomological Science 35:411420 Pruvost O, Boher B, Brocherieux C, Nicole M and Chiroleu F, 2002. Survival of Xanthomonas axonopodis pv. citri in leaf lesions under tropical environmental conditions and simulated splash dispersal of inoculum. Phytopathology, 92, 336–346. Quested, T., Ingle, R., Parry, A. 2013. Household Food and Drink Waste in the United Kingdom 2012Final report for Waste and Resource Action Programme (WRAP, project code CFP102), Banbury, Oxon, UK, pp 135. Racette, G., Chouinard, G., Vincent C. & Hill, S.B. (1992) Ecology and management of plum curculio, Conotrachelus nenuphar [Coleoptera :Curculionidae], in apple orchards. Phytoprotection, 73 (3), 85-100. Reissig, H., Agnello, A., Nyrop, J.,(2005) Development of a new paradigm for management of internal Lepidoptera in western New York apple orchards. Bulletin OILB. 28:49-53. Rieger, M. (2006) Introduction to Fruit Crops (Crop Science). Haworth Press, New York, 462 pp. http://www.fruit-crops.com/plum-prunus-domestica-prunus-salicina/ Roberts RG, Hale CN, van der Zwet T, Miller CE, Redin SC (1998) The potential for spread of Erwinia amylovora and fire blight via commercial apple fruit; a critical review and risk assessment. Crop Protection 17: 19-28. doi: 10.1016/S0261-2194(98)80008-2 Romanovskaja, D. & Bakšiene, E. (2009) Influence of climate warming on beginning of flowering of apple tree (Malus domestica Borkh.) in Lithuania. Agronomy Research 7:87-96. . http://agronomy.emu.ee/vol071/p7109.pdf Root, W.H. & Barrett, D.M. (2005) Apples and Apple Processing. Chapter 18 (p455-480). In: Barrett, D.M., Somogyi, L. & Ramaswamy, H. (Eds) Processing Fruits, Science and Technlogy, 2nd Edn. CRC Press, Boca Raton, USA. Rossetti, V. 1977. Citrus canker in Latin America: A review. Proc. Int. Soc. Citric., 3: 918-924. Rowan, D. D.; Gaynor, D. L. 1986: Isolation of feeding deterrents against Argentine stem weevil from ryegrass infected with the endophyte Acremonium lolii. Journal of Chemical Ecology 12: 647-658.
www.efsa.europa.eu/publications
190
EFSA Supporting publication 2016:EN-1062
The present document has been produced and adopted by the bodies identified above as authors. This task has been carried out exclusively by the authors in the context of a contract between the European Food Safety Authority and the authors, awarded following a tender procedure. The present document is published complying with the transparency principle to which the Authority is subject. It may not be considered as an output adopted by the Authority. The European Food Safety Authority reserves its rights, view and position as regards the issues addressed and the conclusions reached in the present document, without prejudice to the rights of the authors.
Quantitative Pathway Analysis QPAFood
Saji, H.; Nakajima, N.; Aono, M.; Tamaoki, M.; Kubo, A.; Wakiyama, S.; Hatase, Y.; Nagatsu, M. 2005. Monitoring the escape of transgenic oilseed rape around Japanese ports and roadsides. Environ. Biosaf. Res. 4(4): 217–222. Sansford et al (2006) EC Fifth Framework Project QLK5-1999-01554: Risks associated with Tilletia indica, the newly-listed EU quarantine pathogen, the cause of Karnal bunt of wheat. . http://karnalpublic.pestrisk.net/files/eu_karnalbunt_pra.pdf Sansford, C. & MacLeod, A. (1998). Assessing composting as an effective means of sanitising agricultural and horticultural waste. Central Science Laboratory, unpublished document, 15pp. Schubert T. S., Miller J. W., Dixon W. N., Gottwald T. R., Graham J. H., Hebb L. H. and Poe S. R., 1999. Bacterial citrus canker and commercial movement of fresh citrus fruit. An assessment of the risk of fresh citrus fruit movement relative to the spread of bacterial citrus canker (Xanthomonas axonopodis pv citri), p. 13: Florida Department of Agricultural and Consumer Services. Schubert, T. S., Rizvi, S., Sun, X., Gottwald, T. R., Graham, J. and Dixon, W. 2001. Meeting the challenge of eradicating citrus canker in Florida-again. Plant Dis. 85: 340-345. Schumacher, P., Weyeneth, A., Weber, D. & Dorn, S. (1997) Long flights in Cydia pomonella L. (Lepidoptera: Tortricidae) measured by a flight mill: influence of sex, mated status and age. Physiological Entomology, 22, 149–160. Schuttelaer, 2009. Admixture of GM and non-GM crops at import, Overview, insight and supervision, Schuttelaar & Partners, The Hague. Selby, R.D. & Whalon, M.E. (2014) Comparing the emergence of Northern strain plum curculio larvae from multiple fruit varieties. Journal of Economic Entomology 107:1543-1553 Shalini, R. & Gupta, D.K. (2010) Utilization of pomace from apple processing industries: a review Journal of Food Science and Technology, 47 (4) 365-371. Shiotani H, Uematsu H, Tsukamoto T, Shimizu Y, Ueda K, Mizuno A and Sato S, 2009. Survival and dispersal of Xanthomonas citri pv. citri from infected Satsuma mandarin fruit. Crop Protection 28, 19–23. Smith, E.H. & Salkfeld, E.H. (1964) Ovary development and oviposition rates in the plum curculio (Conotrachelus nenuphar) Coleoptera: Curculionidae. Annals of the Entomological Society of America, 57:781-787. Smith, I.M., McNamara, D.G., Scott, P.R. & Holderness, M. (1997) Conotrachelus nenuphar, Datasheet on quarantine pests. In: Quarantine Pests for Europe, 2nd Edn., CABI / EPPO, Wallingford, 1425pp. Smock, R.M. & Neubert, A.M. (1950) Apples and Apple Products. New York, Inter-science. Somogyi, L.P. (1996) Plums and prunes. p95-116. In: Somogyi, L.P., Barrett, D.M. and Hui, Y.H. (Eds). Processing Fruits: Science and Technology. Volume 2, Major Processed Products. CRC Press (https://books.google.co.uk/books?isbn=1566763835) Somogyi, L.P., Barrett, D.M. and Hui, Y.H. (1996). Processing Fruits: Science and Technology. Volume 2, Major Processed Products. CRC Press https://books.google.co.uk/books?isbn=1566763835 Spreen T. H., Zansler M. L., Muraro R. P. and Roka, F., 2003. The costs and benefits associated with eradicating citrus canker in Florida. Proceedings of the The American Agricultural Economics Association Annual Meeting, 27-30 July 2003, Montreal, Canada, 24 Stall R. E., Miller J. W., Marco G. M., DeEchenique B. I. C., 1980. Population dynamics of Xanthomonas citri causing cancrosis of citrus in Argentina. Proceedings of the Florida State Horticultural Society, 93, 10–14. Stall, R. E., Marcó, G. M., and Canteros de Echenique, B. I. 1982. Importance of mesophyll in mature-leaf resistance to cancrosis of citrus. Phytopathology 72:1097-1100.
www.efsa.europa.eu/publications
191
EFSA Supporting publication 2016:EN-1062
The present document has been produced and adopted by the bodies identified above as authors. This task has been carried out exclusively by the authors in the context of a contract between the European Food Safety Authority and the authors, awarded following a tender procedure. The present document is published complying with the transparency principle to which the Authority is subject. It may not be considered as an output adopted by the Authority. The European Food Safety Authority reserves its rights, view and position as regards the issues addressed and the conclusions reached in the present document, without prejudice to the rights of the authors.
Quantitative Pathway Analysis QPAFood
Stansbury, C.D., McKirdy, S.J., Diggle, A.J. & Riley, I.T. 2002 Modeling the risk of entry, establishment, spread, containment, and economic impact of Tilletia indica, the cause of Karnal bunt of wheat, using an Australian context. Phytopathology, 92, 321-331. Stapleton J. J. 1986. Effects of postharvest chlorine and wax treatments on surface microflora of lime fruit in relation to citrus bacteriosis disease. Plant Disease, 70, 1046–1048. Stevens, H. W. 1915. Citrus canker – III. Univ. Florida Agric Expt. Sta. Bull. 128, 19 pp. Sun X. A., Stall R. E., Jones J. B., Cubero J., Gottwald T. R., Graham J. H., Dixon W. N., Schubert T. S., Chaloux P. H., Stromberg V. K., Lacy G. H. and Sutton B. D., 2004. Detection and characterization of a new strain of citrus canker bacteria from key Mexican lime and Alemow in South Florida. Plant Disease, 88:1179–1188. Tamis, W. L. M.; de Jong, T. J.; Groen, C. L. G.; Luijten, S. H.; de Snoo, G. R. 2009. COGEM Report. Transport chains and seed spillage of potential GM crops with wild relatives in the Netherlands. COGEM Report CGM 2010-02 CML Report 183. Tao Y. (2003). Fruit and transport systems (In: Encyclopedia of Agricultural, Food, and Biological Engineering. Ed. Heldman D. R.). Marcel Dekker Inc. pub. pp 425-430. Terry, L. A., Mena, C., Williams, A., Jenney, N., Whitehead, P. 2011. Fruit and Vegetable Resource Maps: Mapping fruit and vegetable waste through the retail and wholesale supply chain. Final report for Waste and Resource Action Programme (WRAP, project code RSC008), Banbury, Oxon, UK, pp 92. Thistlewood, H., Judd, G. & Clodius, M. (2004). Development of methods for sustainable management and monitoring of codling moth, Final report to the Okanagan-Kootenay Sterile Insect Release Board. Timmer L. W., Gottwald T. R., Zitko S.E., 1991. Bacterial exudation from lesions of Asiatic citrus canker and citrus bacterial spot. Plant Disease, 75, 192–195. Timmer, L. W. 1988. Evaluation of bactericides for control of citrus canker in Argentina. Proc. Fla. State Hort. Soc. 101: 6-9. Timmer, L. W., Garnsey, S. M., and Graham, J. H. 2000. Compendium of Citrus Diseases. American Phytopathogical Society, St. Paul, MN, USA. 92pp. TIS 2015. Transport Information Services and The Association of the German insurance industry (GDV) Berlin 2002-2015 (http://www.tis-gdv.de/tis_e/ware/obst/orangen/orangen.htm). Accessed 15/03/2015). Traoré, YN, Bui Thi Ngoc, L, Vernière, C and Pruvost, O, 2008. First report of Xanthomonas citri pv. citri causing citrus canker in Mali. Plant Disease, 92, 97 Trnka, M.; Rötter, R. P.; Ruiz-Ramos, M.; Kersebaum, K. C.; Olesen, J. E.; Žalud, Z.; Semenov, M. A. 2014a. Adverse weather conditions for European wheat production will become more frequent with climate change. Nature Climate Change. 4:637-643. Turka, M.F., Billaudc, C., Vorobievb, E. & Barona, A. (2012) Continuous pulsed electric field treatment of French cider apple and juice expression on the pilot scale belt press. Innovative Food Science & Emerging Technologies, 14:61-69. Tyson, R., Thistlewood., H. & Judd, G.J.R. (2007) Modelling dispersal of sterile male codling moths, Cydia pomonella, across orchard boundaries. Ecological modelling 205, 1–12. UNECE (2012). Standard FFV-14 concerning the marketing and commercial quality control of citrus fruit. 2012 edition United Nations New York. United Nations Economic Commission for Europe (UNECE) (2013) UNECE Standard FFV-50 concerning the marketing and commercial quality control of plums. . http://www.unece.org/fileadmin/DAM/trade/agr/standard/fresh/FFV-Std/English/29Plums_2013.pdf
www.efsa.europa.eu/publications
192
EFSA Supporting publication 2016:EN-1062
The present document has been produced and adopted by the bodies identified above as authors. This task has been carried out exclusively by the authors in the context of a contract between the European Food Safety Authority and the authors, awarded following a tender procedure. The present document is published complying with the transparency principle to which the Authority is subject. It may not be considered as an output adopted by the Authority. The European Food Safety Authority reserves its rights, view and position as regards the issues addressed and the conclusions reached in the present document, without prejudice to the rights of the authors.
Quantitative Pathway Analysis QPAFood
University of Maine (2015) Growing Fruit Trees in Maine - Insect Pests. http://umaine.edu/fruit/growingfruit-trees-in-maine/insect-pests/ USApple (2011) The Production and Utilization Analysis for the 2011 U.S. Apple Association. Apple Crop Outlook and Marketing Conference. U.S. Apple Association. . http://www.yvgsa.com/pdf/facts/USApple2011ProductionAnalysis.pdf USDA (United States Department of Agriculture), 2007. Evaluation of asymptomatic citrus fruit ( Citrus spp.) as a pathway for the introduction of citrus canker disease (Xanthomonas axonopodis pv citri) version 2. USDA, APHIS, April 2007. Available from: http://www.aphis.usda.gov/peer_review/downloads/citrus_movement/PRA_asymptomatic_fruit_rev2_42007.pdf. Valentini, N., Me, G., Ferrero, R. & Spanna, F. (2001) Use of bioclimatic indexes to characterize phenological phases of apple varieties in northern Ialy. International Journal of Biometeorology 45:191-195. Valverde, C. 2013. EU-28 Citrus Annual Report. Gain Report No. SP1325. USDA Global Agricultural Information Network. 12/11/2013. Vanham, D., Bouraoui, F., Leip, A., Grizzetti, B., and Bidoglio, G. (2015) Lost water and nitrogen resources due to EU consumer food waste. Environ. Res. Lett. 10 (2015) 084008 doi:10.1088/17489326/10/8/084008 Vernière C, Gottwald TR and Pruvost O, 2003. Disease development and symptom expression of Xanthomonas axonopodis pv. citri in various citrus plant tissues. Phytopathology, 93, 832–843. Vincent, C., Chouinard, G. & Hill, S.B. (1999) Progress in plum curculio management: a review. Agriculture, Ecosystems and Environment, 73:167–175. von der Lippe, M.; Kowarik, I. 2007. Long-distance dispersal of plants by vehicles as driver in plant invasions. Conserv. Biol. 21:986-996. von der Lippe, M.; Kowarik, I. 2007a. Crop seed spillage along roads: a factor of uncertainty in the containment of GMO. Ecography 30:483–490. Wheatley, J. & Wanless, D. (Eds) (2000) The Food Trades Directory of the UK and Europe 2000 (29th Edn) Volume 2, Europe. Hemming Group Ltd. London. 742pp Whiteside, J. O. 1985. How serious a threat is canker to Florida citrus production? Citrus Ind. Mag. 66:6, 10, 12-14, 16-17. Wilson, K. (2009) Harvesting and Handling Apples. Ontario Ministry of Agriculture, Food and Rural Affairs, Factsheet 89-175. http://www.omafra.gov.on.ca/english/crops/facts/00-003.htm Yepsen, R. (1994). Apples. New York: W.W. Norton & Co. Yoshimura, Y.; Beckie, H.J.; Matsuo, K. 2006. Transgenic oilseed rape along transportation routes and port of Vancouver in western Canada. Environ. Biosaf. Res. 5:67–75. Zhou, W., Widmer, W., Grohmann, K. 2007. Economic analysis of ethanol production from citrus peel waste. Proc. Fla. State Hort. Soc. 120:310-315.
www.efsa.europa.eu/publications
193
EFSA Supporting publication 2016:EN-1062
The present document has been produced and adopted by the bodies identified above as authors. This task has been carried out exclusively by the authors in the context of a contract between the European Food Safety Authority and the authors, awarded following a tender procedure. The present document is published complying with the transparency principle to which the Authority is subject. It may not be considered as an output adopted by the Authority. The European Food Safety Authority reserves its rights, view and position as regards the issues addressed and the conclusions reached in the present document, without prejudice to the rights of the authors.
Quantitative Pathway Analysis QPAFood
Glossary and Abbreviations CABI:
Centre for Agriculture and Biosciences International
CN code:
Combined Nomenclature Code for commodities; CN codes are used in Eurostat and elsewhere to identify commodity groupings
Commodity:
A type of plant, plant product, or other article being moved for trade or other purpose (FAO, 2016); the product traded, about which trade statistics are provided by EUROSTAT
Consignment:
A quantity of plants, plant products or other articles being moved from one country to another and covered, when required, by a single phytosanitary certificate (a consignment may be composed of one or more commodities or lots) (FAO, 2016)
Consignment model:
Pathway model of the movement and distribution of individual consignments from source countries to destinations in the EU
EC:
European Commission
EFSA:
European Food Safety Authority
Entry of a consignment:
Movement through a point of entry into an area (FAO, 2016)
Entry of a pest:
Movement of a pest into an area where it is not yet present, or present but not widely distributed and being officially controlled (FAO 1996)
EPPO:
The European and Mediterranean Plant Protection Organisation
EU:
European Union
EU28:
The 28 member states of the European Union
EUROSTAT database:
Database provided by EUROSTAT (a Directorate-General of the EC) with the aim to provide statistical information of its member states
FAO:
Food and Agricultural Organisation of the United Nations
FAOSTAT database:
Database provided by FAO
Generic model:
A model within the QPAFood project for one of the four product groups which can be appropriately parameterised to make it pest and commodity-specific
General commodity model:
A pathway model, within the QPAFood project, of an imported infested/infected commodity to and within the EU from source countries by month
Infested/infected commodity:
The trade commodity harbouring the pest of concern
IPPC:
International Plant Protection Convention
ISPM:
International standards for phytosanitary measures
Introduction:
Entry of a pest resulting in its establishment (FAO, 2016)
Module 1:
The first of two modules of the General commodity model; it concerns trade pathways based on the Eurostat data of five years of monthly trade volumes for each specific commodity into the EU28 from all source countries and territories
www.efsa.europa.eu/publications
194
EFSA Supporting publication 2016:EN-1062
The present document has been produced and adopted by the bodies identified above as authors. This task has been carried out exclusively by the authors in the context of a contract between the European Food Safety Authority and the authors, awarded following a tender procedure. The present document is published complying with the transparency principle to which the Authority is subject. It may not be considered as an output adopted by the Authority. The European Food Safety Authority reserves its rights, view and position as regards the issues addressed and the conclusions reached in the present document, without prejudice to the rights of the authors.
Quantitative Pathway Analysis QPAFood
Module 2:
The second of two modules of the General commodity model; it concerns the allocation of commodity volumes to processing, retail use and waste streams and the potential for pest transfer to a suitable host
NACE:
The Statistical Classification of Economic Activities in the European Community; NACE codes are used in Eurostat and elsewhere to identify commodity groupings
NPPO:
National Plant Protection Organisation
NUTS2:
Nomenclature of Units for Territorial Statistics; for each EU member country, a hierarchy of three NUTS levels is established by Eurostat; NUTS2 is the intermediate level of spatial resolution and 270 subregions of the EU are identified at NUTS2 resolution
PRA:
Pest risk assessment (FAO, 2016)
QPAFood:
The name given to the suite of models comprising the generic General commodity model and the generic Consignment model commissioned by EFSA for quantitative pathway analysis of food commodities
Risk (in QPAFood pathway models): The potential volume of infested commodity in potential contact with an area of susceptible domestic host crop Sensitivity:
The change in model results associated with changes in the values of specific model parameters
Transhipment:
The movement of consignments of the commodity of concern which pass through an EU country en route to another EU country or a nonEU country
Transfer to suitable host:
The process in which a pest leaves the products in a consignment and comes into contact with a new host
Vulnerability:
The potential for pest transfer in a region if the pest is released from an imported commodity in that region
www.efsa.europa.eu/publications
195
EFSA Supporting publication 2016:EN-1062
The present document has been produced and adopted by the bodies identified above as authors. This task has been carried out exclusively by the authors in the context of a contract between the European Food Safety Authority and the authors, awarded following a tender procedure. The present document is published complying with the transparency principle to which the Authority is subject. It may not be considered as an output adopted by the Authority. The European Food Safety Authority reserves its rights, view and position as regards the issues addressed and the conclusions reached in the present document, without prejudice to the rights of the authors.
Quantitative Pathway Analysis QPAFood
Appendix A – Case study: Sweet orange from all countries with potential infestation by Xanthomonas citri pv. Citri
A.1 Introduction The project had already selected the case study commodities and pests as shown in Table A.1.01. Table A.1.01: Quantitative Pathway Analysis Lot 1, Food: Case study commodities and pests Commodity
Pest
Pome fruit:
Cydia
Fresh apples Stone fruit: Fresh plums Citrus:
Common name
Case study countries
Lesser worm
Canada, USA
(Lepidoptera: Tortricidae)
Conotrachelus nenuphar (Herbst)
Plum weevil
Canada, USA
Xanthomonas citri citri
Asiatic canker
citrus
Any country where X. citri citri occurs (many countries).
Listronotus bonariensis (Kuschel)
Argentine stem weevil
Argentina, Bolivia, Brazil, Chile, Uruguay, Australia, New Zealand
prunivora
(Walsh)
(Coleoptera: Curculionidae)
Sweet oranges Cereals: Wheat
(Coleoptera: Curculionidae)
apple
To inform parameterization of the pathway models for each commodity, this report collects information on:
the distribution of pests at pathway origin,
exports and pathway regulations and pest survival,
trans-shipments,
commodity uses,
commodity processing and waste management, and
location of processors.
The information is used to provide the rationale for selecting the estimated values for several of the quantitative inputs required in the quantitative models describing the likelihood of pest entry via selected case study pathways on one of four commodity types (Table A.1.01). A.2 Seasonal orange imports by the EU The EU is the largest importer of sweet oranges in the world. Between 2008 and 2011, an average of around 931 thousand tonnes of oranges was imported into the EU (EU 27) representing around 22% of the world’s output. In addition, intra-EU trade of oranges originating in the southern EU Member States, Spain, Italy, Greece and Portugal over the same period amounted to around an average of 1,747 thousand tonnes per annum of which around 75% originated in Spain. Third Countries exporting oranges to the EU can be divided into northern and southern hemisphere suppliers characterised by distinct orange export seasons which largely supply oranges to EU MS outside the main European harvest season (early November- end of May). Major northern hemisphere suppliers include the Mediterranean countries, USA and Cuba which historically have accounted for more than 80% of imports to www.efsa.europa.eu/publications
196
EFSA Supporting publication 2016:EN-1062
The present document has been produced and adopted by the bodies identified above as authors. This task has been carried out exclusively by the authors in the context of a contract between the European Food Safety Authority and the authors, awarded following a tender procedure. The present document is published complying with the transparency principle to which the Authority is subject. It may not be considered as an output adopted by the Authority. The European Food Safety Authority reserves its rights, view and position as regards the issues addressed and the conclusions reached in the present document, without prejudice to the rights of the authors.
Quantitative Pathway Analysis QPAFood
EU MS between January and June. Among the most important of the Mediterranean exporters in recent years have been Israel and Morocco followed by Egypt, Turkey and Tunisa. In contrast the orange export season of the major southern hemisphere producers -South Africa, Brazil, Argentina, Uruguay, Australia, Zimbabwe and Swaziland, lasts from June to November, A.3 Occurrence of case study pest at origin This case study is restricted to the risk of introduction of the causal agent of citrus canker, Xanthomonas citri pv. citri (ex Hasse 1915) Gabriel et al., into EU Member States. This and the closely related X. citri pv. aurantifolii are the only pathotypes causing significant damage to the citrus industry (Jetter et al., 2000; Spreen et al., 2003). Much of the information on the biology and distribution of the bacterium is derived from an earlier report on citrus canker eradication by the University of Florida, US (Schubert et al. 2001) and a more recent EFSA review of the pathogen (EFSA 2014). Citrus canker, caused by Xanthomonas citri pv. citri (X. citri subsp. citri, X. axonopodis pv. citri) also known commonly as Asian citrus canker, is an EU quarantine disease of Citrus spp. characterized by corky lesions on leaves, fruits and twigs. The disease was first described by Stevens in 1915 and the causal bacterium, by Hasse in 1915 in the USA although the pathogen is thought to originate in Asia. Symptom development and spread of the bacterium are enhanced by the activity of the citrus leaf miner, Phyllocnistis citrella, which occurs in nearly all citrus growing areas of the world. In Europe is is established in the Iberian peninsula, Corsica, Italy, Greece and Montenegro (see Janse, 2012) and its effect in increasing the severity of the disease is caused by the damage caused by larvae mining under the surface of the leaves. Whilst this insect is not a true vector, bacteria present incidentally on the surface of larvae, can be carried into the leaves through the galleries produced by its mining activity.
X. citri pv. citri is the most widespread and aggressive of a number of related strains or pathovars causing citrus canker. Grapefruit (C. paradisi), Mexican/Key lime (C. aurantiifolia) Palestine sweet lime (C. limmetioides), trifoliate citrus (Poncirus trifoliate), C. hystrix and sweet orange (C. sinensis) cultivars Hamlin, Navel and Pineapple are the most susceptible species affected by X. citri pv. citri strain A (Asiatic canker, Oriental canker or canker ‘A) Other varieties of sweet orange, along with lemon ( C. limon), sour orange (C. aurantium), tangelo and pummelo (C. maxima) are generally considered to be moderately susceptible. A second group of strains designated A* reported from Cambodia, Oman, India, Iran and Saudi Arabia, considered to be distinct from other A strains of the pathogen (Whiteside, 1985), is restricted to Mexican lime, and Tahiti lime (C. latifolia) but not grapefruit whilst a third group of strains designated Aw infect Mexican lime and alemow (C. macrophylla) in Florida, USA (Sun et al., 2004).
South American canker (cancrosis B) caused by X. citri pv. aurantifolii, is presently confined to South America and Mexico on lemons, Mexican lime, sour orange and pummelo, whilst strains within X. citri pv. aurantifolii, cancrosis C, presently confined to Sao Paulo, Brazil, infects only Mexican lime and sour orange whilst cancrosis D is restricted to Mexican lime in Mexico (Janse, 2012). A.4 Current distribution The global official distribution of X. citri pv. citri and X. citri pv. aurantifolii from the EPPO-PQR database (EPPO 2014) is shown in Figure A.4.01 and Annex B. In addition, X. citri pv. citri was reported recently from Louisiana (NAPPO, 2013). The geographical distribution of X. citri pv. aurantifolli is restricted to Argentina, Brazil, Paraguay and Uruguay (Rossetti, 1977).
www.efsa.europa.eu/publications
197
EFSA Supporting publication 2016:EN-1062
The present document has been produced and adopted by the bodies identified above as authors. This task has been carried out exclusively by the authors in the context of a contract between the European Food Safety Authority and the authors, awarded following a tender procedure. The present document is published complying with the transparency principle to which the Authority is subject. It may not be considered as an output adopted by the Authority. The European Food Safety Authority reserves its rights, view and position as regards the issues addressed and the conclusions reached in the present document, without prejudice to the rights of the authors.
Quantitative Pathway Analysis QPAFood
Figure A.4.01: World distribution of X. citri pv citri
X. citri pv. citri originates from and is widespread in Asia, including Georgia, Iran, Iraq, Oman, Saudi Arabia,
UAE and Yemen. Australia (eradicated), Argentina, Belau, Brazil, Caroline Islands, Cocos Islands, Comoros, Congo Democratic Republic, Ivory Coast, Fiji, Gabon, Madagascar, Mauritius, Mozambique (eradicated), Netherlands Antilles, New Zealand (eradicated), Micronesia, Palau, Papua New Guinea, Paraguay, Reunion, Seychelles, South Africa (eradicated), Uruguay, USA (CABI/EPPO, 2006). There are recent reports from Somalia (Balestra et al., 2008) Mali (Traoré et al., 2009) and Ethiopia (A* strains, Derso et al., 2009). A full list of countries where X.citri pv. citri is known to be present is documented later in this Appendix. The pathogen is present in or has occurred and been eradicated from a number of major exporters of sweet orange to the EU. These include Argentina, Australia, Brazil, USA and Uruguay. The European Commission recognises certain countries as being free from X.citri pv. citri (Anon 2006; 2013). A summary of these countries is given below (Table A.4.01).
www.efsa.europa.eu/publications
198
EFSA Supporting publication 2016:EN-1062
The present document has been produced and adopted by the bodies identified above as authors. This task has been carried out exclusively by the authors in the context of a contract between the European Food Safety Authority and the authors, awarded following a tender procedure. The present document is published complying with the transparency principle to which the Authority is subject. It may not be considered as an output adopted by the Authority. The European Food Safety Authority reserves its rights, view and position as regards the issues addressed and the conclusions reached in the present document, without prejudice to the rights of the authors.
Quantitative Pathway Analysis QPAFood
Table A.4.01: Countries accepted as being free from X. citri pv. citri (EC Decision 2006/473) Continent
Africa
Central and South America and the Caribbean
Countries free from X. citri pv citri
all citrus-growing third countries in Europe, Algeria, Egypt, Israel, Libya, Morocco, Tunisia and Turkey South Africa, Gambia, Ghana, Guinea, Kenya, Sudan, South Sudan*,Swaziland and Zimbabwe the Bahamas, Belize, Chile, Colombia, Costa Rica, Cuba, Ecuador, Honduras, Jamaica, Mexico, Nicaragua, Peru, the Dominican Republic, Saint Lucia, El Salvador, Surinam and Venezuela
Central and South America and the Caribbean
Oceania Oceania
Countries with limited distribution of X. citri pv citri
Regions where X. citri pv citri is known to be absent
Brazil
Regions where X. citri pv citri is known to be present
States of Rio Grande do Sul, Santa Catarina, Paraná, São Paulo, Minas Gerais, Maranhão*, Mato Grosso*, Mato Grosso do Sul and Roraima* Departments of Salto, Rivera and Paysandu — north of River Chapicuy
Uruguay
New Zealand Australia
US
New South Wales, South Australia and Victoria Arizona, California, Guam, Hawaii, Louisiana, Northern Mariana Islands, Puerto Rico, American Samoa, Texas and the United States Virgin Islands
A.5 Pathogen life cycle: X. citri pv. citri
X. citri pv. citri enters the plant tissue primarily through stomata and wounds caused by insects, wind-driven rain and orchard management operations. Minimum and maximum temperatures for multiplication in plant www.efsa.europa.eu/publications
199
EFSA Supporting publication 2016:EN-1062
The present document has been produced and adopted by the bodies identified above as authors. This task has been carried out exclusively by the authors in the context of a contract between the European Food Safety Authority and the authors, awarded following a tender procedure. The present document is published complying with the transparency principle to which the Authority is subject. It may not be considered as an output adopted by the Authority. The European Food Safety Authority reserves its rights, view and position as regards the issues addressed and the conclusions reached in the present document, without prejudice to the rights of the authors.
Quantitative Pathway Analysis QPAFood
tissue are 12 and 40 °C, respectively, with the most favourable temperature range being 25-35 °C (Dalla Pria et al., 2006). Latent infections may occur below the minimum temperature, but above 5°C, for multiplication. These may become active when both the temperature and growth stage of the plant are favourable for disease development (Peltier, 1920). At temperatures favourable for disease development (25-35°C), the length of the latent period ranges from a few days to a week (depending on host, wound availability and inoculum pressure), while it increases at lower temperatures. There are no data on the latent period length on fruit, although, again, it is dependent on temperature and is likely to be in a similar range to that on leaves. Disease severity increases with the duration of leaf wetness and the presence of wounds. Mining by larvae of the Asian leaf miner causes extensive leaf damage which allows ready acess by the pathogen and is, therefore, highly conducive to disease development. Providing the temperature is in the optimum range X. citri pv. citri will readily exude from canker lesions during wet periods, providing inoculum for further infection (Timmer et al., 1991; Pruvost et al., 2002), the severity of which increases with increasing duration of leaf wetness (Dalla Pria et al., 2006). In orchards, infections occur and spread rapidly at warm temperatures, with prolonged rain or overhead irrigation, when trees are in a susceptible stage of development for infection to occur. This is normally during the periodic growth flushes and when fruit is in early active development. Storms severe enough to cause damage to leaves and fruit facilitate spread of infection as does wounding by insects In particular subepidermal galleries created by the Asian citrus leafminer, enhance infection (Gottwald et al., 1997; Christiano et al., 2007; Gottwald et al., 2007). Resistance of leaves, stems and fruit increases with tissue age (Stall et al., 1982; Vernière et al., 2003). Leaves are most susceptible to stomatal infections when half to two-thirds expanded (Graham et al., 2004) but can be infected at all stages of development when the leaf tissue is damaged. Fruit also is not susceptible to infection in the absence of wounds when fully mature. Bacterial multiplication and spread is also determined by plant resistance. Spread in grapefruit orchards is rapid under conducive environmental condition because grapefruit is highly susceptible to X. citri pv. citri. Spread is also rapid in the susceptible sweet orange cultivars Hamlin, Navel and Pineapple which are the most susceptible sweet orange varieties. Infection and spread among other less susceptible sweet orange varieties is lower when plants are uninjured. Following pressurised spray inoculation, undamaged fruit is susceptible to infection 60-90 days after fruit set when fruit size is in the range of 20-40mm diameter. However, wound inoculation of sweet orange cv. Pineapple fruit has been shown to be successful over a period of 120-150 days (Graham et al., 1992; Vernière et al., 2003). Both older fruit (>60mm diameter) and very young fruit (300g. For Class I fruit packed loose the categories are 70 – 135g, 136 – 300g and > 300g. Based on these categories, it is reasonable to estimate that imported apples will weigh a minimum of 70g, most likely around 150g and have a maximum weight of over 300g. An import of 100,000 apples could therefore range in weight from 7 tonnes (minimum) to over 30 tonnes (maximum). Within this 22 infested apples could weigh between 1.54 kg (min) and over 6.6 kg (max).
10 11
http://www.usapple.org/index.php?option=com_content&view=article&id=179&Itemid=285 http://www.agmrc.org/commodities__products/fruits/apples/commodity-apple-profile/
www.efsa.europa.eu/publications
223
EFSA Supporting publication 2016:EN-1062
The present document has been produced and adopted by the bodies identified above as authors. This task has been carried out exclusively by the authors in the context of a contract between the European Food Safety Authority and the authors, awarded following a tender procedure. The present document is published complying with the transparency principle to which the Authority is subject. It may not be considered as an output adopted by the Authority. The European Food Safety Authority reserves its rights, view and position as regards the issues addressed and the conclusions reached in the present document, without prejudice to the rights of the authors.
Quantitative Pathway Analysis QPAFood
Contribution to model input parameters
Likelihood of infestation at harvest In studies by Agnello et al. over 4 years, at least 50% of orchards studied had no damage from internal Lepidoptera each year (mean value over 4 years is 74% ((8/16)+(6/16+(7/16)+(2/16))/4). Standard grower practice resulted in mean infestation of 0.11% ((0.27+0.11+0.02+0.02)/4). Hence possible input parameter has a probability distribution function (pdf) with 50% (or 74%) being 0 and the remaining % having a mean of 0.11% However, this would represent the likelihood of a harvested apple being infested by one of three species. Two of which are more abundant than the case study pest. If all Lepidoptera were equally abundant one could divide the above likelihood by 3. (0.11% / 3 = 0.0366%). This would still overestimate the likelihood of infestation by C. prunivora. Assuming only 20% of any infestation was due to C. prunivora would seem reasonable, hence divide 0.11% by 5 (0.11/5= 0.022%). 74% with infestation of zero and 26% with average infestation of 0.022% gives a mean infestation rate of (0.74 x 0) + (0.26 x 0.00022) = 0.0000572 (this is the mean not the most likely). Note that Minimum is zero and most likely is also zero. The max was 0.27 /500 = 0.00054. This may be a bit extreme and a lower max of 0.000342 also gives a distribution mean close to the calculated value. This gives the graph below, in which about 60% of the distribution fall below the calculated mean
This is not the same as 70% zero but then arguably, ‘no damage’ actually means no damage detected, so very low non-zero values may be more realistic.
B.6 Harvesting, sorting and storing apples Apples should be hand-picked by trained pickers that can recognise and pick only marketable fruit and who avoid inferior fruit. Apples infested with C. prunivora show symptoms that are usually visible to the naked www.efsa.europa.eu/publications
224
EFSA Supporting publication 2016:EN-1062
The present document has been produced and adopted by the bodies identified above as authors. This task has been carried out exclusively by the authors in the context of a contract between the European Food Safety Authority and the authors, awarded following a tender procedure. The present document is published complying with the transparency principle to which the Authority is subject. It may not be considered as an output adopted by the Authority. The European Food Safety Authority reserves its rights, view and position as regards the issues addressed and the conclusions reached in the present document, without prejudice to the rights of the authors.
Quantitative Pathway Analysis QPAFood
eye (CABI, CPC 2012) and hence will avoid being harvested. Efficient producers do the absolute minimum of sorting once the fruit is picked as this is both inefficient and costly and can increase bruising tremendously. Fruit quality is preserved if fruit is immediately cooled after harvest (Wilson, 2009). Size grading is generally performed mechanically. If grading is performed by hand, gaging rings or gaging boards are used. Dessert apples are divided into three quality classes: extra (minimum diameter 65 mm), I (minimum diameter 60 mm) and II (minimum diameter 55 mm) (GDV, 2014). Apples may be successfully kept in storage for a few weeks to several months, almost up to a year. Bates et al. (2001) report that there are three types of storage buildings for apples: air cooled storage, mechanically refrigerated storage and refrigerated storage with controlled-atmosphere. Only the highest quality dessert apples destined for the fresh market are placed in controlled-atmosphere storage which is expensive to operate. To maintain their high quality, it is extremely important that apples are picked at the proper stage of maturity (Bates et al., 2001). For long-term storage in a controlled atmosphere with low oxygen, fruit is usually picked slightly less mature to maximize storage success (Wilson, 2009). Depending on the cultivar, apples stored in cold storage are held at between 1°C and 4°C. If stored within controlled atmospheric conditions, the modified atmosphere will consist of 2 to 3% oxygen and 1 to 4% carbon dioxide, and at a reduced temperature although the exact specifications are adjusted to the cultivar being stored (GDV, 2014). Apples can maintain quality under these conditions for 4 to 6 months. Apples can be stored for several months in controlled-atmosphere chambers. High concentrations of CO2 are used in the air to prevent ethylene concentrations from rising which would induce ripening. When removed from storage ripening continues (Anon., 2007). Some apple varieties can be stored for up to a year without significant degradation (Yepsen, 1994; Food Science Australia, 2005). Most apples for processing result from discards of the fresh fruit harvest and collecting apples for processing is mainly thought of as a salvage operation. The amount of apples available to process is largely dependent on the size of the fresh market harvest and its quality. Consequently, processing apples are harvested and stored in the same manner as premium, fresh market apples (Bates et al., 2001). B.7 Apples for export Within EU phytosanitary legislation, apple fruit from outside the EU are regulated articles subject to the EC Plant Health Directive (Anon., 2000). The EC Plant Health Directive uses the synonym Enarmonia prunivora Walsh, in Annex II/ A I for Cydia prunivora. This means that the organism is regarded as a harmful organism whose introduction into, and spread within, all Member States shall be banned if present on plants of Crataegus L., Malus Mill., Photinia Ldl., Prunus L. and Rosa L., intended for planting, other than seeds, and fruit of Malus Mill. and Prunus L., originating in non- European countries. Before export, apple fruit from Third Countries must be inspected and found free of quarantine pests, specifically Grapholita packardi (cherry fruit worm), Rhagoletis pomonella (apple maggot), Tachypterellus quadrigibbus (apple curculio) and Monilinia fructiciola (brown rot). Interestingly Enarmonia (=Cydia) prunivora is not specifically mentioned although, as a quarantine pest, apple fruit would still have to be found free from it in order to satisfy export to the EU. If consignments are free from quarantine pests, then a phytosanitary certificate can be issued for export to the EU. As noted by GDV (2014) the quarantine regulations of the country of destination (in this case the EU) must be complied with and a phytosanitary certificate will be required for apples from the USA or Canada (or any other Third Country) with the enclosed with the shipping documents. ISPM No. 31 on sampling of consignments, provides guidance as to how many lots (e.g. boxes of fruit), are to be sampled within a consignment depending on the size of the consignment (i.e. how many lots), the degree of pest infestation (5%, 2%, 1%, 0.5% and 0.1%) and the level of confidence required (80%, 90%, 95% or 99%). Sampling size increases as the level of infestation lowers and the confidence required increases. Imported (and home produced) fruit and vegetables are subject to EU Marketing Standards which align with United Nations Economic Commission for Europe (UNECE) standards. Specific European Union marketing standards exist for apples and pears. The standards may be found in EU Commission Regulation 543/2011 www.efsa.europa.eu/publications
225
EFSA Supporting publication 2016:EN-1062
The present document has been produced and adopted by the bodies identified above as authors. This task has been carried out exclusively by the authors in the context of a contract between the European Food Safety Authority and the authors, awarded following a tender procedure. The present document is published complying with the transparency principle to which the Authority is subject. It may not be considered as an output adopted by the Authority. The European Food Safety Authority reserves its rights, view and position as regards the issues addressed and the conclusions reached in the present document, without prejudice to the rights of the authors.
Quantitative Pathway Analysis QPAFood
and UNECE (2013). Freshfell Europe (2011) provides a summary of EU marketing standards for apple. In summary, fresh apples are required to be checked for conformity with EU marketing standards for quality and labelling. Apples must be “practically free from pests”. “Practically free” is a recognised phytosanitary term used by IPPC and defined in ISPM No. 5 as …”Of a consignment, field or place of production, without
pests (or a specific pest) in numbers or quantities in excess of those that can be expected to result from, and be consistent with, good cultural and handling practices employed in the production and marketing of the commodity”. Such quality checks in an exporting country could lead to apples being rejected for export to the EU as a conformity certificate is required for all fresh produce shipments destined for the fresh market. Contribution to model input parameters
Likelihood of avoiding detection during harvest and export checks No studies have been found that quantify the likelihood of pickers detecting infested fruit but apples infested with C. prunivora show symptoms that are usually visible to the naked eye (CABI, CPC 2012) and hence will avoid harvesting them for export.
Conclusion: An estimate of the likelihood of infested fruit escaping detection and proceeding along the
pathway is needed. Given trained pickers are used, fruit is then graded then inspected by NPPO officials to certify fruit meets export quality, and all the while symptoms are visible to the naked eye, is it reasonable to assume that only infestation at most below 0.5% remains undetected. Hence assuming mean infestation was 0.022%, export checks do not reduce the level of infestation (to detect 0.1% infestation with 95% confidence, 950 of 1000 lots would need to be sampled!)
B.8 Shipping apples Apples are shipped at the preclimacteric stage (tree or picking ripe). Apples are transportable if free from spoilage, damage, bruises and abnormal moisture. In addition, they must be practically free from diseases and pests. They may be stored for up to 6 months, depending on variety and degree of ripeness. Where controlled atmosphere transport is used, transport and storage duration may be extended to approx. 8 months. Apples are transported in crates and cartons. Jointed boxes are made from resin-free wood (standard softwood boxes), to prevent odour tainting. Package weight and dimensions are generally very variable (GDV, 2014). Once packed, apples are transported via ship, aircraft, truck and rail. During transport, apples need cool, dry and good ventilation. A written cooling order must be obtained from the consignor before loading is begun. This order must always be complied with during the entire transport chain (GDV, 2014). The temperature at which apples are shipped varies according to apple variety (Table B.8.01) (Anon., 2006). Table B.8.01: Transport conditions for fresh apples (Source: Anon., 2006) Apple type
Maximum storage, transit and shelf life (days)
Optimum transit temperature (°C)
Relative humidity
Non-chill sensitive varieties
90-240
-1.1 to +1.0
90-95%
Chill sensitive varieties
35-45
+1.5 to 4.5
90-95%
www.efsa.europa.eu/publications
226
EFSA Supporting publication 2016:EN-1062
The present document has been produced and adopted by the bodies identified above as authors. This task has been carried out exclusively by the authors in the context of a contract between the European Food Safety Authority and the authors, awarded following a tender procedure. The present document is published complying with the transparency principle to which the Authority is subject. It may not be considered as an output adopted by the Authority. The European Food Safety Authority reserves its rights, view and position as regards the issues addressed and the conclusions reached in the present document, without prejudice to the rights of the authors.
Quantitative Pathway Analysis QPAFood
B.9 Survival of case study pest during cold storage and shipping 56 days cold storage (2.0 ± 0.2°C) of apples infested with C. prunivora eggs at three stages of development resulted in complete mortality (Neven, 2004). Time-mortality responses for the three developmental stages of eggs are and shown below (Table B.9.01). Table B.9.01: Time–mortality response of three egg stages of C. prunivora, oviposited on apple and exposed to low temperatures (2.0 ± 0.2°C) Source: Neven (2004) Egg stage
N
LT90 (95% FL)
LT99 (95% FL)
1
3,307
23.2 (23.1 - 23.2)
39.4 (39.3 – 39.6)
2
5,226
20.4 (20.4 - 20.5)
44.2 (44.1 – 44.4)
3
4,255
24.8 (24.7 - 24.8)
51.9 (51.8 – 52.1)
Cold treatment of at least 55 days at 2.0 ± 0.2°C, an accepted regime to control C. pomonella eggs for postharvest control of codling moth on apples destined for export markets (Moffitt, 1988; Hansen, 2002), should be an effective treatment for postharvest control of C. prunivora eggs on apples (Neven, 2004). Neven (2004) also reported the results of time-mortality responses by C. prunivora larvae (Table B.9.02) Table B.9.02: Time–mortality response of C. prunivora larval instars developing in apple and exposed to low temperatures (2.0 ± 0.2°C) Source: Neven (2004) Larval instar
N
LT90 (95% FL)
LT99 (95% FL)
st
1,129
11.2 (11.1 – 11.4)
46.0 (44.8 – 47.3)
nd
1,414
37.3 (37.2 – 37.5)
62.4 (61.9 – 62.8)
rd
743
37.0 (37.7 – 38.4)
56.5 (55.7 – 57.3)
th
1,078
71.5 (70.2 – 72.9)
235.7 (226.5 – 245.7)
1 2
3
4
In discussing her results, Neven (2004) suggests that C. prunivora larvae are more cold tolerant than larvae of C. pomonella. Assuming that apples are shipped using cold storage, 100% of C. prunivora eggs on apples held in cold storage for 55 days will suffer mortality (Table A2.9.01). 1st, 2nd and 3rd instar larvae held in cold storage for 55 days will also suffer great mortality (Table A2.9.02). However, the duration that North American apples are held in cold storage for, before reaching Europe, is unknown. Following harvest one imagines there will be at least 2 or 3 days required before being loaded into a shipping container. Container-ships can cross the Atlantic in 12 to 15 days. There is also going to be at least 2 or 3 days required in Europe before emerging from storage. Thus the minimum time in cold storage is assumed to be 16 days, but apples are probably held in store for much longer as they store very well for extended periods. It is not unreasonable to assume that apple varieties that are not sensitive to chilling will be in cold storage for 90 days (Table A2.8.01), sufficient to kill all 1st to 3rd instar larvae and 90% of 4th instar larvae. Contribution to model input parameters An estimate of the likelihood of infested fruit remaining infested after shipping is needed. A conservative estimate would be to assume apples are in cold storage for 40 days, during which 99% of stage 1 eggs will suffer mortality and at least 90% of stage 2 and stage 3 eggs will suffer mortality (Table A2.9.01). More than 90% of eggs that hatch will die as 1st instar larvae (Table A2.9.02). 90% of 2nd and 3rd instar larvae already in the apple fruit will also die after 40 days in cold storage.
www.efsa.europa.eu/publications
227
EFSA Supporting publication 2016:EN-1062
The present document has been produced and adopted by the bodies identified above as authors. This task has been carried out exclusively by the authors in the context of a contract between the European Food Safety Authority and the authors, awarded following a tender procedure. The present document is published complying with the transparency principle to which the Authority is subject. It may not be considered as an output adopted by the Authority. The European Food Safety Authority reserves its rights, view and position as regards the issues addressed and the conclusions reached in the present document, without prejudice to the rights of the authors.
Quantitative Pathway Analysis QPAFood
Conclusion: A conservative estimate is that 90% of fruit that were infested remain infested after 40 days. B.10 Export of apples from USA and Canada FAO Statistics 12 indicate that apple exports from the USA to the EU have been in decline, both in real terms, and as a percentage of all apple exports e.g. for the four most recent years for which data are available (2008 – 2011), US apple exports fell from 40,068 tonnes in 2008 (5.1% of US apple exports) to 11,598 tonnes in 2011 (1.2% of US apple exports that year). Over the same period, Canadian apple exports fell from 2,742 tonnes (6.4% of CA apple exports) to 1,593 tonnes (also 6.4% of apple exports in 2011). Eurostat showed showed a further decline in imports from the USA and Canada in 2014 at 9,005 and 180 tonnes, respectively. 11 F
So as to inhibit the introduction of harmful organisms, the EU requires that 100% of imported consignments of many plant products undergo phytosanitary inspection upon arrival in the EU unless the plant products qualify for reduced inspection levels. US apples are eligible for a reduced level of inspection. Work to justify reduced inspection began in 2004. Dossiers were prepared that examined the previous three years trading history of specific commodities with the volume of commodity and inspection record being taken into account, in addition the quarantine pests potentially carried on the pathway were also taken into account. Appendix 1 shows the dossier prepared for apples from the USA. To qualify for reduced inspections, an average of at least 200 consignments had to be shipped into the EU each year over the previous 3 years. At a European Commission Plant Health Working Group on Reduced Plant Health Checks meeting (June 2014) it was agreed that the inspection of consignments of apples from USA should remain at 50%. Thus each EU Member State must inspect between 50% and 100% of the apple consignments imported from the USA each year. Due to the low level of apple consignments from Canada, Canadian apples are not subject to a reduced rate of inspection and 100% of Canadian apple consignments must be inspected. Imported apples are also subject to EU Marketing Standards. Specific European Union marketing standards exist for apples and pears. The standards may be found in EU Commission Regulation 543/2011. Freshfell Europe (2011) provides a summary of EU marketing standards for apple. Fresh apples are required to be checked for conformity with EU marketing standards for quality and labelling. Apples must be “practically free from pests”. Such quality checks could lead to apples being rejected for import to the EU. A conformity certificate is required for all fresh produce shipments destined for the fresh market. Importers can obtain these certificates at the point of import. B.11 International trade statistics Goods that are imported (and exported) have to be declared for customs duty purposes. Goods, including imported fruit, are declared using a numerical coding system. The World Customs Organization operates a global coding system referred to as the Harmonized System (HS). Within Europe the EU follows the HS system but also includes further subdivisions, hence the system within the EU has a different name and is referred to as Combined Nomenclature (CN). CN codes comprise of up to eight digits and a text description. Appendix 2 lists the 28 categories in which fresh apples can be described. Apart from a few major products, international trade classifications do not provide a detailed classification of processed products according to the primary commodity used in its preparation, thus only fresh imported apple fruit can be identified using CN codes. B.12 Seasonality of apple imports from North America Traditionally apples from Canada have been available in Europe all year round (FPJ, 2010) although there are seasonal peaks and troughs (see Eurostat trade data) and not all varieties are available during all months (Table B.12.01). For example, cv Paula Red and cv Gala have short seasons of 2 months (August & September and September & October respectively), whilst cv Spartan is available 11 months of the year, i.e. all months except August (FPJ, 2010). 12
http://faostat3.fao.org/download/T/*/E
www.efsa.europa.eu/publications
228
EFSA Supporting publication 2016:EN-1062
The present document has been produced and adopted by the bodies identified above as authors. This task has been carried out exclusively by the authors in the context of a contract between the European Food Safety Authority and the authors, awarded following a tender procedure. The present document is published complying with the transparency principle to which the Authority is subject. It may not be considered as an output adopted by the Authority. The European Food Safety Authority reserves its rights, view and position as regards the issues addressed and the conclusions reached in the present document, without prejudice to the rights of the authors.
Quantitative Pathway Analysis QPAFood
Table B.12.01: Availability of Canadian apple varieties through the year (Source: FPJ 2010) Apple variety
J
F
M
A
M
J
J
A
S
Ambrosia Empire
Gala Golden Delicious
Honeycrisp Idared Jonagold McIntosh Red
Paula Red
Red Delicious Spartan
O
N
D
The seasonality of apples from the USA is similar to that from Canada, although there are a greater range of varieties, some of which are available 12 months of the year (Table B.12.02). Table B.12.02: Availability of apple varieties from the USA through the year (Source: FPJ 2010) Apple variety
J
F
M
A
M
J
J
Braeburn
Cameo
Cripps Pink
Criterion
Elstar
Empire
Fuji
Gala
Ginger Gold
A
S
O
N
D
Golden Delicious
Granny Smith
Honeycrisp
Jonagold
Jonathan
McIntosh Red
Newton Pippin www.efsa.europa.eu/publications
229
EFSA Supporting publication 2016:EN-1062
The present document has been produced and adopted by the bodies identified above as authors. This task has been carried out exclusively by the authors in the context of a contract between the European Food Safety Authority and the authors, awarded following a tender procedure. The present document is published complying with the transparency principle to which the Authority is subject. It may not be considered as an output adopted by the Authority. The European Food Safety Authority reserves its rights, view and position as regards the issues addressed and the conclusions reached in the present document, without prejudice to the rights of the authors.
Quantitative Pathway Analysis QPAFood
Pink Lady
Red Delicious
Rome Beauty
Spartan
Winesap
B.13 Consignment sizes Whilst it is relatively straight forwards to collect statistics regarding import volumes, the size of individual consignments is not readily available. However, for consignments that are inspected and generate a notification of non-compliance on Europhyt, a web-based network specifically concerned with plant health information operated by the European Commission and Member States, an indication of consignment size is available. All records regarding any notification of non-compliance for imports of fresh apples January 1998 – November 2014 were extracted from EUROPHYT. Over this period there were 193 records associated with apples imported from 19 different Third countries (Argentina, Brazil, Canada, Chile, China, Iran, Japan, Korea, Lebanon, New Zealand, Pakistan, South Africa, Syria, Thailand, Tunisia, Turkey, United States of America, Uruguay and Vietnam). Of the 193 records, 185 provided information regarding the consignment weight in kg. Where the weight was not expressed in kg, units such as the number of boxes were given. Figure A2.13.01 shows the frequency distribution of consignment size for apple imports 1998-2014.
www.efsa.europa.eu/publications
230
EFSA Supporting publication 2016:EN-1062
The present document has been produced and adopted by the bodies identified above as authors. This task has been carried out exclusively by the authors in the context of a contract between the European Food Safety Authority and the authors, awarded following a tender procedure. The present document is published complying with the transparency principle to which the Authority is subject. It may not be considered as an output adopted by the Authority. The European Food Safety Authority reserves its rights, view and position as regards the issues addressed and the conclusions reached in the present document, without prejudice to the rights of the authors.
Quantitative Pathway Analysis QPAFood
Figure B.13.01: Frequency distribution of consignment size of apple (fresh fruit) imports into the EU (Data derived from Europhy notifications of non-complance Jan 1998 – Dec 2014). N = 181 (all sources). Consignments from USA or Canada also shown (black columns) (n = 11)
Table B.13.01 shows the frequency of consignment sizes in more detail. Table B.13.01: Frequency of apple fruit consignment size Consignment size (tonnes)
Frequency of consignment size all Third Countries (%)
Frequency of consignment size USA and Canada (%)
0°C, leaf emergence on the main shoot (requiring around 122 DD>0°C per leaf), root development and formation of tillers. Completion of this phase requires a total period of around six months and ~1,200DD>0°C from sowing. Stem elongation and storage continue throughout the following two month Construction Phase and in this period ear formation also begins. A thermal time of 2,100 DD>0°C from sowing is required to complete the phase. In the Production Phase, the final phase of the life cycle of wheat, flowering begins, followed by grain filling and ripening. The duration of all three phases requires a total of around 3,100>0°C from sowing in October of the previous year to harvesting around July/August. In southern Europe the life cycle is shortened and harvesting takes place as early as April/May. Trnka et al (2014a, b) provide data on key phenological stages in the growth of European wheat for 14 locations from northern to southern Europe showing a progressively later sowing date, a tendency to earlier anthesis and earlier maturity moving from north to south. Table A4.16.01 shows the sowing and harvest periods of winter wheat at the same or closely located meteorology stations as used by Trnka et al (2014a, b) in north, central and southern Europe. Table 9 also shows degree days above the threshold of 10°C (DD>10°C) at these sites (BizEE 2015), above which development of L. bonariensis is possible. This shows a progressively increasing annual total DD>10°C from 727DD>10°C in Finland to 3,228 DD>10°C at Seville in southern Spain for 2014. L. bonariensis requires between 360 DD>10°C (Ferguson et al. 1996) and 454 DD>10.2°C (Barker, 1988) to complete its life cycle on perennial ryegrass (Lolium perenne) in New Zealand, implying that establishment may be possible in the central and southern states of Europe. www.efsa.europa.eu/publications
294
EFSA Supporting publication 2016:EN-1062
The present document has been produced and adopted by the bodies identified above as authors. This task has been carried out exclusively by the authors in the context of a contract between the European Food Safety Authority and the authors, awarded following a tender procedure. The present document is published complying with the transparency principle to which the Authority is subject. It may not be considered as an output adopted by the Authority. The European Food Safety Authority reserves its rights, view and position as regards the issues addressed and the conclusions reached in the present document, without prejudice to the rights of the authors.
Quantitative Pathway Analysis QPAFood
Table D.16.01: Sowing dates (blue cells), harvest dates (green cells) and monthly Degree Days above 10°C (DD .10°C) for sites in northern, central and southern Europe. Sources: Adapted from Trnka et al (2014b, supplementary table 3). Degree Days from BizEE, 2015
Locality
Degree days (DD) per month 2014
Site
Country
Latitude
Longitude
Mar
Apr
May
Jun
Jul
Aug
Sep
Oct
Nov
Dec
Jan
Feb
Jyväskylä Uppsala Tylstrup Warsaw Amsterdam London Mannheim Vienna Debrecen ClermontFerrand Montagnano Madrid Athens Seville
Finland Sweden Denmark Poland Netherlands UK Germany Austria Hungary
62.4N 59.90N 57.19N 52.22N 52.30N 51.48N 49.46N 48.11N 47.49N
25.68E 17.6E 9.95E 21.02E 4.77E 0.46W 8.55E 16.57E 21.6E
0 3 4 28 28 36 53 50 57
12 22 35 99 75 68 132 94 111
87 78 77 191 121 122 165 153 198
99 112 152 239 181 216 287 276 310
290 292 287 399 300 309 350 355 376
179 204 181 310 199 204 254 276 334
58 85 128 190 197 201 210 181 226
2 25 67 84 111 125 128 181 102
0 3 9 13 16 29 14 101 28
0 0 0 1 5 11 2 25 0
0 0 0 0 2 6 5 5 0
0 0 0 0 0 0 0 0 2
Total DD 727 824 940 1,554 1,235 1,327 1,600 1,697 1,744
France
45.79N
3.15E
51
87
134
285
288
252
211
160
50
6
12
4
1,540
Italy Spain Greece Spain
43.46N 40.44N 37.94N 37.42N
11.85E 3.59W 23.94E 5.89W
58 86 93 140
107 182 156 251
193 244 297 370
332 361 426 416
366 449 515 479
367 474 535 510
254 335 384 397
193 240 250 343
69 59 132 167
16 31 86 48
5 36 49 50
6 16 43 57
1,966 2,513 2,966 3,228
www.efsa.europa.eu/publications
295
EFSA Supporting publication 2016:EN-1062
The present document has been produced and adopted by the bodies identified above as authors. This task has been carried out exclusively by the authors in the context of a contract between the European Food Safety Authority and the authors, awarded following a tender procedure. The present document is published complying with the transparency principle to which the Authority is subject. It may not be considered as an output adopted by the Authority. The European Food Safety Authority reserves its rights, view and position as regards the issues addressed and the conclusions reached in the present document, without prejudice to the rights of the authors.
Quantitative Pathway Analysis QPAFood
D.17 Processing mills Within the EU, business activities are classified according to the Nomenclature of Economic Activities code (in French, named Nomenclature statistique des activités économiques dans la Communauté européenne – leading to the codes commonly being referred to as NACE codes). The EU NACE codes align with the UN International Standard Industrial Classification (ISIC) system. Like CN import codes, NACE and ISIC codes have a hierarchical, top-down structure that begins with general characteristics and narrows down to the specifics. The first two digits of the code represent the major industry sector to which a business belongs. The third and fourth digits describe the sub-classification of the business group and specialization, respectively. Statistics produced on the basis of NACE are comparable at European level and, in general, at world level (Eurostat European Commission, 2008). The codes used to describe business activities are listed in the most recent version of the NACE codes in Eurostat European Commission (2008). The NACE code used to identify businesses involved in the manufacturing of grain mill products, including wheat flour mills is C10.6.1. Note however that this code also includes other types of milling and grain processing (section D.25). The numbers of manufacture of all grain mill products in each MS is shown in Table D.17.01. Table D.17.01: Number of business enterprises recorded as “Manufacturers of grain mill products” Source: Eurostat NACE_R2 Annual detailed enterprise statistics for industry (NACE Rev. 2, B-E) [sbs_na_ind_r2]
EU total
5,744
Italy
992
Belgium
68
Romania
776
Lithuania
68
Poland
632
Finland
66
Germany
544
Slovenia
38
Spain
490
Latvia
22
France
477
Denmark
17
Greece
287
Estonia
16
Portugal
232
Cyprus
7
Bulgaria
135
Luxembourg
2
Hungary
129
Czech Republic
Austria
122
Ireland
Confidential *
Sweden
114
Malta
Confidential *
Netherlands
102
Slovakia
Confidential *
Croatia
100
United Kingdom
Confidential *
no data *
*See Table D.17.02 For EU Member States where data are given, the sum of enterprises is 5,436. The total for the EU (28) is given as 5,744 suggesting that 308 mills are distributed across CZ, MT, SL, UK and IE. To estimate the number of manufacturers of grain mill products in the five EU MS where no data were provided by EuroStat (Czech Republic, Ireland, Malta, Slovakia & United Kingdom) the relationship between
www.efsa.europa.eu/publications
296
EFSA Supporting publication 2016:EN-1062
The present document has been produced and adopted by the bodies identified above as authors. This task has been carried out exclusively by the authors in the context of a contract between the European Food Safety Authority and the authors, awarded following a tender procedure. The present document is published complying with the transparency principle to which the Authority is subject. It may not be considered as an output adopted by the Authority. The European Food Safety Authority reserves its rights, view and position as regards the issues addressed and the conclusions reached in the present document, without prejudice to the rights of the authors.
Quantitative Pathway Analysis QPAFood
mean annual cereal production and number of manufactures of grain mill products for the 23 other EU MS was examined (Figure D.17.01).
Note Log scales Source: Annual detailed enterprise statistics for industry (NACE Rev. 2, B-E) [sbs_na_ind_r2] Figure D.17.01: Number of manufacturers of grain mill products vs production of cereals (5 year mean) Assuming that the relationship indicated in Figure D.17.01 (r2 = 0.6679) holds for the Czech Republic, Ireland, Malta, Slovakia & United Kingdom, then we can use this to estimate the number of manufacturers of grain mill products in these countries, and apportion the estimates so as to sum to 308 (the number required in order that the sum of EU MS business enterprises recorded as Manufacturers of grain mill products equals 5,436 across the EU 28) (Table D.17.02). This then provides the data to complete (Table D.17.021).
www.efsa.europa.eu/publications
297
EFSA Supporting publication 2016:EN-1062
The present document has been produced and adopted by the bodies identified above as authors. This task has been carried out exclusively by the authors in the context of a contract between the European Food Safety Authority and the authors, awarded following a tender procedure. The present document is published complying with the transparency principle to which the Authority is subject. It may not be considered as an output adopted by the Authority. The European Food Safety Authority reserves its rights, view and position as regards the issues addressed and the conclusions reached in the present document, without prejudice to the rights of the authors.
Quantitative Pathway Analysis QPAFood
Table D.17.02: Estimated number of manufacturers of grain mill products for 5 EU MS where EuroStat data were not available EU MS
Czech Republic
7,421
115
Manufacturers apportioned in same ratio to sum to 308 68
Ireland
2,228
34
20
0
0
0
3,209
50
30
320
190
sum 519
308
Malta Slovakia United Kingdom
Mean cereal production 2009-2013 (‘000 tonnes)
Estimated number of manufacturers of grain mill products
20,717
Although the number of manufacturers of grain mill products is 5,436 across the EU 28, the European Flour Mill Association suggests there are approximately 3,800 milling companies 19 18F
An alternative method of determining the distribution of wheat processing sites across the EU was also explored by reviewing information provided by the European Flour Millers Association (www.flourmillers.eu), trade directories (https://companylist.org, http://www.europages.co.uk) and direct contact with MS government statistical services. Such data collection is limited to finding larger companies listed in trade directories and registered with trade organisations and the numbers are consequently lower than those reported by Eurostat. Figure D.17.02 plots the larger flour mills in each Member State located in the NUTS regions of each country together with the main grain handling ports. Information on EU grain handling ports was obtained from the Eurostat database (Eurostat/database by themes/maritime transport/goods/quarterly data –main ports).
19
http://www.flourmillers.eu/page/facts-figures-flour-milling-industry/
www.efsa.europa.eu/publications
298
EFSA Supporting publication 2016:EN-1062
The present document has been produced and adopted by the bodies identified above as authors. This task has been carried out exclusively by the authors in the context of a contract between the European Food Safety Authority and the authors, awarded following a tender procedure. The present document is published complying with the transparency principle to which the Authority is subject. It may not be considered as an output adopted by the Authority. The European Food Safety Authority reserves its rights, view and position as regards the issues addressed and the conclusions reached in the present document, without prejudice to the rights of the authors.
Quantitative Pathway Analysis QPAFood
Figure D.17.02: Location of major flour mills and grain handling ports in EU MS
www.efsa.europa.eu/publications
299
EFSA Supporting publication 2016:EN-1062
The present document has been produced and adopted by the bodies identified above as authors. This task has been carried out exclusively by the authors in the context of a contract between the European Food Safety Authority and the authors, awarded following a tender procedure. The present document is published complying with the transparency principle to which the Authority is subject. It may not be considered as an output adopted by the Authority. The European Food Safety Authority reserves its rights, view and position as regards the issues addressed and the conclusions reached in the present document, without prejudice to the rights of the authors.
Quantitative Pathway Analysis QPAFood
D.18 Uses for wheat Total EU supply of wheat from 2010 to 2014 (Table D.18.01) has remained relatively constant at around 154 million tonnes with average import levels of around 5 million tonnes (3.34%). Of this supply approximately equal amounts were used for human consumption (36.3%) and animal feed (31.6%) with the remainder used for seed (3.4%) and feedstock for industrial purposes (6.8%). Use of wheat for bioethanol production accounted for around 41% of the total industrial usage. Table D.18.01: Total supply and usage of wheat in the EU 2010-2014 (‘000 mt) Source: EU Cereals Supply and Demand, European Commission, Directorate General for Agriculture and Rural development, Unit C5 Supply Beginning stocks Usable production
2010/11
% 2011/12
%
2012/13
%
2013/14
%
Mean
Mean %
16,115
10,334
11,364
9,385
11,800
135,065
137,737
132,127
143,054
136,996
Imports from third countries
4,497
7,123
5,250
3,724
5,149
3.34
Total
155,677
100.00
155,194
100.00
148,741
100
156,163
100
153,944
100
Human consumption
55,647
35.75
55,881
36.01
55,947
37.61
55,949
35.83
55,856
36.28
Animal feed
51,100
32.82
55,400
35.70
45,200
30.39
43,000
27.54
48,675
31.62
Industrial*
10,200
6.55
10,700
6.89
10,400
6.99
10,600
6.79
10,475
6.80
Seed
5,255
3.38
5,171
3.33
5,171
3.48
5,171
3.31
5,192
3.37
Losses
950
0.61
950
0.61
950
0.64
950
0.61
950
0.62
14.25
15,728
10.13
21,688
14.58
31,084
19.90
22,673
14.73
Domestic uses
Exports to third countries 22,191
Final stocks 10,334 6.64 11,364 7.32 9,385 6.31 9,409 6.03 10,123 6.58 *Includes production of bioethanol and other products at an average of circa 4.35 million Mt 2010-2014.
D.19 Processing activities Grain is shipped to wholesalers or directly to the processors where it is milled for food or animal feed or used for production of industrial products (starch, ethanol etc.) and a range of food additives. The major factors which determine whether wheat can be used for flour production are variety and quality. The variety and quality are checked before shipment, but the latter can deteriorate under sub-optimal storage conditions during shipping. If fungal growth is detected, or germination has occurred, the wheat is no longer suitable for flour production and must then be used for animal feed or for fermentation into alcohol by the brewing industry or bioethanol in an industrial process to produce fuel. Before unloading at the docks samples are taken to check for quality, uniformity and freedom from spoilage organism and quarantine pests and diseases. –X-rays are sometimes used to detect insect infestation. The wheat sample is then milled and baked to determine the end-use quality and identify the optimal handling procedures and storage conditions. The wheat batch is then stored in silos within controlled temperature, moisture and ventilation ranges to prevent sprouting and spoilage by growth of fungi. www.efsa.europa.eu/publications
300
EFSA Supporting publication 2016:EN-1062
The present document has been produced and adopted by the bodies identified above as authors. This task has been carried out exclusively by the authors in the context of a contract between the European Food Safety Authority and the authors, awarded following a tender procedure. The present document is published complying with the transparency principle to which the Authority is subject. It may not be considered as an output adopted by the Authority. The European Food Safety Authority reserves its rights, view and position as regards the issues addressed and the conclusions reached in the present document, without prejudice to the rights of the authors.
Quantitative Pathway Analysis QPAFood
Production of flour involves the following steps:
Cleaning Involves a number of procedures to remove foreign material. These include passage of the grain through:
magnetic separators to remove metallic objects
vibrating screens to remove debris which is either too big or small to be wheat
aspirators to remove dust and lighter impurities
de-stoners to remove stones and grit of equivalent size to wheat seeds
separators to eliminate anything else that is not the same size or shape as wheat seed
scourers to remove outer husks and dirt
These processes together will likely remove any insect pests not detected at inspection. Biological waste from the control and cleaning procedures is diverted for the production of animal feed with the remainder going to landfill.
Conditioning Involves addition of precise amounts of moisture to aid separation of the constituents of the kernel followed by centrifugation to break up unsound kernals and eliminate them from the milling process. The conditioned wheat is stored in bins for periods between 8 and 24 hours depending on the type of wheat (soft, medium or hard) and, if necessary, blended with other varieties to produce a specific type and quality of flour. At this point, high quality imported wheat may be added to produce flour of a premium quality.
Grinding and sifting Reduction of the wheat kernels by passage through corrugated caste iron rollers to produce coarse particles of endosperm (middlings) which are graded and separated from the bran by sieves before returning to appropriate rollers to further reduce the grain, and remove the bran, until the appropriate flour is obtained. This procedure is repeated using up to five more cycles of grinding and sifting, using grinders with successively finer corrugations and a series of up to 27 sifters, with progressively finer mesh, to reduce the wheat particles to granular middlings that are as free from bran as possible. Up to six different particle sizes may be produced by a single sifter with the larger particles removed from the top to return to the rollers and the finest collected at the bottom.
Reduction rolling Reduction of germ particles by passage through a series of smooth reduction rolls to reduce the purified, granular middlings, or farina, to flour. Around 75% of the wheat grain is converted to flour by these processes with the remainder comprising shorts, bran and germ being classified as millfeed. Biological waste from the control and cleaning procedures is diverted for the production of animal feed with the remainder going to landfill.
Reconstituting (gristing) To produce wholegrain flour the bran and other parts of the grain removed during the milling process are reblended with the flour in specific proportions. This process produces higher quality whole wheat flour than is achieved by grinding the whole wheat grain.
Bleaching Towards the end of the milling process measured amounts of bleaching/maturing agent (usually chlorine or benzoyl peroxide) are added to the flour which duplicates and speeds up the natural oxidation process, whitens the flour and improves its baking qualities, without leaving harmful residues or destroying nutrients.
www.efsa.europa.eu/publications
301
EFSA Supporting publication 2016:EN-1062
The present document has been produced and adopted by the bodies identified above as authors. This task has been carried out exclusively by the authors in the context of a contract between the European Food Safety Authority and the authors, awarded following a tender procedure. The present document is published complying with the transparency principle to which the Authority is subject. It may not be considered as an output adopted by the Authority. The European Food Safety Authority reserves its rights, view and position as regards the issues addressed and the conclusions reached in the present document, without prejudice to the rights of the authors.
Quantitative Pathway Analysis QPAFood
Before packing the flour is enriched by adding measured amounts of the three B vitamins (thiamin, niacin and riboflavin) as well as iron. A simplified depiction of the above procedures is given in the flow diagram (Figure D.19.01) below.
Source: http://www.nabim.org.uk/flour-and-milling/the-milling-process/ (adaptation) Figure D.19.01: Steps carried out in conversion of wheat grain to flour D.20 Feed production Wheat contributes almost 50 of the 500 million tonnes of feed that is required to support Europe’s livestock production. Two thirds of this amount is produced on farm and the other third supplied by feed manufacturers. The most important factor in production of wheat for animal feed is high yield. The feed chain is the first link in the human food chain, which includes businesses that import raw materials from around the world, manufacturers of compound feeds and feed additives, wholesalers and transporters. As with flour production, the grain is checked for quality, uniformity and freedom from spoilage organisms and quarantine pests before cleaning to remove foreign material. The need to remove other contaminating grain is less important in feed production than in the production of flour. Raw material intake and cleaning are essentially the same procedures as those used in flour production. Wheat grain is received and stored, mixed with other grain and crushed, pressed into pellets and steamed. The pellets are then dried, cooled and stored for distribution. Products are distributed to farmers in trucks and no packaging is applied. No wastewater is generated during the production process and solid waste is composed mainly of foreign matter (metal, stones etc.) which is removed during the initial cleaning procedures. The remaining production processes include the following procedures (Figure D.20.01).
Batching
www.efsa.europa.eu/publications
302
EFSA Supporting publication 2016:EN-1062
The present document has been produced and adopted by the bodies identified above as authors. This task has been carried out exclusively by the authors in the context of a contract between the European Food Safety Authority and the authors, awarded following a tender procedure. The present document is published complying with the transparency principle to which the Authority is subject. It may not be considered as an output adopted by the Authority. The European Food Safety Authority reserves its rights, view and position as regards the issues addressed and the conclusions reached in the present document, without prejudice to the rights of the authors.
Quantitative Pathway Analysis QPAFood
A process of combining all the constituents in fixed proportions according to a feed formula which differs for different livestock and ensures that a better quality feed, with balanced nutrients, is produced.
Grinding Grinding is a process of reducing solid ingredients to a required size in the same way that grain for flour production is treated. This increases the surface area exposed to heat and moisture which facilitates gelatinisation required for effective conditioning.
Mixing Mixing is the process of combining\blending of micro nutrients to produce a well-balanced feed.
Conditioning Conditioning is a process of exposing milled grain to heat and moisture to achieve gelatinization and render the product more pliable for pelleting. The mixed feed is then roasted to increase its digestibility quality. The conditioned grain is pelleted, cooled and screened to remove under and oversized particles followed by bagging prior to shipment to wholesalers. Bran and other waste products from the flour milling process are diverted to production of animal feed as are waste products produced by the drinks and biofuel industries. The quality standards and safety of animal feed in Europe are regulated by the European Feed Manufacturers’ Federation (FEFAC) whose company members operate about 4,000 feed mills across the EU according to the manufacturing standards outlined in FEFAC’s European Compound Feed and Premix Manufacturing Code, the EFMC. The Biofuel producers compete for the same raw materials used in feed. Some of the by-products and waste from this process is rich in protein and can be used for production of animal feed.
www.efsa.europa.eu/publications
303
EFSA Supporting publication 2016:EN-1062
The present document has been produced and adopted by the bodies identified above as authors. This task has been carried out exclusively by the authors in the context of a contract between the European Food Safety Authority and the authors, awarded following a tender procedure. The present document is published complying with the transparency principle to which the Authority is subject. It may not be considered as an output adopted by the Authority. The European Food Safety Authority reserves its rights, view and position as regards the issues addressed and the conclusions reached in the present document, without prejudice to the rights of the authors.
Quantitative Pathway Analysis QPAFood
Source: Adapted from 2010 Spectec Techno Projects Pvt. Ltd Figure D.20.01: Steps carried out in conversion of wheat grain to animal feed D.21 Industrial production Around 6 million tonnes of wheat is used annually as a feedstock for industrial usages other than biofuel production. Products including starch, sugars and gluten are produced for the food industry, ethanol for the drinks industry, chemicals for the pharmaceutical industry and plastics, adhesives and paper for general usage. Waste products from these processes are used for animal feed or disposed of in landfill. Locations of refineries are shown in Figure D.21.01.
www.efsa.europa.eu/publications
304
EFSA Supporting publication 2016:EN-1062
The present document has been produced and adopted by the bodies identified above as authors. This task has been carried out exclusively by the authors in the context of a contract between the European Food Safety Authority and the authors, awarded following a tender procedure. The present document is published complying with the transparency principle to which the Authority is subject. It may not be considered as an output adopted by the Authority. The European Food Safety Authority reserves its rights, view and position as regards the issues addressed and the conclusions reached in the present document, without prejudice to the rights of the authors.
Quantitative Pathway Analysis QPAFood
Figure D.21.01: Manufacturing sites of organic based chemicals NACEr2 classification 20.14 (includes biorefineries) by NUTS2
D.22 Dispersal distance for Listronotus In the introduction to a paper on Listronotus flight by Goldson et al (1999) the authors note that reports studying the flight of the weevil in New Zealand have been contradictory. Some studies say that flight is limited and most adults don’t fly but walk. Others report that the weevil only flies due to overcrowding or poor host condition. Others disagree and suggest flight is linked with warm weather fronts. For example, Barker et al. (1989) dissected adults and found only a small proportion developed flight muscles. Within a population there was partition between adults that developed flight capability and those that developed mature reproductive organs. The proportion with flight capability within a population increased during periods of crowding or under laboratory conditions, when raised on an unfavorable host. When crowding was alleviated, there was degeneration of flight muscles and resumption of reproductive activity. However, another earlier study in New Zealand during the 1970s found that a large proportion of flying adults were gravid indicating that the energy partitioning, often observed in insect species where reproduction and flight are mutually exclusive, did not occur in L. bonariensis (Goldson, 1981). Regarding model inputs, we assume that a proportion of adults can fly although most will disperse by walking (assume 500m) but that some adults can fly (max = 5km) which seems reasonable based on what www.efsa.europa.eu/publications
305
EFSA Supporting publication 2016:EN-1062
The present document has been produced and adopted by the bodies identified above as authors. This task has been carried out exclusively by the authors in the context of a contract between the European Food Safety Authority and the authors, awarded following a tender procedure. The present document is published complying with the transparency principle to which the Authority is subject. It may not be considered as an output adopted by the Authority. The European Food Safety Authority reserves its rights, view and position as regards the issues addressed and the conclusions reached in the present document, without prejudice to the rights of the authors.
Quantitative Pathway Analysis QPAFood
is written in NZ literature, and general knowledge about small weevils. Considering the literature that suggests flight is a response to overcrowding and poor host, we doubt that overcrowding will be a problem on the pathway at this point so would NOT expect flight muscles to develop; instead adults focus on reproduction. This would be a sensible strategy for a new population. Nevertheless, a precautionary approach would be to use a triangular distribution with 5km as the upper estimate. Threshold for flight Pottinger (1966) gave a threshold temp of 15C with wind speed < 13 km/h and RH 1998) Bulgaria Croatia Cyprus Czech republic (cs->1992) Denmark Estonia France Germany (incl. DD from 1991) Greece Hungary www.efsa.europa.eu/publications
: : : :
: : : :
: : : :
: : : :
: : : :
: : : :
: : : :
: : 494 : : : 34,422 81,047 49,536
482 : 14,607
: : :
34,665 82,982 90,388
20,420
269
1,473 471,089 : : 24,235 188,377 1,462,86 348,709 8
BRAZIL (x 100Kg)
: : : :
: : : :
: : 113,292
: : 913
: : : :
: : : : 1,035,64 : 4 : : 87,929 747,893 3,490,02 89,931 2
1,274,165 913
: : : :
: : : :
111,221 : : : 18,465 5,390 703,673 5,391
NZ (x 100Kg)
2005 :
2006 :
2007 :
2008 :
2009 :
2010 :
2011 :
2012 :
2005
2006 8,562
2007 :
2008 :
2009 :
2010 :
2011 :
2012 :
: : : : : : : :
: : : : : : : :
: : : : : : : 1,288
1,404 : : : : : : :
: : : : : : : 250
: : : : : : : :
: : : : : : :
: : : : : : : :
: : : : : : : :
: : : : : : : :
: : : : : : : :
: : : : : : : :
: : : : : : : :
: : : : : : : :
: : : : : : : :
: : : : : : : :
: : :
: 29,999 :
: : :
: : :
: :
: : :
: : :
: : :
: : :
: : :
16 : :
: : :
: :
: : :
: : :
: : 308
EFSA Supporting publication 2016:EN-1062
The present document has been produced and adopted by the bodies identified above as authors. This task has been carried out exclusively by the authors in the context of a contract between the European Food Safety Authority and the authors, awarded following a tender procedure. The present document is published complying with the transparency principle to which the Authority is subject. It may not be considered as an output adopted by the Authority. The European Food Safety Authority reserves its rights, view and position as regards the issues addressed and the conclusions reached in the present document, without prejudice to the rights of the authors.
Quantitative Pathway Analysis QPAFood
Ireland Italy Latvia Lithuania Luxembourg Malta
: : : : : :
10 : : : : :
: : : : : :
: : : : : :
48 : : : : :
Netherlands Poland Portugal Romania Slovakia Slovenia
: : : : : :
: : : : : :
: : 21 : : :
: : 3 : : :
2,059 : 1 : : :
: : : : :
Spain Sweden United kingdom
: : :
2,884,350 : :
: : :
: : :
: : :
: : :
EU27
:
2,914,359
1,309
1,407
2,358
PARTNER
URUGUAY
Reporter/period Austria BELGIUM (and LUXBG -> 1998)
2005 :
2006 :
2007 :
2008 :
2009 :
2010 :
2011 :
2012 :
:
:
:
:
:
:
:
:
www.efsa.europa.eu/publications
: : : : : :
5 : : : : :
: : : : : :
: : : : : 116,97 3 : : 116,97 8
309
: : : : : : : : : :
: : : : : : 3,01 1 : : : : :
: : : : : :
: : : : : : 1,48 9 : : : : :
: : : : : :
: : : : : :
4,333 : : : : :
: : : : : : 4,75 2 : : : : :
: : : : : :
: : : : : :
: : : 3,01 1
: : : 12,89 5
: : 4 4,75 6
: : 2 1,50 7
: : 1
: : 2
1
2
: : : : : : 2,15 0 : : : : :
: : : : : :
: : : 2,15 0
: : :
: : : : : :
:
EFSA Supporting publication 2016:EN-1062
The present document has been produced and adopted by the bodies identified above as authors. This task has been carried out exclusively by the authors in the context of a contract between the European Food Safety Authority and the authors, awarded following a tender procedure. The present document is published complying with the transparency principle to which the Authority is subject. It may not be considered as an output adopted by the Authority. The European Food Safety Authority reserves its rights, view and position as regards the issues addressed and the conclusions reached in the present document, without prejudice to the rights of the authors.
Quantitative Pathway Analysis QPAFood
Bulgaria Croatia Cyprus Czech republic (cs->1992) Denmark Estonia France GERMANY (incl DD from 1991) Greece Hungary Ireland Italy Latvia Lithuania Luxembourg Malta Netherlands Poland Portugal Romania Slovakia Slovenia Spain Sweden United kingdom EU27
www.efsa.europa.eu/publications
: : : : : : :
: : : : : : :
: : : : : : :
: : : : : : 4,808
: : : : : : :
: : : : : : :
: : : : : : :
: : : : : : :
: : : : : : : : : : : : : : : : : : :
: : : : : : : : : : : : : : : : : : :
: : : : : : : : : : : : : : : : : 9,878 9,878
9,157 : : : : : : : : 3,053 : : : : : : : 5,031 22,049
: : : : : : : : : : : : : : : : : : :
: : : : : : : : : : : : : : : : : : :
: : : : : : : : : : : : : : : : : : :
: : : : : : : : : : : : : : : : : : :
310
EFSA Supporting publication 2016:EN-1062
The present document has been produced and adopted by the bodies identified above as authors. This task has been carried out exclusively by the authors in the context of a contract between the European Food Safety Authority and the authors, awarded following a tender procedure. The present document is published complying with the transparency principle to which the Authority is subject. It may not be considered as an output adopted by the Authority. The European Food Safety Authority reserves its rights, view and position as regards the issues addressed and the conclusions reached in the present document, without prejudice to the rights of the authors.
Quantitative Pathway Analysis QPAFood
D.24 Major EU dry bulk ports – agricultural import data Table D.24.01: Main EU entry ports for landing of dry bulk agricultural products from target countries and quantities landed 2010-2013 EU MS
Origin
Port of entry
Q1 Belgium
Argentina
Antwerp
24
Ghent Australia
Brazil
Uruguay
2010 Q2 Q3
Quantity Dry bulk - Agricultural products (1000 tonnes/quarter) YEAR/QUARTER 2011 2012 Q4 Q1 Q2 Q3 Q4 Q1 Q2 Q3 Q4 Q1
41
42
Antwerp
2013 Q2 Q3
Q4
135 53
164
19
30
13
Ghent
:
119
:
:
61
111
:
46
293
455
107
:
399
486
:
61
Antwerp
:
:
:
:
:
:
:
:
:
:
:
:
:
:
:
:
Ghent
:
27
:
:
44
28
66
:
:
:
48
:
:
:
:
:
TOTAL
0
187
0
0
105
205
138
76
592
455
155
0
399
486
0
74
Varna
24
25
18
:
:
:
17
:
:
:
:
:
:
:
:
:
Burgas
:
:
48
:
26
:
38
27
:
:
:
:
:
30
:
:
Antwerp Ghent
Bulgaria Brazil
www.efsa.europa.eu/publications
311
EFSA Supporting publication 2016:EN-1062
The present document has been produced and adopted by the bodies identified above as authors. This task has been carried out exclusively by the authors in the context of a contract between the European Food Safety Authority and the authors, awarded following a tender procedure. The present document is published complying with the transparency principle to which the Authority is subject. It may not be considered as an output adopted by the Authority. The European Food Safety Authority reserves its rights, view and position as regards the issues addressed and the conclusions reached in the present document, without prejudice to the rights of the authors.
Quantitative Pathway Analysis QPAFood
Croatia
TOTAL
24
25
66
0
26
0
55
27
0
0
0
0
0
30
0
0
Ploce
:
:
:
:
:
:
:
:
:
:
:
:
:
:
:
:
Split
:
:
:
:
:
:
:
:
5
8
:
:
:
:
:
:
Ploce
:
:
:
:
:
:
:
:
28
:
:
:
:
:
:
29
Split
:
37
7
:
:
8
:
:
:
:
:
:
:
:
:
:
TOTAL
0
37
7
0
0
0
8
0
33
8
0
0
0
0
0
29
Larnaka
15
5
14
9
6
:
:
8
3
:
16
:
4
:
4
:
Lemesos
:
:
:
:
:
:
7
7
7
:
9
:
:
:
:
:
Larnaka
:
:
:
:
:
:
:
:
8
:
:
:
:
:
:
:
Lemesos
:
:
:
:
:
:
:
9
:
8
:
:
:
:
:
:
TOTAL
15
5
14
9
6
0
7
24
18
8
25
0
4
0
4
0
Argentina
Fredericia (Og Shell-Havnen)
0
0
0
0
0
0
0
0
0
0
0
0
0
0
0
0
Brazil
Fredericia (Og Shell-Havnen)
0
0
0
0
0
0
0
0
0
0
0
0
0
0
0
0
TOTAL
0
0
0
0
0
0
0
0
0
0
0
0
0
0
0
0
Argentina
Brazil
Cyprus
Denmark
Argentina
www.efsa.europa.eu/publications
312
EFSA Supporting publication 2016:EN-1062
The present document has been produced and adopted by the bodies identified above as authors. This task has been carried out exclusively by the authors in the context of a contract between the European Food Safety Authority and the authors, awarded following a tender procedure. The present document is published complying with the transparency principle to which the Authority is subject. It may not be considered as an output adopted by the Authority. The European Food Safety Authority reserves its rights, view and position as regards the issues addressed and the conclusions reached in the present document, without prejudice to the rights of the authors.
Quantitative Pathway Analysis QPAFood
Estonia
France
Argentina
Tallin
:
:
:
:
:
:
:
11
:
24
11
:
:
:
:
:
Uruguay
Tallin
:
:
:
:
:
:
:
:
:
:
:
:
:
:
:
:
TOTAL
0
0
0
0
0
0
0
11
0
24
11
0
0
0
0
0
Bordeaux
:
:
:
:
:
:
:
:
:
:
:
:
:
:
:
:
Brest
:
66
:
:
:
:
:
:
:
:
:
:
:
:
:
:
Le Havre
:
:
:
:
:
:
:
:
:
:
:
:
:
:
:
:
Lorient
16
:
:
:
:
:
:
:
:
:
:
:
:
:
:
:
Nantes St Nazaire
36
26
:
100
32
41
:
96
31
39
:
92
:
:
:
:
Sete
:
:
:
27
38
24
:
:
39
25
:
:
:
:
:
:
Mediteranean and Monaco
:
:
:
27
38
24
:
:
39
25
:
:
:
:
:
:
Atlantic and N. Sea
52
93
:
100
32
41
:
96
31
39
:
92
:
:
:
:
Brest
27
53
41
24
:
:
:
:
:
:
:
:
:
:
:
:
Le Havre
:
:
:
:
:
:
:
:
:
:
:
:
:
:
:
:
Argentina
Brazil
www.efsa.europa.eu/publications
313
EFSA Supporting publication 2016:EN-1062
The present document has been produced and adopted by the bodies identified above as authors. This task has been carried out exclusively by the authors in the context of a contract between the European Food Safety Authority and the authors, awarded following a tender procedure. The present document is published complying with the transparency principle to which the Authority is subject. It may not be considered as an output adopted by the Authority. The European Food Safety Authority reserves its rights, view and position as regards the issues addressed and the conclusions reached in the present document, without prejudice to the rights of the authors.
Quantitative Pathway Analysis QPAFood
Lorient
125
133
191
203
136
96
:
:
109
78
:
:
:
:
:
:
Mediteranean and Monaco
40
61
47
48
20
27
52
55
20
28
53
56
:
:
:
:
Atlantic and N. Sea
392
670
595
600
353
505
255
418
319
469
245
403
:
:
:
:
688 1,102 874 1,129 649
758
307
665
588
703
298
643
0
0
0
0
TOTAL Germany
Argentina
Australia
Brazil
www.efsa.europa.eu/publications
Baltic
:
:
:
:
:
:
:
:
23
:
14
:
:
:
:
:
Brake
:
6
:
84
:
:
:
:
:
:
:
:
:
:
:
24
Hamburg
:
:
:
:
:
:
:
63
159
110
46
46
:
56
:
:
N. Sea
:
6
:
84
:
:
:
63
159
110
46
46
:
56
:
24
Hamburg
:
:
:
:
122
170
36
:
55
241
:
:
61
87
:
:
N. Sea
:
:
:
:
122
170
36
:
55
241
:
:
61
87
:
:
Brake
:
:
:
48
:
:
:
:
:
:
:
44
49
60
:
:
Hamburg
47
339
119
:
116
297
194
31
100
318
199
131
15
296
206
48
N. Sea
47
339
119
48
116
297
194
31
100
318
199
175
68
357
206
48
314
EFSA Supporting publication 2016:EN-1062
The present document has been produced and adopted by the bodies identified above as authors. This task has been carried out exclusively by the authors in the context of a contract between the European Food Safety Authority and the authors, awarded following a tender procedure. The present document is published complying with the transparency principle to which the Authority is subject. It may not be considered as an output adopted by the Authority. The European Food Safety Authority reserves its rights, view and position as regards the issues addressed and the conclusions reached in the present document, without prejudice to the rights of the authors.
Quantitative Pathway Analysis QPAFood
Greece
Ireland
Chile
N. Sea
:
:
:
:
:
:
:
:
:
:
:
:
:
:
:
:
Uruguay
Hamburg
:
94
323
180
:
278
280
122
:
:
81
:
:
120
234
:
N. Sea
:
94
323
180
:
278
280
122
:
:
81
:
:
120
234
:
TOTAL
94
866
884
456
232 1,150 948
306
200
636
560
350
132
953
880
96
Argentina
Chalkida
:
:
:
:
:
:
:
:
:
:
:
:
:
:
:
:
Brazil
Chalkida
29
15
9
:
:
15
:
:
:
:
:
:
:
:
:
:
TOTAL
29
15
9
0
0
15
0
0
0
0
0
0
0
0
0
0
Cork
:
72
33
52
:
43
34
63
70
44
62
64
50
61
69
70
Dublin
14
39
47
43
41
45
52
93
54
60
51
63
19
30
65
83
Limerick
:
:
:
7
15
:
:
:
:
:
:
:
:
:
:
:
Cork
35
:
32
37
:
:
:
7
:
:
:
:
:
:
:
:
Dublin
12
:
:
:
:
:
:
25
10
14
:
:
:
:
18
:
Limerick
:
:
18
22
:
:
:
:
8
:
:
:
:
:
:
:
TOTAL
61
111
130
161
56
88
86
188
142
118
113
127
69
91
152
153
Ancona
23
27
23
13
:
:
:
:
:
:
:
:
:
:
:
:
Argentina
Brazil
Italy
Argentina
www.efsa.europa.eu/publications
315
EFSA Supporting publication 2016:EN-1062
The present document has been produced and adopted by the bodies identified above as authors. This task has been carried out exclusively by the authors in the context of a contract between the European Food Safety Authority and the authors, awarded following a tender procedure. The present document is published complying with the transparency principle to which the Authority is subject. It may not be considered as an output adopted by the Authority. The European Food Safety Authority reserves its rights, view and position as regards the issues addressed and the conclusions reached in the present document, without prejudice to the rights of the authors.
Quantitative Pathway Analysis QPAFood
Australia
Chioggia
44
59
30
41
29
67
40
89
:
:
:
49
42
55
53
13
Napoli
9
:
:
:
8
16
10
6
13
7
10
:
:
:
20
12
Oristano
:
:
6
:
:
:
:
16
:
:
:
:
:
:
:
:
Pozallio
11
13
10
10
5
6
5
16
:
6
6
8
:
4
5
6
Ravenna
85
136
219
162
85
94
219
162
131
237
122
119
44
28
20
80
Savona
22
48
68
90
53
150
69
35
101
107
33
:
:
:
:
26
Venesia
67
187
297
303
124
86
197
89
61
130
64
25
36
221
161
94
Bari
46
40
32
43
:
44
:
:
32
154
:
:
:
58
:
:
Ravenna
Brazil
www.efsa.europa.eu/publications
17
Venesia
:
:
:
:
:
:
:
:
:
:
:
:
:
:
:
:
Ancona
25
77
:
:
:
:
:
:
:
:
:
12
:
:
:
:
Bari
:
:
:
:
:
:
:
:
:
:
:
:
:
:
:
:
Chioggia
:
:
:
:
:
:
:
5
:
:
:
:
:
60
141
:
Oristano
:
:
:
:
18
:
:
:
:
:
:
:
:
:
:
:
Ravenna
24
103
93
2
:
:
:
:
38
110
78
43
51
75
28
:
316
EFSA Supporting publication 2016:EN-1062
The present document has been produced and adopted by the bodies identified above as authors. This task has been carried out exclusively by the authors in the context of a contract between the European Food Safety Authority and the authors, awarded following a tender procedure. The present document is published complying with the transparency principle to which the Authority is subject. It may not be considered as an output adopted by the Authority. The European Food Safety Authority reserves its rights, view and position as regards the issues addressed and the conclusions reached in the present document, without prejudice to the rights of the authors.
Quantitative Pathway Analysis QPAFood
Columbia
Uruguay
Latvia
Argentina
Brazil
Uruguay
www.efsa.europa.eu/publications
Savona
:
13
:
:
:
:
:
:
:
:
27
63
18
:
85
19
Trieste
:
:
:
:
:
:
:
:
:
:
:
:
:
:
:
:
Venesia
27
109
:
13
:
:
84
:
:
41
43
:
:
46
131
27
Italy
3
7
:
1
1
2
3
3
:
:
:
:
:
:
:
:
Salerno
:
:
:
:
:
:
:
:
:
:
:
:
:
:
:
:
Other
3
7
:
1
1
2
3
3
Italy
26
:
14
:
:
:
64
:
:
:
:
:
26
44
60
:
Venesia
26
:
12
:
:
:
64
:
:
:
:
:
:
44
60
:
TOTAL
441
826
804
679
324
467
758
424
376
792
383
319
217
635
764
277
Liepaja
:
:
:
:
:
:
:
:
:
:
:
35
:
37
:
38
Riga
:
:
:
50
31
23
33
33
26
66
:
30
:
24
54
80
Riga
:
:
:
:
:
:
:
:
:
:
:
:
:
:
:
:
Ventspils
:
39
:
:
:
:
:
:
:
:
:
:
:
:
:
:
Riga
:
:
:
:
:
:
30
:
:
:
:
:
:
:
:
:
TOTAL
0
39
0
50
31
23
63
33
26
66
0
65
0
61
54
118
317
EFSA Supporting publication 2016:EN-1062
The present document has been produced and adopted by the bodies identified above as authors. This task has been carried out exclusively by the authors in the context of a contract between the European Food Safety Authority and the authors, awarded following a tender procedure. The present document is published complying with the transparency principle to which the Authority is subject. It may not be considered as an output adopted by the Authority. The European Food Safety Authority reserves its rights, view and position as regards the issues addressed and the conclusions reached in the present document, without prejudice to the rights of the authors.
Quantitative Pathway Analysis QPAFood
Lithuania
Malta
Netherlands
Klaipeda
:
:
:
:
:
26
35
37
20
17
49
92
48
:
:
:
TOTAL
0
0
0
0
0
26
35
37
20
17
49
92
48
0
0
0
Brazil
Valetta
:
:
:
:
:
:
:
:
:
:
:
:
:
:
:
:
Columbia
Valetta
:
:
:
:
:
:
:
4
:
2
:
2
2
:
:
3
TOTAL
0
0
0
0
0
0
0
4
0
2
0
2
2
0
0
3
Amsterdam
93
390
64
216
94
412
331
333
332
198
309
92
264
162
89
113
Rotterdam
199
617
441
567
368
567
460
381
322
331
264
337
188
446
433
577
Amsterdam
:
:
:
:
:
:
:
:
:
:
:
:
:
:
:
:
Rotterdam
:
62
7
:
194
318
18
61
123
18
22
50
18
53
47
:
Vlaardingen
:
:
:
:
:
:
:
:
23
7
:
29
6
:
6
20
Amsterdam
1,1 12
1,0 67
1,1 24
1,1 50
640
892
510
581
747
631
589
796
1,01 9
153
522
619
492
538
690
908
610
402
817
869
654
691
1,1 80 1,0 36
833
Rotterdam
1,10 5 1,27 3
Velsen
:
:
:
:
:
110
102
:
:
:
:
:
:
:
:
:
Chile
Rotterdam
:
:
:
:
148
49
121
202
45
:
:
:
50
:
234
:
New Zealand
Vlissingen
:
:
:
:
:
9
:
:
:
12
:
:
:
7
:
:
Argentina
Argentina
Australia
Brazil
www.efsa.europa.eu/publications
318
419
EFSA Supporting publication 2016:EN-1062
The present document has been produced and adopted by the bodies identified above as authors. This task has been carried out exclusively by the authors in the context of a contract between the European Food Safety Authority and the authors, awarded following a tender procedure. The present document is published complying with the transparency principle to which the Authority is subject. It may not be considered as an output adopted by the Authority. The European Food Safety Authority reserves its rights, view and position as regards the issues addressed and the conclusions reached in the present document, without prejudice to the rights of the authors.
Quantitative Pathway Analysis QPAFood
Uruguay
Rotterdam TOTAL
Poland
Portugal
Argentina
Argentina
Brazil
www.efsa.europa.eu/publications
76
45
186
39
:
137
97
181
139
100
97
47
48
49
141
47
1,633 2,703 2,441 2,464 1,982 3,184 2,547 2,34 2,13 2,11 2,15 2,00 2,284 3,095 3,166 2,009 9 3 4 0 5
Gdansk
:
27
83
116
37
115
81
92
38
89
76
73
:
31
29
84
Gdynia
71
169
173
99
232
127
209
215
193
113
118
150
78
75
148
206
Swinoujscie
:
:
4
:
:
:
:
2
:
25
:
37
:
62
26
:
Szczecin
:
13
57
40
65
29
:
26
:
25
:
:
:
:
10
13
TOTAL
71
209
317
255
334
271
290
335
231
252
194
260
78
168
213
303
Leixões
:
12
14
32
15
16
17
:
:
:
:
:
:
:
:
:
Lisbon
39
40
55
16
:
164
:
64
44
127
2
:
17
61
:
29
Leixões
:
:
27
:
:
19
20
16
31
16
17
:
:
:
16
:
Lisbon
79
255
253
250
253
142
103
60
103
109
170
165
376
268
371
9
Setubbal
:
:
:
:
:
:
26
:
:
:
:
:
:
:
:
:
Leixões
:
:
:
26
:
:
:
:
:
:
:
:
:
:
:
:
Lisbon
37
28
31
:
:
56
:
:
:
:
:
:
:
28
:
:
TOTAL
155
335
380
324
268
397
166
140
178
252
189
165
393
357
387
38
319
EFSA Supporting publication 2016:EN-1062
The present document has been produced and adopted by the bodies identified above as authors. This task has been carried out exclusively by the authors in the context of a contract between the European Food Safety Authority and the authors, awarded following a tender procedure. The present document is published complying with the transparency principle to which the Authority is subject. It may not be considered as an output adopted by the Authority. The European Food Safety Authority reserves its rights, view and position as regards the issues addressed and the conclusions reached in the present document, without prejudice to the rights of the authors.
Quantitative Pathway Analysis QPAFood
Romania
Slovenia
Spain
Argentina
Constanta
37
46
47
47
100
21
23
:
:
17
21
25
27
69
47
105
Brazil
Constanta
27
121
154
80
28
212
224
215
125
158
127
56
69
151
91
:
Columbia
Constanta
:
:
1
:
:
:
:
:
:
:
:
:
:
:
:
:
Uruguay
Constanta
:
:
:
:
25
:
:
:
:
:
:
:
:
:
:
:
TOTAL
64
167
202
127
153
233
247
215
125
175
148
81
96
220
138
105
Argentina
Koper
:
6
2
28
:
13
:
:
9
16
2
:
:
7
:
41
Brazil
Koper
110
194
176
138
80
253
129
189
106
170
152
89
75
157
143
104
Columbia
Koper
:
:
:
:
:
:
1
:
:
:
:
:
:
:
:
2
Uruguay
Koper
:
:
:
:
:
:
:
:
:
:
:
:
:
:
:
:
TOTAL
110
200
178
166
80
266
129
189
115
186
154
89
75
164
143
147
Barcelona
:
147
77
:
11
130
109
42
:
:
:
59
50
165
141
:
Cadiz
29
31
42
26
29
31
36
40
15
80
69
20
15
44
44
44
Cartegena
20
98
28
114
32
60
69
122
94
100
138
:
:
45
:
40
Genoa
15
12
20
18
:
:
:
:
:
:
:
:
:
:
:
:
Guijon
:
:
:
:
:
:
:
:
:
:
:
:
:
:
:
:
Argentina
www.efsa.europa.eu/publications
320
EFSA Supporting publication 2016:EN-1062
The present document has been produced and adopted by the bodies identified above as authors. This task has been carried out exclusively by the authors in the context of a contract between the European Food Safety Authority and the authors, awarded following a tender procedure. The present document is published complying with the transparency principle to which the Authority is subject. It may not be considered as an output adopted by the Authority. The European Food Safety Authority reserves its rights, view and position as regards the issues addressed and the conclusions reached in the present document, without prejudice to the rights of the authors.
Quantitative Pathway Analysis QPAFood
Australia
Brazil www.efsa.europa.eu/publications
Huelva
39
65
48
215
33
76
92
48
76
99
79
23
:
68
88
118
La Coruna
17
63
153
79
98
181
31
91
80
115
123
31
28
90
66
48
Las Palmas
:
:
:
:
:
:
:
:
:
:
:
:
:
:
:
:
Malaga
:
:
:
:
:
:
:
:
:
:
:
:
:
:
:
:
Marin Pontevedra
17
20
19
40
33
61
47
34
20
49
34
20
16
20
:
26
Santander
39
49
41
97
36
12
95
28
40
14
35
19
:
:
20
:
Tarragona
52
158
97
189
105
97
166
72
170
157
167
24
79
67
102
130
Valencia
:
43
17
25
:
27
26
31
:
26
:
:
21
:
:
29
Villagarcia
:
:
:
:
:
:
:
:
:
:
:
:
:
:
:
:
N. Atlantic
74
201
254
216
168
254
173
191
151
178
229
115
44
136
85
74
S. Atlantic
140
543
309
571
209
422
497
355
354
462
453
160
165
389
375
362
Cadiz
:
:
:
:
:
10
:
:
:
17
13
11
:
:
:
:
Tarragona
11
:
:
:
:
30
:
:
22
16
19
:
:
:
:
:
Valencia
:
:
:
:
:
:
:
:
:
:
:
:
:
:
:
:
Barcelona
140
232
364
280
177
304
327
181
315
354
321
90
132
215
257
226
321
EFSA Supporting publication 2016:EN-1062
The present document has been produced and adopted by the bodies identified above as authors. This task has been carried out exclusively by the authors in the context of a contract between the European Food Safety Authority and the authors, awarded following a tender procedure. The present document is published complying with the transparency principle to which the Authority is subject. It may not be considered as an output adopted by the Authority. The European Food Safety Authority reserves its rights, view and position as regards the issues addressed and the conclusions reached in the present document, without prejudice to the rights of the authors.
Quantitative Pathway Analysis QPAFood
Uruguay www.efsa.europa.eu/publications
Bibao
20
141
178
41
50
297
89
186
265
256
155
25
60
266
205
20
Cadiz
28
6
30
8
8
13
:
16
25
:
:
:
:
:
43
:
Cartegena
92
209
292
222
75
414
73
169
252
221
140
115
148
237
282
112
Guijon
:
:
:
:
:
:
:
:
:
:
:
:
:
:
:
:
Huelva
16
36
69
97
10
124
82
101
26
:
52
48
:
26
48
:
La Coruna
26
39
114
79
126
36
32
22
3
36
25
52
92
8
180
101
Malaga
:
:
:
:
:
:
:
:
:
:
:
:
:
:
:
:
Marin Pontevedra
:
16
62
24
31
8
:
7
4
8
6
1
104
20
67
25
Santander
18
:
30
:
31
10
17
25
13
12
37
17
:
:
:
29
Tarragona
28
56
106
159
75
38
18
6
205
:
34
103
208
11
51
:
Valencia
:
:
41
10
:
7
26
:
:
:
:
:
40
11
:
:
Villagarcia
:
:
:
25
21
:
:
:
:
:
:
34
:
:
:
:
N. Atlantic
64
196
384
169
259
351
138
240
285
312
223
129
256
293
451
175
S. Atlantic
304
539
902
777
345
900
530
471
825
575
546
357
529
501
681
338
Bibao
:
11
:
:
:
:
:
:
:
:
:
:
:
:
:
:
322
EFSA Supporting publication 2016:EN-1062
The present document has been produced and adopted by the bodies identified above as authors. This task has been carried out exclusively by the authors in the context of a contract between the European Food Safety Authority and the authors, awarded following a tender procedure. The present document is published complying with the transparency principle to which the Authority is subject. It may not be considered as an output adopted by the Authority. The European Food Safety Authority reserves its rights, view and position as regards the issues addressed and the conclusions reached in the present document, without prejudice to the rights of the authors.
Quantitative Pathway Analysis QPAFood
Cadiz
:
:
:
:
:
:
:
:
:
:
:
:
15
:
:
:
Cartegena
:
:
:
53
:
:
:
:
:
:
:
:
32
:
:
:
Huelva
:
:
:
:
:
:
:
:
:
:
:
:
:
:
:
:
La Coruna
:
:
:
:
:
:
:
:
:
:
13
:
:
:
:
:
Malaga
:
:
:
10
:
:
:
:
:
:
:
:
:
:
:
:
Tarragona
:
:
:
43
:
:
:
:
:
:
:
:
45
:
:
:
Valencia
:
:
:
:
:
:
:
:
:
:
:
:
:
:
:
:
Villagarcia
:
:
:
:
:
:
:
:
:
:
:
:
:
:
:
:
N. Atlantic
:
11
:
26
:
:
:
:
:
:
28
26
43
:
:
:
S. Atlantic
:
:
:
106
:
:
:
:
:
:
:
87
92
:
:
:
Guijon
TOTAL UK
Argentina
www.efsa.europa.eu/publications
1,189 2,922 3,677 3,719 1,926 3,893 2,673 2,47 3,24 3,08 2,93 1,56 2,214 2,612 3,186 1,897 8 0 7 9 6
Belfast
46
113
82
155
115
101
116
130
130
113
110
137
72
110
127
86
Bristol
15
38
80
44
77
:
32
66
:
61
85
33
42
39
39
47
Clydeport
15
19
6
29
:
:
:
28
36
17
:
18
:
16
16
28
323
EFSA Supporting publication 2016:EN-1062
The present document has been produced and adopted by the bodies identified above as authors. This task has been carried out exclusively by the authors in the context of a contract between the European Food Safety Authority and the authors, awarded following a tender procedure. The present document is published complying with the transparency principle to which the Authority is subject. It may not be considered as an output adopted by the Authority. The European Food Safety Authority reserves its rights, view and position as regards the issues addressed and the conclusions reached in the present document, without prejudice to the rights of the authors.
Quantitative Pathway Analysis QPAFood
Immingham
24
22
25
59
:
70
102
58
42
28
:
:
:
14
14
:
Liverpool
31
175
76
229
120
129
112
21
104
122
316
144
72
101
229
105
London
:
:
:
:
:
:
46
:
:
35
:
24
:
:
:
38
Londonderry
:
:
:
14
:
:
:
:
:
:
:
:
:
:
10
20
Southampton
:
:
:
28
19
:
:
34
19
24
:
:
:
:
14
26
Australia
London
:
:
:
:
:
:
:
:
:
10
:
:
:
:
8
:
Brazil
Belfast
74
51
66
114
25
38
35
13
27
15
29
18
26
15
28
24
Bristol
:
:
8
:
:
:
:
:
:
:
:
:
:
:
:
:
Clydeport
11
26
16
12
19
65
:
24
27
:
25
:
14
:
:
:
Immingham
:
25
38
62
59
65
54
:
58
:
115
:
30
30
:
:
Liverpool
106
146
237
151
134
172
160
390
324
205
177
71
148
181
78
:
London
96
108
188
135
72
:
106
63
38
27
86
57
27
:
54
:
Londonderry
:
:
:
:
:
:
:
:
:
:
:
:
9
:
16
:
Southampton
19
36
21
16
:
:
:
:
:
:
:
:
:
:
:
:
Bristol
:
:
:
:
:
:
:
:
:
:
:
:
:
:
:
:
Chile www.efsa.europa.eu/publications
324
EFSA Supporting publication 2016:EN-1062
The present document has been produced and adopted by the bodies identified above as authors. This task has been carried out exclusively by the authors in the context of a contract between the European Food Safety Authority and the authors, awarded following a tender procedure. The present document is published complying with the transparency principle to which the Authority is subject. It may not be considered as an output adopted by the Authority. The European Food Safety Authority reserves its rights, view and position as regards the issues addressed and the conclusions reached in the present document, without prejudice to the rights of the authors.
Quantitative Pathway Analysis QPAFood
NZ
UK
:
:
:
:
:
:
:
:
:
7
:
:
:
11
:
:
Uruguay
UK
:
25
:
:
:
:
:
:
:
:
:
:
:
:
:
:
TOTAL
437
784
843
1,0 48
640
640
763
827
805
664
943
502
440
517
633
374
www.efsa.europa.eu/publications
325
EFSA Supporting publication 2016:EN-1062
The present document has been produced and adopted by the bodies identified above as authors. This task has been carried out exclusively by the authors in the context of a contract between the European Food Safety Authority and the authors, awarded following a tender procedure. The present document is published complying with the transparency principle to which the Authority is subject. It may not be considered as an output adopted by the Authority. The European Food Safety Authority reserves its rights, view and position as regards the issues addressed and the conclusions reached in the present document, without prejudice to the rights of the authors.
Quantitative Pathway Analysis QPAFood
D.25 NACE code for grain mills Table D.25.01: NACE codes used to identify businesses involved in the processing and preserving of fruit and vegetables Class
Division
Group
Class
C
Description Manufacturing
10
Manufacture of food products 10.6
Manufacture of grain mill products, starches and starch products 10.61
www.efsa.europa.eu/publications
Manufacture of grain mill products: Almond grinding, Barley meal production, Barley milling, Bean grinding, Bean milling, Bean splitting, Blended flour (prepared) mfr, Bran production, Breakfast cereal (cooked) mfr, Breakfast cereal (uncooked) mfr, Cake mixture mfr, Cereal breakfast mfr, Cereal grains, flour, groats, meal or pellets mfr, Chicory root drying mfr, Corn or other cereal grains mfr, Cornflake mfr, Cornflour mfr, Dough for bread, cakes, biscuits or pancakes mfr, Flaked maize production, Flour and meal of edible nuts production, Flour milling, Flour mixes mfr, Flour of cereal grains production, Flour of dried leguminous vegetables production, Flour or meal of dried leguminous vegetables production, Flour production, Glazed rice mfr, Grain milling, Grist milling, Groats production, Lentil splitting grinding or milling, Maize flaked production, Maize flour and meal production, Meal from grain mfr, Oat flour and meal mfr, Oat grinding, rolling, crushing or flaking, Parboiled or converted rice (husked, milled, polished, glazed) production, Pea splitting, milling or grinding, Polished rice mfr, Production of flour groats meal or pellets from cereal grains, Pudding mixture mfr, Puffed rice mfr, Puffed wheat mfr, Rice cleaning, Rice flaking, Rice flour production, Rice husking, Rice milling, Rice rolling, Rye flour and meal mfr, Rye flour production of, Rye milling, Rye rolling, Sago grinding, Self raising and patent flour mfr, Soya bean grinding, Soya bean milling, Soya flour and meal mfr, Vegetable milling, Wheat flake mfr, Wheat meal flour production, Wheat milling, Wheat offal, Barley processing (blocked, flaked, puffed or pearled), Flour and meal of roots or tubers production, Meal of dried leguminous vegetables production, Rye flaking, Semolina milling, Wheat pellets flour production. 326
EFSA Supporting publication 2016:EN-1062
The present document has been produced and adopted by the bodies identified above as authors. This task has been carried out exclusively by the authors in the context of a contract between the European Food Safety Authority and the authors, awarded following a tender procedure. The present document is published complying with the transparency principle to which the Authority is subject. It may not be considered as an output adopted by the Authority. The European Food Safety Authority reserves its rights, view and position as regards the issues addressed and the conclusions reached in the present document, without prejudice to the rights of the authors.
Quantitative Pathway Analysis QPAFood
10.62
Manufacture of starches and starch products
D.26 Commercial bio-refineries in Europe
Belgium Location: Rodenhuizedok (Port of Ghent) Company: Alco Bio Fuels Feedstock: Wheat Product: bio-ethanol (150,000-m⇡) Start: 2008 Website: www.alcogroup.com Belgium Location: Wanze Company: BioWanze (Südzucker) Feedstock: Wheat (800,000 t/a) Product: bio-ethanol (300,000-m3/a), gluten, soluble protein concentrate (200,00t/a) Start: 2009 Website: www.biowanze.be/fr/Start/ Belgium Location: Aalst Company: Syral (Tereos) Feedstock: wheat (420,000 t/a) Product: Starch derivatives 450,000t/a) concentrate (200,00t/a) Start: 2008 Website: www.syral.com Denmark Dong Inbicon Biomass Refinery Wheat straw collection infrastructure available from co-location with heat and power generation
France Location: Les Sohettes, Pomacle – Bazancourt (Champagne Ardenne) Company: Cristanol 2, Feedstock: wheat (350,000 t/a) Product: Bioethanol (160 kt/a ) Start: 2009 Website: www.chamtor.fr
www.efsa.europa.eu/publications
327
EFSA Supporting publication 2016:EN-1062
The present document has been produced and adopted by the bodies identified above as authors. This task has been carried out exclusively by the authors in the context of a contract between the European Food Safety Authority and the authors, awarded following a tender procedure. The present document is published complying with the transparency principle to which the Authority is subject. It may not be considered as an output adopted by the Authority. The European Food Safety Authority reserves its rights, view and position as regards the issues addressed and the conclusions reached in the present document, without prejudice to the rights of the authors.
Quantitative Pathway Analysis QPAFood
France Location: Les Sohettes, Pomacle – Bazancourt (Champagne Ardenne) Company: Chamtor Feedstock: wheat (250,000 t/a) Product: Starch & glucose (250,000 t/a) Start: 2009 Website: www.chamtor.fr France Location: Les Sohettes, Pomacle – Bazancourt (Champagne Ardenne) Company: ARD Feedstock: wheat Product: R&D Start: 1989 Website: www.a-r-d.fr/ France Location: Les Sohettes, Pomacle – Bazancourt (Champagne Ardenne) Company: Soliance Feedstock: wheat Product: Cosmetic ingredients Start: 2008 Website: www.soliance.com
France Location: Lestrem Company: Roquette Feedstock: wheat (1,700,000t/a) Product: Starch, food, feed, bulk and fine chemicals, succinic acid, ethanol… Start:? Website: www.roquette.fr France Location: Lestrem Company: Bio-Hub prgm Feedstock: wheat and maize Product: Bioplastics Start:2006 Website: www.biohub.fr France www.efsa.europa.eu/publications
328
EFSA Supporting publication 2016:EN-1062
The present document has been produced and adopted by the bodies identified above as authors. This task has been carried out exclusively by the authors in the context of a contract between the European Food Safety Authority and the authors, awarded following a tender procedure. The present document is published complying with the transparency principle to which the Authority is subject. It may not be considered as an output adopted by the Authority. The European Food Safety Authority reserves its rights, view and position as regards the issues addressed and the conclusions reached in the present document, without prejudice to the rights of the authors.
Quantitative Pathway Analysis QPAFood
Bazancourt-Pomacle Biorefinery Feedstock supply (wheat and glucose) Netherlands Location: Sas van Gent Company: CARGILL Feedstock: wheat and corn Product: Starches, starch derivates, wheat proteins, and glucose Start: 2006 Website: www.cargill.com Netherlands Location: Sas van Gent Company: Royal Nedalco Feedstock: wheat and corn Product: Bioethanol (2.2 Ml/a), DDGS Start:2005 Website: www.nedalco.com UK Location: Trafford Park, Manchester Company: CARGILL Feedstock: wheat (750,000t/a) ProductStarches, starch derivates, wheat proteins, and glucose, (2) Bioethanol (2.2 Ml/a), DDGS Start: 2006 Website: www.cargill.com UK Location: Trafford Park, Manchester Company: Royal Nedalco Feedstock: wheat (750,000t/a) shared with CARGILL Product: Bioethanol (2.2 Ml/a), DDGS Start: 2006 Website: www.nedalco.com
www.efsa.europa.eu/publications
329
EFSA Supporting publication 2016:EN-1062
The present document has been produced and adopted by the bodies identified above as authors. This task has been carried out exclusively by the authors in the context of a contract between the European Food Safety Authority and the authors, awarded following a tender procedure. The present document is published complying with the transparency principle to which the Authority is subject. It may not be considered as an output adopted by the Authority. The European Food Safety Authority reserves its rights, view and position as regards the issues addressed and the conclusions reached in the present document, without prejudice to the rights of the authors.
Quantitative Pathway Analysis QPAFood
D.27 NACE codes Table D.27.01: NACE code used to estimate location of bio-refineries and industrial processing of wheat grain for alcohol Class
Division
Group
Class
C
Description Manufacturing
20
Manufacture of chemicals and chemical products 20.1
Manufacture of basic chemicals, fertilisers and nitrogen compounds, plastics and synthetic rubber in primary forms 20.14
This class includes the manufacture of chemicals using basic processes, such as thermal cracking and distillation. The output of these processes are usually separate chemical elements or separate chemically defined compounds. This class includes: - manufacture of basic organic chemicals: • acyclic hydrocarbons, saturated and unsaturated • cyclic hydrocarbons, saturated and unsaturated • acyclic and cyclic alcohols • mono- and polycarboxylic acids, including acetic acid • other oxygen-function compounds, including aldehydes, ketones, quinones and dual or poly oxygen-function compounds • synthetic glycerol • nitrogen-function organic compounds, including amines • fermentation of sugarcane, corn or similar, to produce alcohol and esters • other organic compounds, including wood distillation products (e.g. charcoal) etc. - manufacture of synthetic aromatic products - distillation of coal tar
www.efsa.europa.eu/publications
330
EFSA Supporting publication 2016:EN-1062
The present document has been produced and adopted by the bodies identified above as authors. This task has been carried out exclusively by the authors in the context of a contract between the European Food Safety Authority and the authors, awarded following a tender procedure. The present document is published complying with the transparency principle to which the Authority is subject. It may not be considered as an output adopted by the Authority. The European Food Safety Authority reserves its rights, view and position as regards the issues addressed and the conclusions reached in the present document, without prejudice to the rights of the authors.
Quantitative Pathway Analysis QPAFood
Appendix E – Practical guidance on spatial data sources This report aims to identify data sources that can be used to populate some components of a quantitative risk assessment model being developed in an EFSA procurement project “Development of probabilistic models for quantitative pathway analysis of plant pests introduction for the EU territory”, CFT/EFSA/PLH/2011/01. Following discussion with EFSA, the project team decided data at a spatial scale of NUTS 2 would be a feasible and useful resolution. Introduction to NUTS (Nomenclature Units for Territorial Statistics) NUTS are an EU standard for identifying national and sub-national divisions within Members States of the EU. Four NUTS levels are used, NUTS 0 refers to a whole EU MS, while NUTS 1, 2 and 3 refer to increasingly smaller areas within a MS. At present there are: 97 regions within NUTS 1 270 regions at NUTS 2, and 1,294 regions at NUTS 3 level. The NUTS regions are broadly based on human populations for comparability, but the threshold figures and upper limits are not always adhered to.
Table E.1.01: Guide for human population within NUTS levels . Level
Minimum
Maximum
NUTS 1
3 million
7 million
NUTS 2
800,000
3 million
NUTS 3
150,000
800,000
Figure E.1.01: Map of EU NUTS 2 regions (darker shaded regions).
www.efsa.europa.eu/publications
331
EFSA Supporting publication 2016:EN-1062
The present document has been produced and adopted by the bodies identified above as authors. This task has been carried out exclusively by the authors in the context of a contract between the European Food Safety Authority and the authors, awarded following a tender procedure. The present document is published complying with the transparency principle to which the Authority is subject. It may not be considered as an output adopted by the Authority. The European Food Safety Authority reserves its rights, view and position as regards the issues addressed and the conclusions reached in the present document, without prejudice to the rights of the authors.
Quantitative Pathway Analysis QPAFood
www.efsa.europa.eu/publications
332
EFSA Supporting publication 2016:EN-1062
The present document has been produced and adopted by the bodies identified above as authors. This task has been carried out exclusively by the authors in the context of a contract between the European Food Safety Authority and the authors, awarded following a tender procedure. The present document is published complying with the transparency principle to which the Authority is subject. It may not be considered as an output adopted by the Authority. The European Food Safety Authority reserves its rights, view and position as regards the issues addressed and the conclusions reached in the present document, without prejudice to the rights of the authors.
Quantitative Pathway Analysis QPAFood
Table E.1.02. EU NUTS descriptors. Number of NUTS regions
EU member
Description / admin unit for NUTS
Austria
States
Belgium
Provinces (+ Brussels)
Bulgaria
Planning regions
6
Croatia
Regions
2
Cyprus
9 11
N/A small country, no NUTS
Czech Republic
Oblasts
Germany
Government regions (or equivalent)
Denmark
Regions
Estonia
1 8 39 5
N/A small country, no NUTS2
1
Spain
17 Autonomous communities and 2 autonomous cities
19
Finland
Large areas
France
Regions + DOM
27
Greece
Regions
13
Hungary
Planning and statistical regions
7
Ireland
Regional Assemblies
2
Italy
Regions (Trentino-Alto Adige/Südtirol split into two)
5
21
Lithuania
N/A small country, no NUTS2
1
Luxembourg
N/A small country, no NUTS2
1
Latvia
N/A small country, no NUTS2
1
Malta
N/A small country, no NUTS
1
Netherlands
Provinces
12
Poland
Voivodeships
16
www.efsa.europa.eu/publications
333
EFSA Supporting publication 2016:EN-1062
The present document has been produced and adopted by the bodies identified above as authors. This task has been carried out exclusively by the authors in the context of a contract between the European Food Safety Authority and the authors, awarded following a tender procedure. The present document is published complying with the transparency principle to which the Authority is subject. It may not be considered as an output adopted by the Authority. The European Food Safety Authority reserves its rights, view and position as regards the issues addressed and the conclusions reached in the present document, without prejudice to the rights of the authors.
Quantitative Pathway Analysis QPAFood
Portugal
Coordination and development regions + autonomous regions
7
Romania
Regions
8
Sweden
National areas
8
Slovenia
Macroregions
2
Slovakia
Oblasts
4
United Kingdom
Counties (some grouped); Inner and Outer London
37
Source: http://en.wikipedia.org/wiki/Nomenclature_of_Territorial_Units_for_Statistics Agriculture statistics at regional level Considerable time was spent searching EUROSTAT for data at NUTS2 level for the case study crops (wheat, apples, plums, oranges). The following sites were found of partial use:
http://epp.eurostat.ec.europa.eu/statistics_explained/index.php/Agriculture_statistics _at_regional_level http://epp.eurostat.ec.europa.eu/portal/page/portal/agriculture/data/database Figure E.1.02 shows fields in the database from which data can be extracted. Data at a regional level within the EU is available for the following crops:
Cereals for the production of grain (including rice and seed)
Cereals (excluding rice)
Wheat (including spelt) *
Common wheat and spelt *
Durum wheat
Rye
Barley
Grain maize
Rice
Dried pulses and protein crops for the production of grain (including seed and mixtures of cereals and pulses)
Potatoes (including early potatoes and seed potatoes)
Sugar beet (excluding seed)
Oilseeds
Rape and turnip seed
Sunflower seed
www.efsa.europa.eu/publications
334
EFSA Supporting publication 2016:EN-1062
The present document has been produced and adopted by the bodies identified above as authors. This task has been carried out exclusively by the authors in the context of a contract between the European Food Safety Authority and the authors, awarded following a tender procedure. The present document is published complying with the transparency principle to which the Authority is subject. It may not be considered as an output adopted by the Authority. The European Food Safety Authority reserves its rights, view and position as regards the issues addressed and the conclusions reached in the present document, without prejudice to the rights of the authors.
Quantitative Pathway Analysis QPAFood
Linseed (oil flax)
Soya
Cotton seed
Tobacco
Green maize
Fruit trees (excluding olives and citrus fruit) *
Berries (excluding strawberries)
Vineyards
Olive trees
Crops marked * are relevant to the project case study crops. Figure E.1.02a illustrates the user interface for selecting particular crops within the regional agricultural database. The spatial scale is selected by choosing groups (i.e. all) or selected individual regions at the NUTS 0 to 2 (or 3) scale (Figure E.1.02b). Production (‘000 of tonnes), yields (‘00 kg ha-1) or area harvested (‘000 ha) can be selected (Figure E.1.02c) and finally the year for which data is required is selected 1975 – 2013 (Figure E.1.02d). Figure E.1.02: Database fields for regional agricultural statistics
Figure E.1.02a: Selection of crop
www.efsa.europa.eu/publications
Figures E.1.02b: Selection of geographic unit (NUTS)
335
EFSA Supporting publication 2016:EN-1062
The present document has been produced and adopted by the bodies identified above as authors. This task has been carried out exclusively by the authors in the context of a contract between the European Food Safety Authority and the authors, awarded following a tender procedure. The present document is published complying with the transparency principle to which the Authority is subject. It may not be considered as an output adopted by the Authority. The European Food Safety Authority reserves its rights, view and position as regards the issues addressed and the conclusions reached in the present document, without prejudice to the rights of the authors.
Quantitative Pathway Analysis QPAFood
Figure E.1.02c: Selection of production, yield or area
www.efsa.europa.eu/publications
Figure E.1.02d: Selection of year (1975- 2013)
336
EFSA Supporting publication 2016:EN-1062
The present document has been produced and adopted by the bodies identified above as authors. This task has been carried out exclusively by the authors in the context of a contract between the European Food Safety Authority and the authors, awarded following a tender procedure. The present document is published complying with the transparency principle to which the Authority is subject. It may not be considered as an output adopted by the Authority. The European Food Safety Authority reserves its rights, view and position as regards the issues addressed and the conclusions reached in the present document, without prejudice to the rights of the authors.
Quantitative Pathway Analysis QPAFood
Figure E.1.03 shows a screen shot of the area of common wheat and spelt grown in EU NUTS regions each year from 2009 until 2013. (At the time of searching, only NUTS0 data were available for 2013).
Figure E.1.03: Eurostat data (screen shot) for area (‘000 ha) of “common wheat subnational level
www.efsa.europa.eu/publications
337
and spelt” at
EFSA Supporting publication 2016:EN-1062
The present document has been produced and adopted by the bodies identified above as authors. This task has been carried out exclusively by the authors in the context of a contract between the European Food Safety Authority and the authors, awarded following a tender procedure. The present document is published complying with the transparency principle to which the Authority is subject. It may not be considered as an output adopted by the Authority. The European Food Safety Authority reserves its rights, view and position as regards the issues addressed and the conclusions reached in the present document, without prejudice to the rights of the authors.
Quantitative Pathway Analysis QPAFood
The data shown in the database illustrated in Figures E.1.03 and E.1.04 are used to generate maps such as that illustrated in Figure E.1.05.
Figure E.1.04: Eurostat data (screen shot) of annual wheat yield at NUTS 2 resolution: 2002-2009
www.efsa.europa.eu/publications
338
EFSA Supporting publication 2016:EN-1062
The present document has been produced and adopted by the bodies identified above as authors. This task has been carried out exclusively by the authors in the context of a contract between the European Food Safety Authority and the authors, awarded following a tender procedure. The present document is published complying with the transparency principle to which the Authority is subject. It may not be considered as an output adopted by the Authority. The European Food Safety Authority reserves its rights, view and position as regards the issues addressed and the conclusions reached in the present document, without prejudice to the rights of the authors.
Quantitative Pathway Analysis QPAFood
Figure E.1.05: Harvested production of cereals (including rice), by NUTS2 regions, 2011 (1)
www.efsa.europa.eu/publications
339
EFSA Supporting publication 2016:EN-1062
The present document has been produced and adopted by the bodies identified above as authors. This task has been carried out exclusively by the authors in the context of a contract between the European Food Safety Authority and the authors, awarded following a tender procedure. The present document is published complying with the transparency principle to which the Authority is subject. It may not be considered as an output adopted by the Authority. The European Food Safety Authority reserves its rights, view and position as regards the issues addressed and the conclusions reached in the present document, without prejudice to the rights of the authors.
Quantitative Pathway Analysis QPAFood
Variation of wheat yield across the EU An EC report on EU cereal production (European Commission EU FADN, 2013) showed common wheat yield varies widely within the EU. In Greece and Estonia yield is usually around 3 t/ha, while farms in the UK regularly report over 8 t/ha. Denmark, France and Germany are other high-yield producers. The average yield in 2009 was 5.7 t/ha, 4% lower than in the preceding year. A further decrease in yields occurred in 2010, but yields were estimated to have picked up to 5.2 t/ha in 2011. The average yield for durum wheat was 3.3 t/ha in 2008, slightly less (-5%) than the year before. Italy was very close to the average, with Spain and Greece at around 3 t/ha in 2009. French durum wheat yields were significantly higher, at almost 5 t/ha.
TABLE E.1.03: EU MS wheat yields, arranged by mean yield (tonnes /ha) EU MS
2010
2011
Belgium
8.8272
Netherlands
Min
Mean
Max
8.4046
8.3378 8.34
8.52
8.83
8.9092
7.7812
8.5870 7.78
8.43
8.91
Ireland
8.5990
9.8620
6.3061 6.31
8.26
9.86
Belgium-Luxembourg
7.9813
7.9813
7.9813 7.98
7.98
7.98
United Kingdom
7.6730
7.7486
6.6571 6.66
7.36
7.75
Germany
7.3102
7.0193
7.3283 7.02
7.22
7.33
Denmark
6.6264
6.4672
7.3687 6.47
6.82
7.37
France
6.4419
6.1788
7.5992 6.18
6.74
7.60
Luxembourg
5.9586
5.5290
5.8665 5.53
5.78
5.96
Sweden
5.3966
5.3786
6.2379 5.38
5.67
6.24
Malta
5.3333
4.7241
5.7143 4.72
5.26
5.71
Slovenia
4.8044
5.1770
5.4376 4.80
5.14
5.44
Austria
5.0117
5.8549
4.1385 4.14
5.00
5.85
Czech Republic
4.9923
5.6921
4.3155 4.32
5.00
5.69
Croatia
4.0415
5.2237
5.3473 4.04
4.87
5.35
Poland
3.9432
4.1348
4.1438 3.94
4.07
4.14
Norway
4.5970
3.8511
3.6960 3.70
4.05
4.60
www.efsa.europa.eu/publications
2012
340
EFSA Supporting publication 2016:EN-1062
The present document has been produced and adopted by the bodies identified above as authors. This task has been carried out exclusively by the authors in the context of a contract between the European Food Safety Authority and the authors, awarded following a tender procedure. The present document is published complying with the transparency principle to which the Authority is subject. It may not be considered as an output adopted by the Authority. The European Food Safety Authority reserves its rights, view and position as regards the issues addressed and the conclusions reached in the present document, without prejudice to the rights of the authors.
Quantitative Pathway Analysis QPAFood
Italy
3.7421
3.8335
4.1324 3.74
3.90
4.13
Lithuania
3.3045
3.3914
4.7829 3.30
3.83
4.78
Hungary
3.7038
4.1994
3.5183 3.52
3.81
4.20
Slovakia
3.5050
4.5197
3.2860 3.29
3.77
4.52
Bulgaria
3.5992
3.9191
3.7596 3.60
3.76
3.92
Finland
3.4299
3.8288
3.9028 3.43
3.72
3.90
Latvia
3.4617
3.0462
4.3411 3.05
3.62
4.34
Estonia
2.7368
2.7960
3.9019 2.74
3.14
3.90
Greece
3.2609
3.1287
2.7852 2.79
3.06
3.26
Spain
3.0498
3.4475
2.6439 2.64
3.05
3.45
Romania
2.7000
3.6650
2.6593 2.66
3.01
3.67
Portugal
1.4305
1.3669
1.0766 1.08
1.29
1.43
Alternative sources for crop area at NUTS 2 (non-Eurostat) NUTS2 level data on the area grown for the key case study crops are not readily available from Eurostat. Fortunately indicative global distribution maps of the area harvested (hectares per km -2) and yield (tonnes per km-2 of production) for a number of crops are available following work by Monfreda et al. (2008) using data from a McGill University website. ARC GIS was used to plot the area of case study crops on a 5 minute latitude x 5 minute longitude map and overlay EU NUTS2 boundaries (Figures E.1.07a – d). Tables generated within ARC GIS and output as Excel tables, indicating the estimated area of harvested case study crops, can provide data for use within the projects quantitative model. A sample screen shot of such a spreadsheet is shown as Figure E.1.06. Figure E.1.06: Sample screen shot of data within Excel from ARC GIS describing case study crop area within NUTS 2 regions
www.efsa.europa.eu/publications
341
EFSA Supporting publication 2016:EN-1062
The present document has been produced and adopted by the bodies identified above as authors. This task has been carried out exclusively by the authors in the context of a contract between the European Food Safety Authority and the authors, awarded following a tender procedure. The present document is published complying with the transparency principle to which the Authority is subject. It may not be considered as an output adopted by the Authority. The European Food Safety Authority reserves its rights, view and position as regards the issues addressed and the conclusions reached in the present document, without prejudice to the rights of the authors.
Quantitative Pathway Analysis QPAFood
The tables are provided as Excel spreadsheets accompanying this report. Table E.1.04 provides a key to the data in the spreadsheets. Table E.1.04: Key to data generated from ARC GIS estimating crop area harvested in NUTS 2 regions for case study crops - based on Monfreda et al. (2008) using data from McGill University Highlight label
Column Title
Explanation
A
NUTS_ID
NUTS code identifier (generally 2 letters to identify the EU Member State followed by 2 digits).
B
COUNT
Number of grid cells within the NUTS regions.
C
MIN
Minimum value of a cell within the NUTS region. Here values are the area of crops harvested. Generally there will always be a zero here indicating that not all cells in a region will grow the crop.
D
MAX
Maximum value of a cell within the NUTS regions.
E
MEAN
Mean value of all cell within the NUTS region.
F
SUM
Sum of values for the NUTS region ( = B x E). This is the key value for use in
the project and shows a figure representing estimated area grown in each NUTS region for case study crops. Note this has unspecified units (see text after Figure E.1.07d).
www.efsa.europa.eu/publications
342
EFSA Supporting publication 2016:EN-1062
The present document has been produced and adopted by the bodies identified above as authors. This task has been carried out exclusively by the authors in the context of a contract between the European Food Safety Authority and the authors, awarded following a tender procedure. The present document is published complying with the transparency principle to which the Authority is subject. It may not be considered as an output adopted by the Authority. The European Food Safety Authority reserves its rights, view and position as regards the issues addressed and the conclusions reached in the present document, without prejudice to the rights of the authors.
Quantitative Pathway Analysis QPAFood
Figure E.1.07 a-d: Estimated harvested area of case study crops at subnational levels within the EU (based on Monfreda et al., 2008)
Figure E1.07a: Wheat
www.efsa.europa.eu/publications
343
EFSA Supporting publication 2016:EN-1062
The present document has been produced and adopted by the bodies identified above as authors. This task has been carried out exclusively by the authors in the context of a contract between the European Food Safety Authority and the authors, awarded following a tender procedure. The present document is published complying with the transparency principle to which the Authority is subject. It may not be considered as an output adopted by the Authority. The European Food Safety Authority reserves its rights, view and position as regards the issues addressed and the conclusions reached in the present document, without prejudice to the rights of the authors.
Quantitative Pathway Analysis QPAFood
Figure E.1.07b: Apples
www.efsa.europa.eu/publications
344
EFSA Supporting publication 2016:EN-1062
The present document has been produced and adopted by the bodies identified above as authors. This task has been carried out exclusively by the authors in the context of a contract between the European Food Safety Authority and the authors, awarded following a tender procedure. The present document is published complying with the transparency principle to which the Authority is subject. It may not be considered as an output adopted by the Authority. The European Food Safety Authority reserves its rights, view and position as regards the issues addressed and the conclusions reached in the present document, without prejudice to the rights of the authors.
Quantitative Pathway Analysis QPAFood
Figure E.1.07c: Plums (data lacking for UK, Low Countries and others)
www.efsa.europa.eu/publications
345
EFSA Supporting publication 2016:EN-1062
The present document has been produced and adopted by the bodies identified above as authors. This task has been carried out exclusively by the authors in the context of a contract between the European Food Safety Authority and the authors, awarded following a tender procedure. The present document is published complying with the transparency principle to which the Authority is subject. It may not be considered as an output adopted by the Authority. The European Food Safety Authority reserves its rights, view and position as regards the issues addressed and the conclusions reached in the present document, without prejudice to the rights of the authors.
Quantitative Pathway Analysis QPAFood
Figure E.1.07d: Oranges (data lacking for France and other MS) The column labelled “AREA” in the table output from ARC GIS does not represent an SI unit of area such as hectares (ha) but can be used as an index, allowing NUTS2 regions to be identified with the greatest area of case study crops grown. Thus for wheat, FR24, ES41 and RO31 are the NUTS regions with the largest wheat area planted (Fig. E.1.08a). The largest areas of apple are found in RO21, PL34 and LV00 (Fig. E.1.08b). The largest area of plums are found in RO31, RO22 and RO21 (Fig. E.1.08c) and the largest area of oranges are found in ES42, ES61 and ES41 (Fig. E.1.08d).
www.efsa.europa.eu/publications
346
EFSA Supporting publication 2016:EN-1062
The present document has been produced and adopted by the bodies identified above as authors. This task has been carried out exclusively by the authors in the context of a contract between the European Food Safety Authority and the authors, awarded following a tender procedure. The present document is published complying with the transparency principle to which the Authority is subject. It may not be considered as an output adopted by the Authority. The European Food Safety Authority reserves its rights, view and position as regards the issues addressed and the conclusions reached in the present document, without prejudice to the rights of the authors.
Quantitative Pathway Analysis QPAFood
Figure E.1.08 a-d: Sample screen shots of data within Excel from ARC GIS ranking case study crop areas within NUTS2 regions Figure E.1.08a: Wheat
Figure E.1.08b: Apples
www.efsa.europa.eu/publications
347
EFSA Supporting publication 2016:EN-1062
The present document has been produced and adopted by the bodies identified above as authors. This task has been carried out exclusively by the authors in the context of a contract between the European Food Safety Authority and the authors, awarded following a tender procedure. The present document is published complying with the transparency principle to which the Authority is subject. It may not be considered as an output adopted by the Authority. The European Food Safety Authority reserves its rights, view and position as regards the issues addressed and the conclusions reached in the present document, without prejudice to the rights of the authors.
Quantitative Pathway Analysis QPAFood
Figure E.1.08c: Plums
Figure E.1.08d: Oranges
www.efsa.europa.eu/publications
348
EFSA Supporting publication 2016:EN-1062
The present document has been produced and adopted by the bodies identified above as authors. This task has been carried out exclusively by the authors in the context of a contract between the European Food Safety Authority and the authors, awarded following a tender procedure. The present document is published complying with the transparency principle to which the Authority is subject. It may not be considered as an output adopted by the Authority. The European Food Safety Authority reserves its rights, view and position as regards the issues addressed and the conclusions reached in the present document, without prejudice to the rights of the authors.
Quantitative Pathway Analysis QPAFood
Population density at NUTS An estimate of the final destination of commodities for consumption could reasonably be expected to be determined by population density. Eurostat provides population density data at up to a resolution of NUTS 3 and is available for download at …. http://appsso.eurostat.ec.europa.eu/nui/submitViewTableAction.do Figure E.1.09 shows a screen shot for selecting NUTS regions and Figure E.1.10 shows output which can be downloaded in various formats. Figure E.1.09: EU Population density at subnational level – Eurostat database interface for selection of spatial scale
www.efsa.europa.eu/publications
349
EFSA Supporting publication 2016:EN-1062
The present document has been produced and adopted by the bodies identified above as authors. This task has been carried out exclusively by the authors in the context of a contract between the European Food Safety Authority and the authors, awarded following a tender procedure. The present document is published complying with the transparency principle to which the Authority is subject. It may not be considered as an output adopted by the Authority. The European Food Safety Authority reserves its rights, view and position as regards the issues addressed and the conclusions reached in the present document, without prejudice to the rights of the authors.
Quantitative Pathway Analysis QPAFood
Figure E.1.10: Sample screen shot for subnational EU population density
http://epp.eurostat.ec.europa.eu/statistics_explained/images/e/e4/Population_density%2C_by_NUTS_ 2_regions%2C_2008.PNG
Maps illustrating EU population density are available from the Eurostat website (e.g. Figure E.1.11). The most recent data (2012) are not available for some countries (43 NUTS2 regions missing, Figure E.1.11a). However, data from 2008 is more comprehensive (Figure E.1.11b).
www.efsa.europa.eu/publications
350
EFSA Supporting publication 2016:EN-1062
The present document has been produced and adopted by the bodies identified above as authors. This task has been carried out exclusively by the authors in the context of a contract between the European Food Safety Authority and the authors, awarded following a tender procedure. The present document is published complying with the transparency principle to which the Authority is subject. It may not be considered as an output adopted by the Authority. The European Food Safety Authority reserves its rights, view and position as regards the issues addressed and the conclusions reached in the present document, without prejudice to the rights of the authors.
Quantitative Pathway Analysis QPAFood
Figure E.1.11a: EU Population density by NUTS region (Data for 2012)
Source: http://epp.eurostat.ec.europa.eu/tgm/mapToolClosed.do?tab=map&init=1&plugin=1&language=en&p code=tgs00024&toolbox=types#
Figure E.1.11b: EU Population density by NUTS region (Data for 2008)
www.efsa.europa.eu/publications
351
EFSA Supporting publication 2016:EN-1062
The present document has been produced and adopted by the bodies identified above as authors. This task has been carried out exclusively by the authors in the context of a contract between the European Food Safety Authority and the authors, awarded following a tender procedure. The present document is published complying with the transparency principle to which the Authority is subject. It may not be considered as an output adopted by the Authority. The European Food Safety Authority reserves its rights, view and position as regards the issues addressed and the conclusions reached in the present document, without prejudice to the rights of the authors.
Quantitative Pathway Analysis QPAFood
A spreadsheet with annual population density data for the years 2008 to 2012 at the NUTS2 spatial scale accompanies this report.
www.efsa.europa.eu/publications
352
EFSA Supporting publication 2016:EN-1062
The present document has been produced and adopted by the bodies identified above as authors. This task has been carried out exclusively by the authors in the context of a contract between the European Food Safety Authority and the authors, awarded following a tender procedure. The present document is published complying with the transparency principle to which the Authority is subject. It may not be considered as an output adopted by the Authority. The European Food Safety Authority reserves its rights, view and position as regards the issues addressed and the conclusions reached in the present document, without prejudice to the rights of the authors.
Quantitative Pathway Analysis QPAFood
Appendix F – Practical guidance on information gathering and helpful data sources A structured technique for gathering information for pest risk analysis used by Fera Introductory notes: There may often be old books / journals / websites which contain really useful background information, but always think about how up to date the information is. For a specific topic, literature searches are the first area for consideration and should yield the most up to date information. Ensure these are done in discussion with the Information Centre staff; the specialist can often unearth information which you may not find yourself. If a quick search is needed use the links under the Information Centre page on the intranet. No. Question 1.
2.
Answer
Go to
Are you searching for information about a particular pest?
2
or for information about a particular plant, crop or commodity?
13
or for information about a geographical area?
15
Check the name of the pest, look for synonyms and misspellings.
General CABI CPC (Crop Protection Compendium) CABI FC (Forestry Compendium) Plant Health Information Warehouse (PHIW) EPPO PQR – Plant Quarantine Information Retrieval system The NCBI Entrez Taxonomy Homepage Fera Registered files (PPH and PPP), Invertebrate Pests CABI Arthropod Name Index Wood, (1989), Bosik, (1997), Evans, (1961), Fauna Europaea – online database, Kloet and Hinks (various years), Anon. (1989), Hollis (1980), Derwent Publications (Eds.) (1990), For nematodes try Esser, (1991), but check with Sue Hockland Diseases Indexfungorum
www.efsa.europa.eu/publications
353
EFSA Supporting publication 2016:EN-1062
The present document has been produced and adopted by the bodies identified above as authors. This task has been carried out exclusively by the authors in the context of a contract between the European Food Safety Authority and the authors, awarded following a tender procedure. The present document is published complying with the transparency principle to which the Authority is subject. It may not be considered as an output adopted by the Authority. The European Food Safety Authority reserves its rights, view and position as regards the issues addressed and the conclusions reached in the present document, without prejudice to the rights of the authors.
Quantitative Pathway Analysis QPAFood
MycoBank Fungal Records Database of Britain and Ireland Farr et al (undated) Bradbury (1986) ICTVdB DPVWeb Smith et al., 1988 Have you found the correct name? No. Question 3.
Yes
3
No
4
Answer
Do you need more information on the pest?
Go to Yes
5
No 4.
STOP
Search Information Centre IPAC computer system – use keywords, Conduct a literature search on sites such as Web of Knowledge, INGENTACONNECT and OVID (all through Athens) also Google (Scholar) – use keywords, Ask Information Centre staff for an on-line literature search. Conduct a general internet search e.g. Google. Do you have the name of a pest now?
Yes
3
No
22
Check to see whether there is any information collected already, or a PRA has been written. General CABI CPC (Crop Protection Compendium) CABI FC (Forestry Compendium) Plant Health Information Warehouse (PHIW) EPPO PQR – Plant Quarantine Information Retrieval system EPPO website, EPPO Reporting Service, Registered files (PPH and PPP), EPPO QPE (Quarantine Pests for Europe) data sheets / Smith et al. (1997) CABI/EPPO (1998) Distribution maps of quarantine pests for Europe CABI/CMI/CIE (various years) Distribution maps of pests and diseases www.efsa.europa.eu/publications
354
EFSA Supporting publication 2016:EN-1062
The present document has been produced and adopted by the bodies identified above as authors. This task has been carried out exclusively by the authors in the context of a contract between the European Food Safety Authority and the authors, awarded following a tender procedure. The present document is published complying with the transparency principle to which the Authority is subject. It may not be considered as an output adopted by the Authority. The European Food Safety Authority reserves its rights, view and position as regards the issues addressed and the conclusions reached in the present document, without prejudice to the rights of the authors.
Quantitative Pathway Analysis QPAFood
Buczacki et al., 2005 Invertebrate Pests Fera database INFServb “biology”, Fauna Europaea, Hill, (1983, tropical pests), Hill, (1987, temperate pests). Diseases Fungal Records Database of Britain and Ireland Farr et al. (undated) Cannon et al. 1985 (Ascomycetes) Legon et al., 2005 (Basidiomyctes) Ellis & Ellis (1985) (Microfungi) Moore (1959) Pathogenic fungi Bradbury (1986) (Bacteria) NCPPB (on PHIW) (Bacteria) No. Question
Answer
Go to
ICTVdB (Viruses) DPVWeb (Viruses) Baker (1972) (Diseases) Smith et al., 1988 (Diseases) New Disease Reports Plant Disease Notes (APS) Pro-Med Plant Disease Reports Do you need more information?
6.
Yes No
6 STOP
What sort of information do you need?
Status in legislation
7
Interception Reports
8
Geographic distribution
9
Climate in present geographical distribution
10
Plant host range
11
General Pest Biology
12
Economic importance / commodity imports/exports
18
Pathways
19
www.efsa.europa.eu/publications
355
EFSA Supporting publication 2016:EN-1062
The present document has been produced and adopted by the bodies identified above as authors. This task has been carried out exclusively by the authors in the context of a contract between the European Food Safety Authority and the authors, awarded following a tender procedure. The present document is published complying with the transparency principle to which the Authority is subject. It may not be considered as an output adopted by the Authority. The European Food Safety Authority reserves its rights, view and position as regards the issues addressed and the conclusions reached in the present document, without prejudice to the rights of the authors.
Quantitative Pathway Analysis QPAFood
7.
Control options
20
A picture / photo / image
21
Other
17
Status in legislation: try sources such as
EC Plant Health Directive 2000/29/EC (pdf online), EPPO website, EPPO PQR, Plant Health Information Warehouse (including policy decisions section) SOCPHIR – Summaries of Overseas Countries Plant Health Import Regulations, IPPC website EPPO QPE data sheets / Smith et al. (1997). Do you need more information?
8.
Yes
6
No
STOP
Interception reports: try sources such as - Diagnosis database (E-diag, CSL database, data from Jan. 1996), - EPPO Reporting Service, - eDOMERO (2006 – present), DOMERO 2000 (2000 – 2005), DOMERO 93 (1993 – 2000), Old DOMERO (1988 – 1993), Interception reports (1975-1985: hard copy), - PHD summaries of PHSI import interceptions, - EPPO intercepted consignments (PPP 5029 (CL), PPP 6819 (CL)),
No. Question
Answer
Go to
EUROPHYT – (FIS) CIRCA (online database), EU interception reports - EU Notification of interceptions from other EC countries (PPP 6337 (CL), 8688 (CL)), - EU Notification to EC Commission and Member States of pest and disease interceptions, incidents and outbreaks (PPP 5600 EC/TC (CL), PPP 8257 (CL)), - Spreadsheet of EU Notifications of findings by NPPOs (1995-2005) - FVO (Food and Veterinary Office) – online, - PPH 2948 and 3630 – reports of invertebrates new to the UK - PPH 3156 – lists and reports of invertebrates (including pest invertebrates) new or invasive in overseas countries (i.e. not UK). PPP 12043 New UK Disease Records Pathdiary on the PHIW www.efsa.europa.eu/publications
356
EFSA Supporting publication 2016:EN-1062
The present document has been produced and adopted by the bodies identified above as authors. This task has been carried out exclusively by the authors in the context of a contract between the European Food Safety Authority and the authors, awarded following a tender procedure. The present document is published complying with the transparency principle to which the Authority is subject. It may not be considered as an output adopted by the Authority. The European Food Safety Authority reserves its rights, view and position as regards the issues addressed and the conclusions reached in the present document, without prejudice to the rights of the authors.
Quantitative Pathway Analysis QPAFood
Do you need more information?
Yes
6
No
STOP
Geographic distribution: is it native to the UK / Europe? General sources CABI/CMI/CIE (various years) Distribution maps of pests and diseases, CABI/EPPO (1998) Distribution maps of Quarantine Pests for Europe, CABI CPC, CABI FC, EPPO PQR, EPPO Reporting Service, Information Centre also has literature on specific geographic regions see: Plant pests 632 Crops 633.1 Invertebrate pests: INFServb “biology”, ScaleNet - online, Pest Fruit Flies of the World – online. Search Information Centre by taxon group – books often look at a specific geographic region, e.g.: General insect literature 595.7 Aphids 595.752 Coleoptera 595.76 Diptera 595.77 To check for invertebrate pest presence in the UK try Information Centre sections above, but in particular: - Kloet & Hinks (various years) for insects in general, - Maitland, Emmett & Heath (1992) for Lepidoptera, - Evans et al. (1961) for mites, also see J. Starzewski, who has been drafting a more up to date checklist, - Evans et al. (1993) and Luc et al. (2005) for nematodes, - Chandler (ed.) (1998) for Diptera., also online at DipteristsForum. No. Question
Answer
Go to
National Biodiversity Network’s Species Dictionary – online, LepIndex – online, Leafmines – online, The Coleopterist – online.
www.efsa.europa.eu/publications
357
EFSA Supporting publication 2016:EN-1062
The present document has been produced and adopted by the bodies identified above as authors. This task has been carried out exclusively by the authors in the context of a contract between the European Food Safety Authority and the authors, awarded following a tender procedure. The present document is published complying with the transparency principle to which the Authority is subject. It may not be considered as an output adopted by the Authority. The European Food Safety Authority reserves its rights, view and position as regards the issues addressed and the conclusions reached in the present document, without prejudice to the rights of the authors.
Quantitative Pathway Analysis QPAFood
For diseases, please use the same references as in question 5. Ask Information Centre for an online literature search, including zoological record, (remember that such a search does not pick up any books, or papers published before 1972). Do you need more information?
10.
Yes
6
No
STOP
Climatic data on a geographical area: try sources such as HMSO (1972) – for Europe FAO (1984a & b) and HMSO (1983) – for Africa FAO (1987a & b) – for Asia HMSO (1980) – for North America FAO (1985) – for South America and the Caribbean Pearce & Smith (1990) – for the world CLIMEX (on Alan’s PC) – uses climatic data from 1931-1960 World Meteorological Organization (WMO) (online) MET Office – climate averages (online) Check literature searches for population data e.g. degree day models for invertebrates
Do you need more information
11.
Yes
1 or 6
No
STOP
Plant host range: try sources such as EPPO PQR, PPH and PPP files, Invertebrate pests: try INFServb “biology” Search Information Centre by pest order, e.g.: - Hemiptera 595.75 - Coleoptera 595.76 - Diptera 595.77 - Lepidoptera 595.78 Diseases: Fungal Records Database of Britain and Ireland Farr et al (undated) Moore (1959) (Pathogenic fungi)
www.efsa.europa.eu/publications
358
EFSA Supporting publication 2016:EN-1062
The present document has been produced and adopted by the bodies identified above as authors. This task has been carried out exclusively by the authors in the context of a contract between the European Food Safety Authority and the authors, awarded following a tender procedure. The present document is published complying with the transparency principle to which the Authority is subject. It may not be considered as an output adopted by the Authority. The European Food Safety Authority reserves its rights, view and position as regards the issues addressed and the conclusions reached in the present document, without prejudice to the rights of the authors.
Quantitative Pathway Analysis QPAFood
Bradbury (1986) (Bacteria) NCPPB (on PHIW) (Bacteria) ICTVdB (Viruses) DPVWeb (Viruses)
www.efsa.europa.eu/publications
359
EFSA Supporting publication 2016:EN-1062
The present document has been produced and adopted by the bodies identified above as authors. This task has been carried out exclusively by the authors in the context of a contract between the European Food Safety Authority and the authors, awarded following a tender procedure. The present document is published complying with the transparency principle to which the Authority is subject. It may not be considered as an output adopted by the Authority. The European Food Safety Authority reserves its rights, view and position as regards the issues addressed and the conclusions reached in the present document, without prejudice to the rights of the authors.
Quantitative Pathway Analysis QPAFood
No. Question
Answer
Do you need more information?
12.
Go to Yes
6
No
STOP
General pest biology: try sources such as - Search Information Centre IPAC catalogue (use keywords), - the Internet e.g. CABI CPC, CABI FC, - Search on Web of Knowledge, INGENTACONNECT and OVID (all through Athens) also Google (Scholar) – use keywords - Ask Information Centre staff for an on-line literature search. (see also 9 - specialist websites). Invertebrates: Alford (1991, 1999 and 2007), Arnett (2000), Hill (1983), Hill (1987), INFServb “biology”, Davidson & Lyon (1987), Metcalf & Metcalf (1993), For nematodes try Willmott et al. (CIH data sheets) Search filing cabinet (Room 02FA07) pests listed alphabetically by Genus, Disease:
Agrios (2005) (General Plant Pathology text)
Waller et al. (2005) (General Plant Pathology text) Carlile et al. (2001) (General text on fungi) Do you need more information?
13.
14.
Yes
6
No
STOP
Do you have the name of a particular plant, crop or commodity? Yes
14
No
15
Information about a plant, crop or commodity: try sources such as General: De Rougemont (1989), Mabberley (1997), Anon. (2005), Howes (1974), Tutin et al., (1964-1980), The International Plant Names Index (online).
www.efsa.europa.eu/publications
360
EFSA Supporting publication 2016:EN-1062
The present document has been produced and adopted by the bodies identified above as authors. This task has been carried out exclusively by the authors in the context of a contract between the European Food Safety Authority and the authors, awarded following a tender procedure. The present document is published complying with the transparency principle to which the Authority is subject. It may not be considered as an output adopted by the Authority. The European Food Safety Authority reserves its rights, view and position as regards the issues addressed and the conclusions reached in the present document, without prejudice to the rights of the authors.
Quantitative Pathway Analysis QPAFood
Location: Flora of North America (online), Preston et al. (New Atlas of British and Irish Flora) (2002) Tutin et al. (Flora Europaea – 5 volumes) (1964-1980) Flora Europaea (online), BSBI Atlas (online) DEFRA Agricultural Census (online) Information on crop husbandry and growing methods Search Information Centre by crop e.g.: Cereals 633.1 Grasses 633.2 Potatoes 633.491 Forest and Aboriculture 634 No. Question
Answer
Go to
Fruit Growing 634.1/.7 Ornamentals 635.9 Search internet for sites on specific industries.
Economic information on crops / commodities: try sources such as DEFRA Basic Hort. Stats., FAO Statistics, The PHSI IMPS (imports) database, PHSI Imports Summary (PPP 2149 (CL)), Nix et al. (annual), Beaton (annual), Brookes (2005). Search Information Centre e.g.: - Agriculture 63 - Farming 631 For information about imports / exports, see also Question 18. Information about pests on a crop / commodity: try sources such as EPPO PQR, INFServb “biology”, Search Information Centre by crop – see crop husbandry Search filing cabinet (Room 02FA07) arranged alphabetically by commodity. APS compendia of pests and diseases 15.
Do you have the name of a geographic area?
16.
Information on geographic areas: try sources such as:
Yes No
16 17
EPPO PQR, INFServb “biology”, Search Information Centre for books by country / region, Search filing cabinet (Room 02FA07) alphabetical by country. www.efsa.europa.eu/publications
361
EFSA Supporting publication 2016:EN-1062
The present document has been produced and adopted by the bodies identified above as authors. This task has been carried out exclusively by the authors in the context of a contract between the European Food Safety Authority and the authors, awarded following a tender procedure. The present document is published complying with the transparency principle to which the Authority is subject. It may not be considered as an output adopted by the Authority. The European Food Safety Authority reserves its rights, view and position as regards the issues addressed and the conclusions reached in the present document, without prejudice to the rights of the authors.
Quantitative Pathway Analysis QPAFood
For information about climate, go to Question 10.
17.
Search Information Centre IPAC computer system – use keywords, Conduct a literature search on sites such as Web of Knowledge, INGENTACONNECT and OVID (all through Athens) also Google (Scholar) – use keywords, Ask Information Centre staff for an on-line literature search. Conduct a general internet search e.g. Google. Do you have the information you need now?
No. Question 18.
Answer
Yes
1
No
22
Go to
Economic Impact: General: try sources such as: Search Information Centre e.g.: - Plant pests 632.7/.7 - Insects pests 632.7 - Crop loss assessment 632.03 Search on Web of Knowledge, INGENTACONNECT and OVID (all through Athens) also Google (Scholar) – use keywords, Ask Information Centre staff for an on-line literature search. See “Disease and yield loss assessment” chapter in Waller et al. (2005) and references therein See also Question 14 Information on the quantity and value of commodity imports and exports: try sources such as: DEFRA Economics and Statistics department – personal requests may be made through Plant Health Division. FAO Statistics – the website has data on imports by commodity
Do you need more information?
19.
Yes No
6 STOP
Pathways: try sources such as FAO Statistics – information on imports by commodity Contact Sam Bishop for information on licensing Conduct a general internet search e.g. Google for a particular commodity
Do you need more information?
www.efsa.europa.eu/publications
Yes No 362
6 STOP EFSA Supporting publication 2016:EN-1062
The present document has been produced and adopted by the bodies identified above as authors. This task has been carried out exclusively by the authors in the context of a contract between the European Food Safety Authority and the authors, awarded following a tender procedure. The present document is published complying with the transparency principle to which the Authority is subject. It may not be considered as an output adopted by the Authority. The European Food Safety Authority reserves its rights, view and position as regards the issues addressed and the conclusions reached in the present document, without prejudice to the rights of the authors.
Quantitative Pathway Analysis QPAFood
20.
Control / Management options: try sources such as PPH files, Liaison, Chemform, Whitehead (2006), Tomlin (2003), Search Information Centre e.g.: - Control methods 632.93 - Biocontrol 632.937 - Pesticides 632.95 Search on Web of Knowledge, INGENTACONNECT and OVID (all through Athens) also Google (Scholar) – use keywords, Ask the Information Centre staff for an on-line literature search. Action recommendation files (See Dominic/Helen) Do you need more information
No. Question 21.
Yes
1
No
STOP
Answer
Go to
Picture/photo/image of a pest / pests’ damage: try sources such as: Smith & Roy (1996), the PHIW Image Library, Search the Information Centre IPAC system for slides Search on Web of Knowledge, INGENTACONNECT and OVID (all through Athens) also Google (Scholar) – use keywords, Search the World Wide Web, Search in trade press and industry journals, Ask the Information Centre for an on-line literature search. Phot database (CSL Intranet) Do you need more information?
22.
Yes
6
No
STOP
Go back to the original request and check what is needed.
www.efsa.europa.eu/publications
363
EFSA Supporting publication 2016:EN-1062
The present document has been produced and adopted by the bodies identified above as authors. This task has been carried out exclusively by the authors in the context of a contract between the European Food Safety Authority and the authors, awarded following a tender procedure. The present document is published complying with the transparency principle to which the Authority is subject. It may not be considered as an output adopted by the Authority. The European Food Safety Authority reserves its rights, view and position as regards the issues addressed and the conclusions reached in the present document, without prejudice to the rights of the authors.
Quantitative Pathway Analysis QPAFood
www.efsa.europa.eu/publications
364
EFSA Supporting publication 2016:EN-1062
The present document has been produced and adopted by the bodies identified above as authors. This task has been carried out exclusively by the authors in the context of a contract between the European Food Safety Authority and the authors, awarded following a tender procedure. The present document is published complying with the transparency principle to which the Authority is subject. It may not be considered as an output adopted by the Authority. The European Food Safety Authority reserves its rights, view and position as regards the issues addressed and the conclusions reached in the present document, without prejudice to the rights of the authors.
Quantitative Pathway Analysis QPAFood
Information Sources Commonly Used During Intelligence Gathering
Agrios, G.N. (2005) Plant Pathology. Elsevier Academic Press. (02FA03//library) Alford, D.V. (1991) A colour atlas of pests of ornamental trees, shrubs and flowers. London Wolfe, 448pp. (Lab. 02F04 and Information Centre: REF 635.9-2.6/.7/ALF). Alford, D.V. (1999) A textbook of Agricultural Entomology. Blackwell Science, 314pp. (Information Centre: REF 632.7/ALF). Alford, D.V. (2007) Pests of Fruit Crops – a colour handbook. Mansion Publishing Ltd, pp. (Lab. 02F04). Anon. (1975-1985) Interception reports: Insects & other invertebrates found in plant material imported into England & Wales (compiled by CSL) (In Room 02FA07). Anon. (1989) Invertebrates Of Economic Importance in Britain, Common and Scientific Names. 3rd Edn. HMSO MAFF London, 132pp (Copy in PRA Library, Room 02FA06 and older copy in Information Centre: REF 03:594/5 Gre). Anon. (2005) The RHS Plant Finder 04 – 05, 17th Edn., Dorling Kindersley Books, 952pp (Information Centre 085:ROY and information also available online). Anon. (1999) The New Royal Horticultural Society Dictionary of Gardening (4 Volumes), Macmillan Press. (Information Centre: REF 635 (03) ROY). APS compendia – various years. Published by the American Phytopathological Society (available in library of mycology lab) Arnett R.H. (2000) American Insects – a handbook of the insects of America north of Mexico, 2nd edn., Van Nostrand Reinhold, New York, 850pp (Information Centre: REF 595.7(7)/Arn). Baker, J.J. (1972) Report on diseases of cultivated plants in England & Wales for the years 1957-1968. Technical Bulletin, MAFF 25, 322pp. (Mycology Lab) Beaton, C. (Ed.) (2006) The Farm Management Handbook 2006/07 – The UK reference for farm business management (27th edn.), SAC, 517pp (Information Centre: REF 631.1BRA). Brookes, G. (2005) European arable crop profit margins 2004/2005, Brookes West, Canterbury, 277pp (Information Centre: REF 631.1BRO). Bosik, J.J. (Ed.) (1997) Common names of insects and related organisms. Entomological Society of America, 232pp. (Copy in PRA library, Room 02FA06 and older copies in information Centre: REF 03:595.7 ENT). Bradbury. J.F. (1986) Guide to Plant Pathogenic Bacteria. CAB International. (02FA03/mycology lab) Buczacki, S.T., Harris, K.M., Hargreaves, B. (2005). Pests, Diseases and Disorders of Garden Plants. Collins. (Information Centre: REF 635.2/BUC) CABI Arthropod Name Index on CD-Rom (1996). Gives information on synonyms and links to old Review of Applied Entomology volumes (including pre 1973) (Information Centre: ask at the desk). CABI Distribution maps of Quarantine Pests for Europe (1998) Distribution maps of quarantine pests for the European Union and for the European and Mediterranean Plant Protection Organisation, CABI publishing and EPPO (Lab 02F04). CABI Maps No. 1-550, Distribution maps for pests, CABI Wallingford (Information Centre: Next to Review of Applied Entomology, in journal section).
www.efsa.europa.eu/publications
365
EFSA Supporting publication 2016:EN-1062
The present document has been produced and adopted by the bodies identified above as authors. This task has been carried out exclusively by the authors in the context of a contract between the European Food Safety Authority and the authors, awarded following a tender procedure. The present document is published complying with the transparency principle to which the Authority is subject. It may not be considered as an output adopted by the Authority. The European Food Safety Authority reserves its rights, view and position as regards the issues addressed and the conclusions reached in the present document, without prejudice to the rights of the authors.
Quantitative Pathway Analysis QPAFood
Carlile, M.J., Watkinson, S.C., Gooday G.W. (2001) The Fungi 2nd Edition. Elsevier Academic Press. (Library). Cannon, P.F., Hawksworth, D.L., Sherwood-Pike, M.A., (1985). The British Ascomycotina: An Annotated Checklist. Commonwealth Agricultural Bureaux. (02FA03/mycology lab) Chandler, P. (Ed.) (1998) Checklists of Insects of the British Isles (New Series) Part 1 DIPTERA, Handbooks for the Volume 12 Identification of British Insects, Royal Entomological Society, 234pp (Lab. 02F04). CLIMEX – programme which looks at climatic data (1931-1960) from around the world (available on Alan and Richard’s PC’s. Currently waiting for an update). Davidson, R.H. & Lyon, W.F. (1987) Insect Pests of farm, garden and orchard. 8th Edn. John Wiley, Chichester, 640pp. (Lab. 02F04 and Information Centre: REF 632.6/.7 DAV). De Rougemont, G.M. (1989) A field guide to the crops of Britain and Europe, Collins, London, 367pp. (Information Centre: REF 581.9(4)/RO). Derwent Publications (Eds.) (1990) Thesaurus of Agricultural Organisms: Pests, Weeds & Diseases, Chapman & Hall, London, 2 Volumes. (Information Centre: REF 03.63 Der). Diagnosis database (1996 – present) The Plant Health Diagnosis Database (E-diag) – interception / diagnosis database. (available on secure pages of CSL Intranet and through the PHIW). DOMERO (1988 – present) The PHSI database and recording system for visits and outbreak reports. Prior to this were the interceptions reports, although there is a gap in the records in 1986-87. There are a number of versions of DOMERO, and permission to access information from ALL versions has to be obtained (and carried out by) the PHSI. Ellis, M.B., & Ellis, J.P. (1985) Microfungi on Land Plants. Croom Helm Ltd. (02FA03/mycology lab) EPPO QPE data sheets (1997) – EPPO QPE Book (1997), data sheets on quarantine pests (Available on T:/PLH/Shared/EPPO QPE book (1997) and also as hard copy, see Smith et al. (1997)). EPPO PQR version 5.3.2 (Sept 2014) EPPO Plant Quarantine Data Retrieval System – Updated periodically. Also available for download at: http://www.eppo.org/DATABASES/pqr/pqr.htm EPPO Reporting Service (Monthly) – EPPO Monthly Reporting Service. Available online (see EPPO website). Records from Jan 1998 stored at T:/Plh/Shared/EPPO RS/. Older records found as paper files PPP 5771, 5771A, 8660 (CL). Esser, R.P. (1991) A computer ready check list of the genera and species of phytoparasitic nematodes, including a list of mnemonically coded subject categories. Florida Dept. of Agriculture and Consumer Services, 185pp. (Information Centre: REF 632.651/Ess). Evans, G.O., Sheals, J.G. & Macfarlane, D. (1961) The terrestrial Acari of the British Isles: An introduction to their morphology, biology and classification Volume 1, Introduction and Biology, British Museum (Natural History), London, 220pp. (Information Centre: REF 595.42). Evans, K., Trudgill, D.L.& Webster, J.M. Eds. (1993) Plant Parasitic Nematodes in temperate Agriculture. CAB International, Wallingford, 648pp. (Sue Hockland has a copy in Room 02F05) EU Notifications of findings by NPPOs 1995-2005 – a spreadsheet listing notifications of pests detected as interceptions, and other plant passport infringements, notified to the European Commission by plant health services in Member States. N.B. may be some double counting of an interception as document contains provisional and final notifications (T:/plh/shared/pra/EC notifications 1995-2005.xls). www.efsa.europa.eu/publications
366
EFSA Supporting publication 2016:EN-1062
The present document has been produced and adopted by the bodies identified above as authors. This task has been carried out exclusively by the authors in the context of a contract between the European Food Safety Authority and the authors, awarded following a tender procedure. The present document is published complying with the transparency principle to which the Authority is subject. It may not be considered as an output adopted by the Authority. The European Food Safety Authority reserves its rights, view and position as regards the issues addressed and the conclusions reached in the present document, without prejudice to the rights of the authors.
Quantitative Pathway Analysis QPAFood
FAO (1984a) Agroclimaticological data for Africa. Volume I Countries North of the equator, Plant production and Protection Series No. 22, FAO, Rome. (Information Centre: REF 551.582.2 (5) FOO). FAO (1984b) Agroclimaticological data for Africa. Volume II Countries South of the equator, Plant Production and Protection Series No. 22, FAO, Rome. (Information Centre: REF 551.582.2 (5) FOO). FAO (1985) Agroclimaticological data for Latin America and the Caribbean, Plant Production and Protection Series No. 24, FAO, Rome. (Information Centre: REF 551.582.2 (5) FOO). FAO (1987a) Agroclimaticological data for Asia, Volume I Countries A-J, Plant Production and Protection Series No. 25, FAO, Rome. (Information Centre: REF 551.582.2 (5) FOO). FAO (1987b) Agroclimaticological data for Asia, Volume II Countries K-Z, Plant Production and Protection Series No. 25, FAO, Rome. (Information Centre: REF 551.582.2 (5) FOO). Farnworth, J. (1997) Agri Info – Guidelines for world crop and livestock production, John Wiley, Chichester, 576pp. (Information Centre: REF 31:63/Far). Gratwick, M. (Ed.) (1992) Crop pests in the UK – collected MAFF leaflets, Chapman & Hall, London, 490pp. (Information Centre: 632.7 (410) MIN and Sue Hockland, Room 02F05 and Lab. 02F04). Gilbert, P & Hamilton, C.J. (1990) Entomology – A guide to information sources, Mansell, London, 259pp. (Information Centre: REF 058:595.7/GIL, and older version available in PRA library, Room 02FA06). Hill, D.S. (1983) Agricultural Insect Pests of the Tropics and their control, 2nd Edn., Cambridge University Press, London, 746pp. (Lab 02F04 and older copy in Information Centre: REF 632.9(213)/HIL). Hill, D.S. (1987) Agricultural Insect Pests of Temperate Regions and their control, Cambridge University Press, London, 660pp. (Lab 02F04 and Information Centre: REF 632.9 (213) / HIL). Hill, D.S. (1997) The Economic Importance of Insects, Chapman & Hall, London, 395pp. (Information Centre: REF 632.7 / HIL). HMSO (1972) Tables of temperature, relative humidity, precipitation & sunshine for the world, Part 3, Europe and the Azores, HMSO, London. (Information Centre: REF 551.582.2 Met). HMSO (1980) Tables of temperature, relative humidity, precipitation & sunshine for the world, Part 1, North America & Greenland (including Hawaii and Bermuda), HMSO, London. (Information Centre: REF 551.582.2 Met). HMSO (1983) Tables of temperature, relative humidity, precipitation & sunshine for the world, Part 4, Africa, the Atlantic Ocean south of 35ºN and the Indian Ocean, HMSO, London. (Information Centre REF: 551.582.2 Met). Hollis D. (Ed.) (1980) Animal Identification: A reference guide, Volume 3: Insects, John Wiley & Sons, Chichester, 160pp. (Information Centre: REF 595.7 Hol – may need to ask for help finding this). Howes, F.N. (1974) A dictionary of useful and everyday plants and their common names, Cambridge University Press, 290pp. (Information Centre REF: 03:58 How). INFServb “biology” – the old Pest Biology Database from Harpm. List of pests on this held in Alan’s office (available at CSL INFServb “biology” on PC). Interception reports (1975-1985) PHSI Interception Records prior to DOMERO. Paper records (available in Room 02FA07). www.efsa.europa.eu/publications
367
EFSA Supporting publication 2016:EN-1062
The present document has been produced and adopted by the bodies identified above as authors. This task has been carried out exclusively by the authors in the context of a contract between the European Food Safety Authority and the authors, awarded following a tender procedure. The present document is published complying with the transparency principle to which the Authority is subject. It may not be considered as an output adopted by the Authority. The European Food Safety Authority reserves its rights, view and position as regards the issues addressed and the conclusions reached in the present document, without prejudice to the rights of the authors.
Quantitative Pathway Analysis QPAFood
Jeppson, L.R., Keiffer, H.H. & Baker, E.W. (1975) Mites Injurious to Economic Plants, University of California Press, Berkley, 614pp (Lab 02F04 and Information Centre: 632.7 JEP). Kloet G.S. & Hinks W.D. (various years) A check list of British Insects Parts 1 to 5, Royal Entomological Society, London. (Information Centre: 595.7 Roy). Legon, N.W., Henrici, A. (2005). Checklist of the British & Irish Basidiomycota. Kew Gardens. (02FA03). Luc, M., Sikora, R.A. & Bridge, J. Eds. (2005) Plant Parasitic Nematodes in Subtropical and tropical Agriculture. CAB International, Wallingford, 871pp. (Sue Hockland has a copy, Room 02F05) Mabberley, D.J. (1997) The plant book, a portable dictionary of higher plants. 2nd Edition. Cambridge, 857pp. (Information Centre: 03:58/MAB). Maitland Emmet, A. & Heath, J. (1991) The moths and butterflies of Great Britain and Ireland, Volume 7, Part 2, Lasiocampidae – Thyatiridae with Life History Chart of the British Lepidoptera, Harley Books, Colchester, 400pp. (Richard Baker’s personal copy Room 02FA05; Information Centre: REF 595.78(410)/EMM). Metcalf, R.L. & Metcalf, R.A. (1993) Destructive & Useful Insects, 5th Edn., McGraw-Hill, New York. (Information Centre: REF 595.7 MET). Moore, W.C. (1959) British Parasitic Fungi. Cambridge University Press. (02FA03/mycology lab/library) Nix, J., Hill, P. & Edwards, A. (2006) Farm Management Pocketbook (36th Edn.), Imperial College London, 264pp. (Information Centre: REF 631.1/NIX). Pearce, E.A. & Smith, C.G. (1990) The world weather guide, Hutchinson, London, 480pp. (Information Centre: REF 551.582.2 Pea). PHIW (Ongoing) Plant Health Information Warehouse – on secure pages of Intranet. PHSI IMPS (imports) database (ongoing) – data collated by customs which PHSI have access to. Available by request to PHSI. Preston, C.D., Pearman, D.A. & Dines, T.D. (2002) New atlas of the British and Irish Flora, Oxford University Press, 910pp. (Information Centre: REF 581.9(41)PRE and also (and more up to date) on CD Rom, downloadable to PC). Registered files (PPH and PPP) (Ongoing) Listed on Intranet under Information Centre, filed in Room 02F09. Also search for titles using keywords on Genservc via “PUTTY”. Schaeffer & Panizzi (2000) Heteroptera of Economic Importance, CRC Press LLC, 828pp. (Information centre: REF 595.754/SCH). SOCPHIR – Summaries of Overseas Countries Plant Health Import Regulations. Blue files containing by country lists of phytosanitary import regulations, including updates on the legislation. (Copies throughout PLH, main source with Sam Bishop, Room 02FA03. Also available on: T:\PLH\PLHA\Folders\Eails\Trade\Exports|SOCPHIR\All SOCPHIRS). Smith, I.M., Dunez, J., Lelliott, R.A., Phillips, D.H., Archer, S.A. (1988). European Handbook of Plant Diseases. Blackwell Scientific Publications, Oxford. Smith, I.M., McNamara, D.G., Scott, P.R. & Harris, K.M. (Eds.) (1997) Quarantine Pests for Europe, 2nd Edn., EPPO / CABI, Wallingford, 1425pp. (Copy in Room 02FA06, also available on t/ph/shared/EPPO QPE book (1997). Older edition (1992) in Information Centre: REF 632 SMI and 632(4) CAB). www.efsa.europa.eu/publications
368
EFSA Supporting publication 2016:EN-1062
The present document has been produced and adopted by the bodies identified above as authors. This task has been carried out exclusively by the authors in the context of a contract between the European Food Safety Authority and the authors, awarded following a tender procedure. The present document is published complying with the transparency principle to which the Authority is subject. It may not be considered as an output adopted by the Authority. The European Food Safety Authority reserves its rights, view and position as regards the issues addressed and the conclusions reached in the present document, without prejudice to the rights of the authors.
Quantitative Pathway Analysis QPAFood
Smith, I.M. & Roy, A.S. (Eds.) (1996) Illustrations of Quarantine Pests for Europe, EPPO / CABI, Wallingford, 241pp (Information Centre: REF 632(4)/EPP). Tomlin, C. (2003) The World Compendium – The Pesticide Manual (13th edn.), BCPC Publications, Hamps., 1344pp. (Room 02FA07). Tutin et al., (1964-1980) Flora Europaea, 5 Volumes, (1964-1980). Also a separate consolidated index. Cambridge University Press. (Information Centre: REF 581.9 (4) TUT). Waller, J.M., Lenne, J.M., Waller., S.J. (2005) Plant Pathologists Pocketbook 3rd Edition. CABI. (02FA03//library) Whitehead, R. (Ed.) (2006) The UK Pesticide Guide, CAB International, BCPC, Cambridge University, 637pp. (Room 02FA06 and Information Centre: REF 632.95CAB). Willmott, S., Gooch, P.S., Siddiqi, M.R. & Franklin, M. Eds. (Various years) Descriptions of plant parasitic nematodes – (Set 1, No 1-15 (1972) to Sey 8, No. 106-120 (1985)). Issued by the Commonwealth Institute of Helminthology. (See Sue Hockland, Some copies also in Room 02FA07). Wood, A.M. (1989) Insects of Economic Importance: a check list of preferred names. CAB International, Wallingford, 150pp. (Copy in PRA Library, Room 02FA06 and Information Centre: REF 03:595.7 Woo). Zeven, A.C. & de Wet, J.M.J (1982) Dictionary of cultivated plants and their regions of diversity, Wageningen, 263pp. (Information Centre: 03:58 Zev). N.B. Once you find a recent information source, you should check its references or bibliography to uncover key or previous references. Internet Sources Commonly Used During Intelligence Gathering N.B. When doing web searches for a pest or host don’t forget to use common, as well as Latin names. Searching using keywords on: Search engines: Webcrawler, Google, Excite, Yahoo, Lycos, Google (Scholar). Journal abstracts: Web of Knowledge, Ovid, Google (Scholar), Ingentaconnect.
Websites
AQIS - The Australian Quarantine and Inspection Service http://www.daff.gov.au/aqis Australian Museum Online - http://www.amonline.net.au/ BASIC HORT. STATS. BASIC HORTICULTURAL STATISTICS, DEFRA (Online). http://statistics.defra.gov.uk/esg/publications/bhs/default.asp BSBI Atlas – Botanical Society of the British Isles, vascular plant atlas update project. http://www.bsbimaps.org.uk/atlas/ Butterflies and Moths of North America - Occurrence maps, species accounts, checklists and photographs. http://www.butterfliesandmoths.org/ CABI CPC CABI Crop Protection Compendium (Online). http://www.cabi.org/compendia/cpc/index.htm CABI FC - CABI Forestry Compendium (Online). http://www.cabi.org/compendia/fc/ www.efsa.europa.eu/publications
369
EFSA Supporting publication 2016:EN-1062
The present document has been produced and adopted by the bodies identified above as authors. This task has been carried out exclusively by the authors in the context of a contract between the European Food Safety Authority and the authors, awarded following a tender procedure. The present document is published complying with the transparency principle to which the Authority is subject. It may not be considered as an output adopted by the Authority. The European Food Safety Authority reserves its rights, view and position as regards the issues addressed and the conclusions reached in the present document, without prejudice to the rights of the authors.
Quantitative Pathway Analysis QPAFood
The Coleopterist – contains the Checklist of Beetles of the British Isles Coleopterists http://www.coleopterist.org.uk/ CSIRO - CSIRO Entomology. http://www.ento.csiro.au/ Cullen AC and Frey HC, 1999. Probabilistic techniques in exposure assessment. Plenum Press, New York DEFRA Agricultural Census – data on crop types and land use at various levels. http://farmstats.defra.gov.uk/cs/farmstats_data/DATA/soa_data/repop_query.asp?type=3&disp= nuts1_id%2C+nuts3_id%2C+nuts4_id%2C+soa_id&submit=Go+to+next+step#steps DIPTERISTSFORUM - Checklists of Insects of the British Isles (New Series). Part 1: Diptera P.J. Chandler, 1998. Handbooks for the Identification of British Insects, 12: 1-234. http://www.dipteristsforum.org.u/ DPVWeb – Descriptions of plant viruses. http://www.dpvweb.net/ EFSA (European Food Safety Authority), (2008). Pest Risk Assessment. Science in support of phytosanitary decision-making in the European Community. EFSA Scientific Colloquium 10. EFSA (European Food Safety Authority), 2009b. Transparency in Risk Assessment – Guidance of the Scientific Committee on Transparency in the Scientific Aspects of Risk Assessments carried out by EFSA. Part 2: General principles. The EFSA Journal, 1051, 1–22. EFSA Panel on Plant Health (PLH) (2010); Guidance on a harmonised framework for pest risk assessment and the identification and evaluation of pest risk management options by EFSA. EFSA Journal 1495: 1-66 EFSA Panel on Plant Health (PLH); Scientific opinion on a quantitative pathway analysis of the likelihood of Tilletia indica M. introduction into EU with importation of US wheat. EFSA Journal 2010; 8(6):1621.. EPPO – European Plant Protection Organisation. http://www.eppo.org/ Farr, D.F., Rossman, A.Y., Palm, M.E., & McCray, E.B. (n.d.) Fungal Databases, Systematic Botany & Mycology Laboratory, ARS, USDA. Retrieved July 24, 2007, from http://nt.arsgrin.gov/fungaldatabases/ FAO Statistics - records from over 210 countries and territories covering statistics on agriculture, nutrition, fisheries, forestry, food aid, land use and population. http://faostat.fao.org/ Fauna Europaea - a database of the scientific names and distribution of all living multicellular European land and fresh-water animals. Names of relevant experts also given. http://www.faunaeur.org/index.php. Is also useful to follow links from this site to other useful online databases and lists. Flora Europaea – Royal Botanic Garden Edinburgh – on-line search with data extracted from the digital version of Flora Europaea. http://rbg-web2.rbge.org.uk/FE/fe.html Fowler G, Caton B, Jackson L, Neeley A, Bunce L, Borchert D, McDowell R, 2006. Quantitative pathway initiated pest risk assessment: risks to the Southern United States associated with pine shoot beetle, Tomicus piniperda (Linnaeus), (Coleoptera: Scolytidae), on pine bark nuggets, logs and lumber with bark and stumps from the United States quarantined area. United States Department of Agriculture Animal and Plant Health Inspection Service, Raleigh, NC, USA, June 2006, pp. 96. Available at http://www.aphis.usda.gov/plant_health/plant_pest_info/psb/downloads/southtimberpra.pdf www.efsa.europa.eu/publications
370
EFSA Supporting publication 2016:EN-1062
The present document has been produced and adopted by the bodies identified above as authors. This task has been carried out exclusively by the authors in the context of a contract between the European Food Safety Authority and the authors, awarded following a tender procedure. The present document is published complying with the transparency principle to which the Authority is subject. It may not be considered as an output adopted by the Authority. The European Food Safety Authority reserves its rights, view and position as regards the issues addressed and the conclusions reached in the present document, without prejudice to the rights of the authors.
Quantitative Pathway Analysis QPAFood
FNA – Flora of North America. http://hua.huh.harvard.edu/FNA/ Fungal Records Database of Britain and Ireland- http://194.203.77.76/fieldmycology/ FVO – Food and Veterinary Office: Run by the European Commission the FVO have an annual inspections programme, including plant health inspections. Reports can be viewed on http://ec.europa.eu/food/fvo/index_en.htm ICTVdB - Virus databases online. www.ncbi.nlm.nih.gov/ICTVdb/ Insects and Entomology / Iowa State Entomology Index of Internet Resources – directory and search engine for entomology related resources on the internet. http://www.ent.iastate.edu/list/ International Plant Names Index (IPNI) – collaboration between Kew Gardens, Harvard University Herbaria and the Australian National Herbarium. http://www.ipni.org/index.html IPPC – International Phytosanitary Portal https://www.ippc.int/IPP/En/default.jsp Leafminers - British Leafminers http://www.leafmines.co.uk/ Lepidoptera and some other life forms - http://www.funet.fi/pub/sci/bio/life/intro.html Lepindex – The Global Lepidoptera Names Index http://www.nhm.ac.uk/researchcuration/projects/lepindex/ Luciddcentral – University of Queensland, entomological keys. http://www.lucidcentral.org/keys/ MET Office: Climate averages - http://www.metoffice.gov.uk/climate/uk/averages/index.html NAPPO – North American Plant Protection Organisation. http://www.nappo.org NAPIS – National Agricultural Pest Information System (US). http://ceris.purdue.edu/napis/ National Biodiversity Network’s Species Dictionary – Natural History Museum, standard reference for names of organisms found in the United Kingdom. http://nbn.nhm.ac.uk/nhm/ NCBI Entrez Taxonomy Homepage - www.ncbi.nlm.nih.gov/sites/entrez?db=Taxonomy New Disease Reports - http://www.bspp.org.uk/ndr/ Pest Fruit Flies of the World – Guide to Diptera: Tephritidae. http://deltaintkey.com/ffl/www/_wintro.htm Peterson GL, Whitaker TB, Stefanski RJ, Podleckis EV, Phillips JC, Wu JS and Martinez WH, 2009. A risk assessment model for importation of United States milling wheat containing Tilletia controversa. Plant disease, 93: 560-573. Plant Pathology Internet Guide Book - http://www.pk.uni-bonn.de/ppigb/ppigb.htm Plant Disease Notes - http://www.apsnet.org/pd/ Pro Med Mail - http://www.promedmail.org/ RHS Plant Finder: online links to sections of the book http://www.rhs.org.uk/rhsplantfinder/plantfinder.asp Roberts RG, Hale CN, van der Zwet T., Miller CE and Redlin SC, 1998. The potential for spread of Erwinia amylovara and fire blight via commercial apple fruit: a critical review and risk assessment. Crop protection 17: 19-28. ScaleNet – all about scale insects http://www.sel.barc.usda.gov/scalenet/query.htm Stansbury CD, McKirdy SJ, Diggle AJ and Riley IT, 2002. Modeling the risk of entry, establishment, spread, containment, and economic impact of Tilletia indica, the cause of Karnal bunt of wheat, using an Australian context. Phytopathology 92:321-331.
www.efsa.europa.eu/publications
371
EFSA Supporting publication 2016:EN-1062
The present document has been produced and adopted by the bodies identified above as authors. This task has been carried out exclusively by the authors in the context of a contract between the European Food Safety Authority and the authors, awarded following a tender procedure. The present document is published complying with the transparency principle to which the Authority is subject. It may not be considered as an output adopted by the Authority. The European Food Safety Authority reserves its rights, view and position as regards the issues addressed and the conclusions reached in the present document, without prejudice to the rights of the authors.
Quantitative Pathway Analysis QPAFood
Systematic Entomology Laboratory – United States Department of Agriculture – Insect and Mite Identification Service. Includes links to many useful sites. http://www.ars.usda.gov/Main/site_main.htm?modecode=12-75-41-00 US APHIS Plant Health – US Department of Agriculture: Animal and Plant Health Inspection Service http://www.aphis.usda.gov/plant_health/index.shtml Whitefly Taxonomic and Ecological Website http://www.fscadpi.org/homoptera_hemiptera/Whitefly/whitefly_catalog.htm World Factbook – (A – Z Countries) CIA. https://www.cia.gov/library/publications/the-worldfactbook/geos/nz.html World Meteorological Organization (WMO) - http://www.wmo.int/pages/index_en.html
www.efsa.europa.eu/publications
372
EFSA Supporting publication 2016:EN-1062
The present document has been produced and adopted by the bodies identified above as authors. This task has been carried out exclusively by the authors in the context of a contract between the European Food Safety Authority and the authors, awarded following a tender procedure. The present document is published complying with the transparency principle to which the Authority is subject. It may not be considered as an output adopted by the Authority. The European Food Safety Authority reserves its rights, view and position as regards the issues addressed and the conclusions reached in the present document, without prejudice to the rights of the authors.