Development of Simulation Interfaces for Evaluation Task with the Use of Physiological Data and Virtual Reality Applied to a Vehicle Simulator. Mateus R. Mirandaa, Henrik Costaa, Luiz Oliveiraa, Thiago Bernardesa, Carla Aguiara, Cristiano Miossoa, Alessandro B. S. Oliveiraa, Alberto C.G.C. Dinizb & Diana Maria G. Dominguesa aLART
- Laboratory of Research in Art and TechnoScience Software Engineering, Electronic Engineering, Aerospace Engineering, Automotive Engineering Programs University of Brasilia at Gama, Brazil; bGDS - Dynamics of Systems Group Post Graduation in Mechanical Sciences Department of Mechanical Engineering, Faculty of Technology University of Brasilia, Brazil; ABSTRACT This paper aims at describing an experimental platform used to evaluate the performance of individuals at training immersive physiological games. The platform proposed is embedded in an immersive environment in a CAVE of Virtual Reality and consists on a base frame with actuators with three degrees of freedom, sensor array interface and physiological sensors. Physiological data of breathing, galvanic skin resistance (GSR) and pressure on the hand of the user and a subjective questionnaire were collected during the experiments. The theoretical background used in a project focused on Software Engineering, Biomedical Engineering in the field of Ergonomics and Creative Technologies in order to presents this case study, related of an evaluation of a vehicular simulator located inside the CAVE. The analysis of the simulator uses physiological data of the drivers obtained in a period of rest and after the experience, with and without movements at the simulator. Also images from the screen are captured through time at the embedded experience and data collected through physiological data visualization (average frequency and RMS graphics). They are empowered by the subjective questionnaire as strong lived experience provided by the technological apparatus. The performed immersion experience inside the CAVE allows to replicate behaviors from physical spaces inside data space enhanced by physiological properties. In this context, the biocybrid condition is expanded beyond art and entertainment, as it is applied to automotive engineering and biomedical engineering. In fact, the kinesthetic sensations amplified by synesthesia replicates the sensation of displacement in the interior of an automobile, as well as the sensations of vibration and vertical movements typical of a vehicle, different speeds, collisions, etc. The contribution of this work is the possibility to tracing a stress analysis protocol for drivers while operating a vehicle getting affective behaviors coming from physiological data, mixed to embedded simulation in Mixed Reality.
Keywords: Embodied experience, Synaesthesia, Physiological sensors, Training simulators, Mixed Reality
1. Introduction It is proposed a Mixed Reality application study, serious gaming concepts for training and its use empowered of physiological data in the area of Mechanical Engineering and Creative Technology, specifically the improvement of the product development process. This proposal aims at improving the integration and understanding between transdisciplinary groups working in development stages throughout the life cycle of a product. __________________________________ Further author information: e-mail:
[email protected],
[email protected],
[email protected],
[email protected],
[email protected],
[email protected],
[email protected],
[email protected],
[email protected].
The technological evolution of computer graphics (software) and electronic components (hardware) has provided a rapid evolution in virtual reality systems. In addition, embed system are a rich field to explore in creative technologies for human-computer interaction increasingly economic and further spread among ordinary users 1. The study of the scope of this work is to reconcile through a design of a universal simulator. Using a Mixed virtual reality simulator integrated in the early stages of development of a product life cycle 2 , In addition to the possibility to collect and analyze physiological data of the driver, new and more concrete design parameters can be obtained. These new design parameters are aimed at the initial stage of product design. The contribution of this work lies in the fact of adding to human-computer interaction mutual influence with the environment and the relationship with the physical phenomena by kinetic elements within an immersive environme nt of a CAVE and Mixed Reality devices. The innovation of the system is to add the acquisition of physiological data, correlating such elements to define parameters for the experience. These are very questions of enactives3 affective systems, which deal with physiological and computational data.
2. Objective This work focus on the design and construction of a universal vehicle simulator. In addition, users physiological data was taken, in order to analyze, in such environment, the user’s responses in any vehicle using the Mixed Reality, by taking the driver's physiological data. In this context, the objectives are: • Development of a car simulation software with specific roadmap for a controlled test, using concepts of serious games. • Acquisition of physiological signals of the driver, such as breathing, pressure on the palm and GSR (Galvanic Skin Resistance); • Collection of enactive affective states in the driver's shift / paths and interface with the dashboard (display data sent by car). The actions (enactions) of the driver inside the cockpit were studied through physiological analysis. According to their correlation, which could be the changes and possible solutions for the purpose of optimizing the cockpit of the project itself and the resulting act of direction.
3. Materials and Methodology The methodology consists on an experimental research, which apparatus is a universal car simulator using a scenario in Virtual Reality inside the CAVE and physiological sensors for measuring the driver's physiological data during immersion. Stereoscopic images change on large screen with stereoscopic images according the movement inside a car, following proprioception laws. All the apparatus (vehicle simulation software + simulation platform with motion + surround sound environment) allow the full immersion in synthetic environment. In correspondence all movements, this allows the experience to fully immerse into the virtual environment, together with the sensations of vertical movements and common side of a vehicle. The landscape, speed, driver attention, mainly the avoid the collisions are answered by the human/computer system in terms of physical sensations, in this case, through the breath, GSR, and pressure on the left hand palm. In this project, perceptual issues of action physiology are considered, and how these perceptions are manipulated by the interaction design, a phenomenology of perception and sense of movement 4. It should be noted that these perceptions are a source of research in neuroscience and enrich the variables of internal models of the brain, ways of dealing with bodily schemes and how the provided interfaces interfere on experience behavior of an interactive system. Such interactive systems, in recent research at LART were amplified by Domingues 5 with the denomination for enactive affective systems. In this case, since they are processes that deal with the actions of human beings who are affected by the environment (enactions), and exchange physiological signals in their vital states in data transmission. Technological advances have led to addition to the term interactive enactive by interlacing with the environment and mutual influences, and even emotional, the physiological changes, changing its name to affective enactive system. Therefore, a technological apparatus enables communication with the environment in acquisition and transmission and processing of physiological signals by actions that bring biological, mixed with computational data and influences that bring the hybrid qualities of the physical world.
Another quality of the embodiments in the Cave is the biocybrid condition, taking Peter Anders' concept of cybrid, enhanced by physiological signals 6 by configuring an experience of mixed realities (bio+cyber+hybrid).The performatic immersion experience inside the CAVE allows replicate behaviors from physical spaces inside data space enhanced by physiological properties. In this context, the biocybrid condition is expanded beyond art and entertainment, as it is applied to automotive engineering and biomedical engineering7 . The LART technological innovation searches to creative ways in order to expand awareness, training, acquire and view invisible aspects of the body (body-mind unit) and to measure biological states that were supplemented and to empower individuals to tasks previously impossible, by providing states of an expanded sensorium, Domingues5 . The use of enactive systems allows to expand perception by cognitive-emotional states translated in sound, light, heat, transduction biophysical phenomena in data visualization, or other technological language that records biophysical phenomena. In this case, including behavioral issues of physiology and human-environment cognition/human machine, which are thought in relation to the product design, for the purpose of applications in training, in actions involving danger, safety, rehabilitat ion and finally, product design, with an emphasis on Cognitive Ergonomics 8. The frame of the simulator experienced has the possibility of installing an automotive seat, with shift lever, pedals and steering wheel and respective displays for the CAVE’s screens. The positioning of these systems varies according to the cockpit design and standardization of SAE (Society of Automotive Engineering) 9 . The external environment and the view from inside the vehicle, simulating the panel and other parts of a vehicle shall be designed via Virtual Reality, within the environment of the CAVE with 3D images. The screens are positioned in front of the simulator, using stereoscopic images, in order to simulate a path seen, the landscape in the driver's perspective. The assembly of the 3D simulator in front of the screen increases the experiences of human sensations providing enactions to the physical space and data space blurring the synthetic virtual environment. Also, all the equipment of the simulator building a strong sensory continuum. To perform the simulation experiments the apparatus is composed by three main elements: • Vehicle Simulation Software; • Vehicle Simulator with motion capability; • Sensors to obtain physiological data and their interfaces. For the evaluation of the final embodied experience, we consider physiological data from ten volunteers and their subjective comments and objective data (anthropometrical data, time, velocity, etc). Available experimental data from breathing and GSR sensors. The pressure data from the hand of the volunteer and the steering wheel provides affective changes of the driver’s behavior. The subjective questionnaires are divided into: general and anthropometric data of volunteers, Questionnaire Pre-driving, After Driving and Physical Sensations. Then these data were compiled and analyzed, checking for correlations between the data and the reasons for each result.
3.1 – Simulation The software developed to perform simulation was done using the 3D Unity platform10 . The idea of the simulator is to generate critical danger situations along a highway, alluding to the Elk Test11. Prior to its launch, the new vehicle models undergo various safety tests, including Elk Test. This test consists of driving a vehicle at high speed on a road suddenly swerve to the track to the left and shortly after returning to the right. Thus, one can evaluate the stability in an emergency situation, it is necessary to divert some unexpected obstacle. Elk test is an example of a real situation of danger that a driver can come to witness while driving a vehicle. In the proposed route, the driver has the task of guiding the car, within safe speed limits, the Brasilia-Goiania highway and bypass when necessary obstacles on the road. The road topology was obtained from Google Maps in order to get greater realism. In the simulator environment, there will be no other vehicles transiting together with the user, the user is alone on the road and its only action is to drive the vehicle along the road, dodging the obstacles when they appear. To simulate the physics involved within the simulator, we used a programmable script within the Unity 3D environment, "Drivetrain" comes from the Car Unity Pro programming package 12 . The script was adjusted to the official
data of the actual vehicle and proved quite realistic within the simulation, with very consistent motor responses uphill, downhill and accelerations as well as the suspension, brakes and vehicle handling.
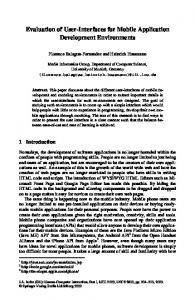
Figure 1 - Simulator image at the time when obstacles arise. The obstacles inserted along the road are modeled and motion cows, following the real scale and located in two distinct sections. Cows, although movement, are in a static position in the scene, and they are hidden visually by trees on the roadside. See Figure 1.
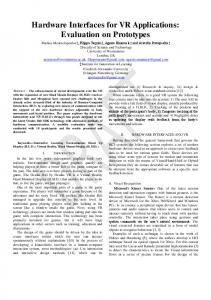
3.2 – Hardware of Vehicle Simulator The elements of the experimental apparatus were developed and / or selected in order to have a perfor mance during the experiment without much interference between the simulation itself and the driver. This allows to obtain a reliable experimental data and can be used for comparison between real situations, using field tests. The whole set was installed inside the CAVE LART so that the user can have a full immersion environment using Virtual Reality. The result in the final assembly can be seen in Figure 2.
Figure 2 - Simulator for the experimental tests in the CAVE. A software framework for access management and reading of physiological sensors was developed. The framework enables the integration of a large number of sensors. That there is a direct communication between the sensors in order to provide a more natural interaction and intuitive user with the platform. The framework is based on a UDP network architecture comprising of a server that manages the reading of the data from the sensors and each sensor is a client that sends readings periodically to the network. The data read by the sensors is sent through wireless network, and, in the present work the data read from the sensors are synchronized with the images automatically captured the printscreen on the screen. This data is then saved to a file for later analysis. Then the data are analyzed with the subjective questionnaire that was applied immediately after and for each volunteer.
For each simulation, it was taken three sets of physiological data for the same volunteer and subjective questionnaire. The first set of physiological data was obtained at the beginning of the experiment, while the volunteer is sit, and answering the pre-driving subjective questionnaire. The second set was obtained during the simulation without motion simulator. And the third set, using the motion simulator.
3.3 – Test protocol A test protocol was established and applied during the experiments in the simulator so that all tests with all participants had the same experimental procedure. For each volunteers, it was collected, synchronously, the following data: GSR, the breath and the pressure in the hand. These data were then transmitted wirelessly using a capture card and transmission TI eZ430-RF2500 Texas Instruments. The set of sensors placed in a volunteer sitting in the driving position simulator can be seen in Figures 3 (A and B).
A
B
h
h
e
e
a
a
n
n
a
a
l
l
y
y
Figure z3 - A volunteer sitting on the simulator and the sensors attached to his body (A) and A volunteer with the sensors z during the tests, sitting on the simulator within the CAVE.
e s
e 4. Experimentals Results
w Following the procedure described above, data from all subjects w were examined for making the simulator data with and without motion. The results below are for the tests on the simulator without movements. Then the results for the e with movements are shown in sub index 4.4. e simulator r events for the simulator without movements were analyzed The as follows: r 1 e– Rest time - about three minute and the beginning of the e simulation with the steering wheel press with your left hand three times;
d
d and action not crashing into them; 2 - Stress Moment 1 - View of the obstacles in the first leg 3 o- Stress Moment 2 - View of the obstacles in the secondoleg and action not crashing into them; 4 n- Final simulation with the fall of the vehicle when the track n ends. Each e of these events was marked on the charts in a ΔTimeeloop, taking the event just before and just after. Then, with the result of the subjective questionnaire data, graphs versus time data of GSR sensors, breathing and i and sets of images recorded for each of the selected events i pressure parse all tests in a coordinated manner.
n analysis of physiological breathing13 as was done in The n conjunction with both types of graphs plotted using MATLAB, which are: the graphic data with temporal average of the frequency values (Hz) which measured the breathing c rate andc variation graph RMS (Route Mean Square), which measured the intensity of breath, both in the times when the events occurred. o
o
n
n
j
j
u
u
n
n
c
c
t
t
i
i
4.1 Breathing The analyzes were done in conjunction with the two graphs, and for each of these graphics and for each of the volunteers were extracted control points, from 1 to 4. Then the curves of the average frequency and RMS were plotted for control events for each volunteer. See Figure 4. A comparison between the results of average frequency and RMS allows classifying the volunteers into four types according to their breathing characteristics. During the analysis, it was noted that of the 11 volunteers analyzed, 5 of them had a wheezing and strongly; one had a less wheezing and with low intensity and 5 volunteers ranged these characteristics. See Figure 6 and 7.
A
B
h
h
e
e
a
1
n
h
a l
e
a n
2 h
3
4
a
e
h
h
n
a
e
e
n
a
a
1
a l
h e
n
2
3
h
h
e
e
a
a
a
n
n
n
a
a
a
4 h e
y y Figure 4 - Graphics for Medium Frequency a events markings – Vol. 5. a n (A) and RMS (B) of breathing, with z
l
a
a
z
n
l l l l e l Vol1 a yAverage Frequency - Breathing y y Vol2 y y y s s 40 y Vol3 l z z z z Vol4 z z w w y Vol5 e z e e e Vol6 e 20 e e e z s e Vol7 s s s s Vol9 s r r e w s Vol10 w w w 0 w w e e VOL12 w s 0 2 4 e 6 8 10 12 Vol13 e e e e d d Events e e w r r r r r o Figure 5 o - Graphics for Medium Frequency ofrbreathing in relation with the events for all volunteers. r e e e e e e e n n e - Breathing r Vol1 d RMS 0,5 d d d Vol2 d d e e e Vol3 o d o o o Vol4 o o i i o d Vol5 n n n n Vol6 n n n n o Vol7 e n e e e Vol9 e e c c 0 n Vol10 i e i i 0 2 i 4 6 8 10 12 iVOL12 i Events o o e n i n n n for RMS of breathing Figure n in relation with n 6 - Graphics n the eventsi for all volunteers. n n c c c c c c j j n o c o o o o o u u o c n n n n n n n n n o j j j j j j c c j n u u u u u u t t j n u n n n n n i i u c n c c c c c o o c n e
RMS
Average Frequency (Hz)
a l
4.2 Hand Pressure at steering wheel Continuing the analysis, with the hand on the pressure graphs, there was the score the beginning of simulation with the hand grip at the wheel three times. The analysis of physiological data left hand pressure on the wheel was held in conjunction with the graphics with temporal data of the average frequency values that measured the pressure change rate, and a graph of RMS values that measured the intensity of pressure applied, both in the times when the events occurred. See Figure 7. Making a comparison between the values found at average frequency and RMS graphics, is observed that the pressure indicator for the left hand was only effective for measuring large variations in pressure during the test for only three volunteers. In those volunteers, the pressure variations in the frequency and intensity varied considerably, while in the other eight volunteers were only variations in the application of pressure at the start of the test. See Figures 8 and 9. 1
A
B
h
h
h
e
e a n a l y
a
e
n
a n
a
2
3
l
h
h
4
a
1
h
l
h
y
e
e
z
a
a
z
e
y
e
a
z
a
n
e
n
2
3
h
h
e
e
4 h e
n Frequency n e Figure 7 - Graphics for Medium (A) and RMS (B) of hand pressure with eventsamarkings a – Vol 5. e 100
Average Pressure (Hz)
s w e r
a
w
l
e
y
y
r
z
z
0
d
a
a Average Frequency - Hand s Pressure
2
s
a
l
e
e
0
e
s
e 4
s
l
w
l
y
e
y
z
r
z
e6 Events
8
10
e
e12
a
n a l y z
n Vol1 a Vol2 Vol3 Vol4 l Vol5 Vol6 y Vol7 Vol9 z Vol10
e
e
s
s
w
w
e
e
r
r
e
e
12 d
d
n a l y z
s hand pressuredin relation with the Figure 8 - Graphics for Medium of d s events for all volunteers.e w Frequency w o
o
0,5
RMS
n e i n c o n j u n c t i
n
e
e
e
r
r
i
e
e
d
n 0
0
c
2
o
d 4o
RMSw- Hand Pressure o
w
e
n
e
r
e
r
e
i
e
d
n
d
6
oEvents
c
8
10
o
n n o o o Figure 9 - Graphics for RMS of hand pressure in relation with the events for all volunteers. n o n e e n n n e n e i i j e e i j i n n u i i n u n c c n n n c n c o o c c c o c o n n t o o n t n j j i n n j i j u u o j j
Vol1 s Vol2 Vol3 w Vol4 Vol5 e Vol6 Vol7 r Vol9 Vol10e VOL12
d o n e i n c o n
4.3 GSR In case of the GSR, high values of mean frequency of sudden changes indicate voluntary emotional state, such as, for example, a shock. Have high values of effective value for this experiment indicate a calm situation and serenity and low values indicate a situation of stress experienced by drivers. Unlike previous analyzes, the signs of GSR were quite satisfactory and showed a strong relationship between the signs and events. The graphs below show the GSR signal in simulation time function. See Figure 10.
2 h
A
1
a
h
n a
e
e
a
e
h
h
e
h
1
4
a
a 3
n
h
a
e
l
n
e
a
a
l
l
n
y
y
a
z
z
l
e
a
e
e
y
s
l
s
n a l y
y
a
z
z
n
e
2
3
4
h
h
h
e
e
e
h
a
a
a
e
n
n
n
a
a
a
a
n
l
l
l
a
y
y
y
l
z
z
z
y
e
e
s
s
Average Frequency (Hz)
e 5. Figure 10 - Graphics for Medium Frequency (A) and RMS (B) of GSRswith events markings – Vol s
z
w
e
w y e z
s
r
2000r
w
e
1000e
e
d
4000 3000
e
d
0
r
2
o
Average Frequency - GSR - Geral
w
r
r
e
e
s w e
e
e
e
4
d
d o
w
6 Events
8
o 10
n
n
e
e
w w e
e
r
r
e
e
d
d
o
12 o
s Vol1 wVol2 Vol3 eVol4 Vol5 r Vol6 Vol7 eVol9 Vol10 dVOL12 Vol13
o
n n r Frequency o 11 - Graphics e Figure for Medium of GSR in relation with the events forn all volunteers. n
RMS
n
d
45000e
o
i
i
n
n
35000n
e
c
c
i
o
n
n
25000o
n
0
c
2
j
e d o
e i
RMS - GSR - Geral
n
n
n
c
e
o
i
n
n4
j
i
c o n 6 Events
8
j 10
e
e
i
i
n
n
c
c
o
o
n
n
j
12
j
u
e
Vol1 iVol2 Vol3 nVol4 Vol5 cVol6 Vol7 oVol9 Vol10 nVOL12 Vol13
j
u c Frequency Figure of GSR in relation with the events foru all volunteers. u u j 12 - Graphics o for Medium n
n
n
j
c
c
u
t
t
n
i
i
c
o
o
t
n
c
n
n
i
w t
w
u
o n j
n c t
u
i
n
o
n c t i o n
w
B
z e s w e r e d o n e i n c o n
u
j
n
n
n
u
c
c
c
n
t
t
t
c
i
i
i
t
o
o
o
i
n
n
n
o
w w
w
n
Placing markings on the basis of events seen in the graph sudden change of the signal after the rest period in 1 The start of the simulation proved the greatest stress and therefore change event shown in the event 2. In the events 2 and 3, again show variations from the stress caused by the appearance of obstacles. The event 4, also with high variations, was the event where the track ends abruptly and the car falls into the abyss. See Figures 11 and 12.
4.4 Simulation with motion For tests with a motion simulator was used the software rFactor 2. For the simulation of this phase were used vehicle Chevrolet Camaro model 2012 and the racetrack of Indianapolis. The choice of rFactor simulator as the basis of this phase was due to its ability to track choice / vehicle and the software isiMotor 2.0, which is quite reliable for developing accurate models with a good similarity driving in relation to real models. Another factor is because the motion was already available codes required for the operation of D-Box actuators used in vehicular simulator, without them, it would not generate the movements in the simulator. The results for the breathing graphs showed a similarity to those found in the simulation results with no movement. In some drivers, there was a decrease in the intensity and even a pause breathing at the time of stressful events and there was a clear change between the resting phase and the simulation phase. For the simulation performed using rFactor 2 as an example has the volunteer #17 results showing a relation between the stress events. During the start (1) there was a pause in breathing, followed by heavy breathing. During the race, t here was persecution of event (2) with more regular breathing and intense curves (3) with pauses in breathing followed heavy breathing. These events are observed by the physiological response of breath, very evident in the graph below, in Figure 13. 3 A
2
3
3
B
4 1
1
1
1
4
1
3
1
1
1
1 1
1
1
1
1 2
Figure 13 - Graphics for Medium Frequency (A) and RMS (B) of breathing with events markings – Vol 17. For the simulation with rFactor in relation to hand pressure, gave a similar result. A strong relationship between the driver's hand pressure with stress events such as start of the race (1), the intense curves of the oval circuit of Indianapol is (2 - arrows) and stress events such as strikes, persecution and overtaking (3) . Again for voluntary 17, is observed this relation after analysis of pressure data on the wheel. There was no stress events (3) for the voluntary 17, as this driver always was in the last position and driving in clear track. See Figure 14.
2
2 2
A
2
2
2
B
2
2
1
2
2
2
2 2 2
1
2
Figure 14 - Graphics for Medium Frequency (A) and RMS (B) of hand pressure with events markings – Vol 17.
For the volunteer #13, the event (1) shows that the start was also a tense event. In (2) there was overtaking and (3) a hit. Tensions increases during the chase phase, culminating in two overtaking in (4). Overtaking proved to be a very tense event. In this event, the volunteer went from last to first. See Figure 15. 2 1
4
2
3
4
1 A
B
3
Figure 15 - Graphics for Medium Frequency (A) and RMS (B) of GSR with events markings – Vol 17.
4.5 Image analysis For each event created in graphics (breathing, pressure and GSR) were generated a set of images with printscreens than drivers were viewing. This highlights the events analyzed and shows what the volunteers were seeing during the simulation. The images helped in the validation data analysis. See Figures 16 to 21.
Figure 16 - Images captured at the moment of the event 2 - appearance of the obstacles in the first leg for Vol. 2.
Figure 17 - Images captured at the moment of the event 3 - appearance of the obstacles in the second leg for Vol 2.
Figure 18 - Images captured at the moment the event 4 - the vehicle falls into the abyss with the end of the runway for Vol. 2.
Figure 19 - Images captured at the moment the event 1 – Start of the race. Vol. 13, using rFactor with the simulator movements.
Figure 20 - Images captured at the moment the event 1 – Car crash. Vol. 13, using rFactor with the simulator movements.
Figure 21 - Images captured at the moment the event 1 – Car Overtaking. Vol. 13, using rFactor with the simulator movements.
4.6 General analysis of the experimental results The overall results, according to the physiological data and together with subjective questionnaires was that: - The simulator can identify changes in behavior / actions of volunteers through the physiological signs of breathing, pressure and GSR and its analysis using the average frequency and RMS throughout the simulation period; - The respiration signals were shown to be good indicators for characterizing stress variation during a vehicle simulation, when it is judged by RMS and average frequency values; - Signs of GSR shown to be very evident to characterize the driver's stress, clearly indicating a variation between the resting state and the conducting state / simulation and variation with high peaks in stress events. This evidence was seen in all volunteers and analyzed over the four events used as a reference. For average frequencies, all volunteers indicated a clear change of feeling among the rest period and the beginning of the simulation, but also during stress events. The results for the RMS also characterized this transition from rest period for the start of the simulation and als o indicated which were the most stressful situations for volunteers according to their actions during the simulation. - The hand on the steering wheel pressure signals were also evident, but were not a good indicator of physiological changes, but the particular drive mode for each user. A wide variation in pressure was found on the steering wheel among the participants, ranging from values from 0.02 to 0.3, a difference of 1 500%. However, this range of values may be an indicator of each participant driving way. In the case of average frequencies, these values indicated that during sudden maneuvers, this pressure might vary with the withdrawal of the driver's hand for the faster return of the steering wheel. The general analysis for the phase with the motion simulator, in accordance with the physiological data and together with the subjective questionnaires was that: - Also reported in phase without movement, the breathing signs were good indicators to characterize voltage variation during a vehicle simulation, both using the simulator based on Unity, as in rFactor. - The pressure of the hand signals in the steering wheel were also equally evident. Also showing that there is a variation in pressure on the steering wheel among the participants. Because of the peculiar form of driving each volunteer. - And once again, signs of GSR were well evident for the characterization of conductor stress. Clearly indicated a variation between the resting state and the simulation driving condition and with high variation peaks in stress events during simulation using software based on Unity. This evidence was also perceived by analyzing the GSR data for rFactor simulator. Regarding the results of subjective evaluations in relation to the Vehicle Simulator, volunteers during phase with movements responded that the simulator is closer to a real vehicle. This was due primarily because improvements in sound system was criticized during phase without movement and the simulation being done now with movements both body simulator, as for vibrations and more direct answers on the wheel. The mean score was 6.15, increasing for stage without movement was 5.2.
5. Conclusion This article presents the characterization of a universal simulator using the vehicle simulation in an immersive virtual reality environment (CAVE) with the physiological data analysis of a conductor and analysis methodology to enhance the development of a product. This work builds an infrastructure to simulate and analyze human activity within the precepts of affective enativos systems, as is the case of processes involving the actions of human beings affected by the environment (enactions), and exchange of physiological signals. As a result, it is expected new project data by devices to be tested in a controlled manner and in a predetermined environment, even in product modeling phase. The result of this sensory expansion in the pre -project is premised on the improvement of the final product itself, pre-validating the product even in the modeling phase and decreasing the chance to redesign and optimizing the time in the testing phase in physical mock-ups. From the literature 9, it is seen that the simulation can enhance the training of pilots and vehicle drivers due to the proximity of the complexity of the actions made between the actual act and the simulated act, aided by elements that make the closest simulation of real, as simulators with motion, visual immersion, among others. This simulator proposal in a biocybrid condition extends the issues of cognitive ergonomics for the widest field of affective enactive systems by providing a sum of sensations in physical and syntactical space with the sensations in
stereoscopic simulation spaces immersion. Considering the behavioral issues of physiology and cognition human / environment / computer, which are thought in relation to the product design, for the purpose of applications in training, in actions involving security, rehabilitation and finally, product design, with emphasis on Ergonomics and behavior in Mixed Reality. For the characterization of the infrastructure used for the physiological experience was based in three different types of physiological signals. Data analysis processed some physiological signs are more efficient than others for detecting stress variations. We highlight the evidence of GSR sensor when compared to breathing and pressure data at hand. In future work, other physiological signals such EEG, ECG, and others should be added to the embedded system. Moreover, the simulator platform in the three axes will act to generate a feeling of vibration. Finally, other platforms will be evaluated, taking advantage of the method and used sensors. The main scientific contribution is the possibility to tracing a stress analysis protocol for drivers while operating a vehicle getting affective behaviors coming from physiological data, mixed to embedded simulation in Mixed Reality. In the future, in case of smart vehicle, the use of physiological data can be provide via wifi to a central computer in the vehicle the increase of security of the car. Especially in high-stress moments, in which the driver could lose control of the car, the proposed system should help the driver’s task.
References [1] Martins, V. F., Kawamoto, A. L. S., Silva, F.S.C.. “Guidelines for the Development of Gestural Interface Games for the Older Adults” inSBGAMES, 2013. [2] Preece, J. Rogers, Y. Sharp, H. “Design de interação: Além da interação homem-computador” in Ed. Bookman, 2013. [3] Kaipainen, M., Ravaja, N., Tikka, P., Vuori, R., Pugliese, R., Rapino, M., and Takala, T., “Enactive systems and enactive media: Embodied human-machine coupling beyond interfaces" in Leonardo 44(5), 433-438 (2011). [4] Berthoz, A. “Le sens du Mouvement.” in Editions Odile Jacob, Paris, Février 1997, ISBN: 2738104576. [5] Domingues, Diana; Miosso, Cristiano; Rosa, S. S. R. F.; Aguiar, Carla; Lucena, Tiago; Miranda, M. ; Rocha, Adson; Raskar, Ramesh. “Embodiments, visualizations, and immersion with enactive affective systems” in The Engineering Reality of Virtual Reality. Proceedings of SPIE - International Society for Optical Engineering, v. 1, p.9012-18 978081918, 2014; [6] Picard R.W., Healey J., “Detecting Stress During Real-World Driving Tasks Using Physiological Sensors” in IEEE Transactions on Intelligent Transportation Systems, vol. 6, no. 2, pp. 156–166, June 2005. [7] Domingues, D., “Relatório Projeto Arte e Tecnociência, Pesquisador Visitante Nacional Senior” in Capes, março 2014, Projeto CNPq PQ 1A: ARTE E TECNOCIÊNCIA e REENGENHARIA DA VIDA: Sistemas Enativos Afetivos em Bioarte e Softwares Sociais como Inovação Tecnológica, Julho, 2013. [8] Iida, I. “Ergonomia: projeto e produção.” in Edgard Blucher, São Paulo, 2005, ISBN: 9788521203544. [9] Gkikas, N., “Automotive Ergonomics, Driver-Vehicle Interaction” in CRC Press-Taylor & Francis Group, EUA, Oct 2012, ISBN: 1439894256. [10] Miranda, M., “Desenvolvimento de Bancada para Simulação Veicular Integrando Realidade Virtual e Medição de Dados Fisiológicos” in Universidade de Brasília, PhD Thesis in Mechanical Sciences, Publication: ENM TD – 24/2014, Mechanical Engineering Department, Universidade de Brasília, Brasília, DF, 234p. [11] SAE Technical Paper Series – 2003-01-0169, “Case Study of Vehicle Maneuvers Leading to Rollovers: Need for a Vehicle Test Simulating Off-Road Excursions, Recovery and Handling” in SAE World Congress 2003, Detroit, Michigan, March 3-6, 2003. [12] Unity 3DWebsite, available at: http://unitypackages.net/unitycar/joomla/index.php [13] Healey J., “Affect detection in the real world: Recording and processing physiological signals.” in Affective Computing and Intelligent Interaction and Workshops, 2009. ACII 2009. 3 rd International Conference on, Sept 2009.