Jun 30, 2011 ... formed, and wind tunnel test data from a 20:1 low speed model is also ... of the
D8 configuration, which is the main purpose of this paper. ... ration, which is a
Boeing 737-800 slightly modified by optimizing with TASOPT.
Paper 2011-3970,
29th AIAA Applied Aerodynamics Conference,
27–30 June 2011, Honolulu, HI
Development of the D8 Transport Configuration Mark Drela
∗
MIT, Cambridge, MA, 02139 The D8 jet transport configuration is presented. Focus is on the aerodynamic characteristics of its distinguishing features: the wide “double-bubble” fuselage with beneficial pitching moment and carryover lift characteristics, the nearly-unswept wing and reduced cruise Mach number, and the boundary layer ingesting rear engine installation together with the twin “pi-tail” configuration. The merit of each feature is evaluated in terms of mission fuel burn, calculated via an MDO optimizer which accounts for the weight and propulsive efficiency of the design features. Evaluations via panel methods are also performed, and wind tunnel test data from a 20:1 low speed model is also presented. The calculations and tunnel data indicate that the advantages of the D8 configuration would lead to a very large 33% fuel burn reduction compared to an optimized conventional transport configuration with the same materials and engine technology.
I. A.
Introduction
Background
Fuel economy is a primary driver in transport aircraft design, not only for airline economics but also as a basis for minimizing emissions. Because fuel burn depends on many competing drivers, development of fuelefficient designs must necessarily encompass all the disciplines involved, starting at the conceptual design stage. The traditional conceptual design approaches of e.g. Roskam,1 Torrenbeek,2 Raymer,3 are focused on obtaining a closed design, which can in principle be iterated via some manual or automated optimization process to find the minimum-fuel design. Other approaches such as those of Knapp,4 the WINGMOD code of Wakayama,5,6 and in particular the PASS program of Kroo7 are more specifically geared towards design optimization, either of the complete aircraft or a major component of the aircraft such as the wing. B.
Present Work
Much of the present work was conducted for the NASA N+3 Program,8 which aims to develop aircraft and technology concepts for up to 70% fuel burn reduction for aircraft to be deployed in the 2035 timeframe. That work resulted in two versions of the basic D8.x configuration: the current aluminum-technology D8.1, and the forecast advanced-technology D8.5. The present paper will focus on further variants and modifications of the D8.1, called the D8.0 and D8.2, which reflect a few theoretical developments in the methodology. They also further defer to today’s operational and economic drivers, via a change from three to two engines, and the introduction of a span constraint. Hence, the designs presented here do not quite reach the same level of performance as the N+3 designs, but are considered to be much more compatible with today’s technology and operational constraints. They are also well suited for evaluating and discussing the most novel features of the D8 configuration, which is the main purpose of this paper. The configuration optimization and fuel-burn evaluation presented here was performed by the TASOPT MDO code.9 Its attractiveness for the present application is that it uses first-principles methods for its primary weight, aerodynamic, and engine performance predictions. Specifically, TASOPT uses structural theory for primary-structure sizing and weight prediction (in lieu of historical correlations), variable wing airfoils and viscous/inviscid CFD for all profile drag prediction (in lieu of wetted-area methods), full engine flowpath simulation (in lieu of engine tables or correlations), and a variable flight trajectory (in lieu of a fixed climb and cruise profile). The minimal reliance on historical data and empiricism gives considerable ∗ Terry
J. Kohler Professor, MIT Department of Aeronautics & Astronautics, AIAA Fellow. c 2011 by Mark Drela. Published by the American Institute of Aeronautics and Astronautics, Inc. with Copyright permission.
1 of 14 American Institute of Aeronautics and Astronautics Paper 2011-3970
confidence in applying TASOPT for the conceptual design of the rather unconventional D8.x configurations presented here. Although TASOPT is the main evaluation tool for the overall configuration, the aerodynamic development of the aircraft components was performed using traditional methods: The MSES viscous 2D airfoil code10 for the wing airfoil family, the AVL vortex-lattice code11 for the basic configuration layout, and QUADPAN12 panel code for confirming the AVL calculations and calibrating TASOPT’s trim and stability procedures. These component design procedures follow common practice, and will not be detailed here. The paper will present the two D8.0 and D8.2 aircraft variants, and discuss the rationale behind them. Their key aerodynamic parameters and fuel burn performance will be compared to the “737-OPT” configuration, which is a Boeing 737-800 slightly modified by optimizing with TASOPT. Hence, the same evaluation method is used for both the baseline and the new designs, which adds confidence that the relative improvements of the D8.x aircraft are realistic, and not artifacts of different evaluation methods. Further confidence is obtained from preliminary wind tunnel tests.
II.
Design Evaluation – Fuel Burn Metric
The merit of any given configuration is defined here to be the fuel burn it requires to fly a specified design mission. This is evaluated in TASOPT by integration of the flight trajectory equations from takeoff to landing. But to identify the key parameters, it is useful to obtain a simple analytic estimate of the mission fuel burn from the Breguet equation, which is valid for the dominant cruise portion. � � � � TSFC CD R TSFC R CD Wfuel = WZF exp − 1 ≃ WZF × × × (1) M CL a M CL a The second linearized approximate form is accurate for short to medium range aircraft, where the fuel weight is not a very large fraction of the total weight. With the range R and speed of sound a taken fixed, the fuel burn is therefore the product of three equally-important aircraft parameters in the rightmost term in (1): – the zero-fuel landing weight WZF , – the engine specific fuel consumption TSFC/M , and – the drag/lift ratio CD /CL . Any one of the factors can be easily reduced in isolation. For example, CD /CL can be reduced by increasing the wing aspect ratio or the wing/wetted area fraction, but this will be offset by an increase in the wing weight’s contribution to WZF . The 1/M factor can be decreased by simply choosing to fly faster, but this will increase all the other factors and actually give a net increase in the fuel burn. Since all the factors influence each other to varying degrees, it is essential to account for their important interactions and tradeoffs during design development. The true measure of merit of any design change is its influence on the overall mission fuel burn of the closed and re-optimized aircraft design, using the process diagrammed in Figure 1. Any single design parameter change therefore also changes the entire aircraft, engine, and flight trajectory, as determined by TASOPT. Optimization
Weights Dimensions Gauges Engine size Fuel burn T/O perf ...
Design Closure Design Parameters Range Payload Mach Nmax fstress Tmetal CMfuse lBFmax ...
Surface spans, areas Loads, Shears, Moments
Optimized Variables
Structural gauges Volumes and Weights
( Sweep, CL, AR, Altitude, FPR, BPR, Tt4 ... )
Drag, Engine size+weight Trajectory, Fuel Weight Total Weight converged? Y N
Fuel burn minimized?
N
Y
Sweep CL AR Altitude FPR BPR Tt4 ... Design Outputs
Figure 1. TASOPT design-closure and optimization procedure. A change in any input design parameter (CMfuse for example) produces new overall optimum airframe, engine, and flight trajectory variables. The resulting change in the fuel burn weight Wfuel is the figure of merit for the parameter change.
2 of 14 American Institute of Aeronautics and Astronautics Paper 2011-3970
The specified mission parameters for the present study, given in Table 1, are representative of the Boeing 737-800 against which fuel-burn changes will be compared. The field-length and span constraints produce modest but significant fuel-burn penalties for all the aircraft considered here. The fuselage shape and tailTable 1. Specifications and constraints for TASOPT optimization, representative of a Boeing 737-800.
Payload: Range: Field: Span:
Wpay R lBF b
= = ≤ ≤
38700 lb 3000 nmi 7500 ft 118 ft
(180 pax × 215 lb) (with 5% fuel reserve on landing) (balanced field length) (except for the unconstrained D8.2)
attachment locations on the fuselage are also specified. The wing location on the fuselage is determined via stability and trim requirements by TASOPT’s inner loop shown in Figure 1. Table 2 lists all the design variables which are optimized by its outer loop. In addition, roughly 100 other parameters are specified Table 2. Design variables determined by global optimization.
CLCR AR Λ (t/c)o (t/c)s λo λs
cruise lift coefficient aspect ratio wing sweep angle root airfoil thickness ratio panel-break and tip airfoil thickness inner-panel taper ratio outer-panel taper ratio
rcℓs rcℓt FPRD BPRD Tt4TO Tt4CR hCR
local/root cℓ ratio at panel break local/root cℓ ratio at tip design fan pressure ratio design bypass ratio turbine inlet temperature at takeoff turbine inlet temperature in cruise start-of cruise altitude
explicitly, such as the fuselage geometry, material properties, load factors, flap-down airfoil characteristics, engine component efficiencies, and numerous other details. Most of these are taken from the 737-800 aircraft, so that the focus here will be only on the fuel burn savings due to configuration and aerodynamics. Of course additional savings can be realized from e.g. improved materials and engine technology, which was extensively investigated in the earlier N+3 work. However, these improvements are expected to have comparable benefits for any configuration, and hence will not be considered here.
III. A.
D8 Configurations
D8 Fuselage
The D8.0 and D8.2 aircraft examined here share the D8 fuselage, shown in Figure 2. Its distinguishing features are the twin-aisle cabin in a“double-bubble” cross section, the upturned nose with raised cockpit, and the flat rear fuselage. The two bubbles have a center vertical web to give a pure-tension pressure vessel in cross-section. The web material could be concentrated into slender struts as sketched in Figure 2, to give an effectively wide open cabin. The D8 fuselage has the following beneficial effects, some of which are illustrated in Figure 3. • Increases carryover lift which shrinks and lightens the exposed wing area • Provides a nose-up trimming moment, which shrinks the horizontal tail and further shrinks the wing • Side of body load transfer points are farther apart, giving a partial spanloading and weight reduction • Landing gear has a shorter load path into side-of-body, giving lighter landing gear support structure • Landing gear struts are shorter from shorter tail (especially for the rear-engine D8.2) • Fewer windows from shorter cabin, reducing weight • Floor’s center support reduces the floor beam weight • Accommodates twin-fin “Pi-tail”, which lightens the horizontal tail, and accommodates the rear-engine installation in the D8.2 variant.
3 of 14 American Institute of Aeronautics and Astronautics Paper 2011-3970
737−800
D8.x
D8.0
D8.2
D8.x
11 0
10
20
30
40
50
60
70
80
90
100
110 ft
D8.0
737−800
9 0
10
20
30
40
50
60
70
80
90
100
110
120 ft
Figure 2. Side-view and top-view comparison of D8.x and 737-800 fuselages and cabin layouts.
737
D8.x
M(y)
M(y)
Figure 3. D8 fuselage reduces wing and tail bending moments, and shortens landing gear load paths.
B.
D8.x Aircraft Variants
The two D8.x aircraft are shown in Figure 4, and their key parameters are listed in Table 3. Each configuration is discussed in subsequent sections.
4 of 14 American Institute of Aeronautics and Astronautics Paper 2011-3970
D8.0
D8.2
Mach = 0.80 span = 118 ft
Mach = 0.72 span = 118 ft
D8.2 (no span constraint) Mach = 0.72 span = 138 ft
Figure 4. D8.x configurations.
Table 3. Key parameters of 737-800, baseline 737-OPT, and D8.2x configurations, optimized by TASOPT for minimum Wfuel , with or without span constraint or engine-parameter optimization. Baseline weight values are WMTO = 162319 lb and Wfuel = 35889 lb. The TSFCs for the D8.2 are the effective values including effects of BLI.
M
Λ
AR
CL
L/D span span WMTO
deg
737-800 737-OPT D8.0 D8.0 D8.2 D8.2 C.
0.80 0.80 0.80 0.80 0.72 0.72
25.0 27.3 27.8 27.7 12.6 13.8
10.20 10.59 10.86 10.27 13.29 15.72
0.550 0.559 0.570 0.567 0.699 0.688
15.90 16.33 16.42 16.39 18.32 19.84
Wfuel
eng. BPR FPR TSFC
con?
ft
frac
frac
opt?
N
112 118 118 118 118 138
1.031 1.000 0.898 0.894 0.775 0.815
1.052 1.000 0.894 0.882 0.671 0.658
N
N Y Y Y N
N N Y Y Y
5.10 5.10 5.10 6.65 6.91 7.31
1.650 1.650 1.650 1.765 1.626 1.652
hCR
1/hr
ft
0.565 0.559 0.555 0.547 0.477 0.475
33 500 35 820 38 080 39 295 36 630 38 320
D8.0
The D8.0 configuration is intended as a “fuselage-only” modification to the 737-800, mainly to demonstrate the effects of the D8 fuselage alone. For this reason the engine’s key parameters of bypass and fan pressure ratios BPR, FPR are first left unchanged, and then optimized for an additional -1.2% fuel reduction. Both cases are shown in Table 3. The D8 fuselage gives the following benefits: • Increased fuselage lift, which shrinks the wing • More positive wing-body nose-up moment which – shrinks the horizontal tail – reduces optimum tail download and trim drag – further shrinks the wing • Shorter cabin reduces the CG range, further shrinking the tail Interestingly, the D8 fuselage has nearly the same weight and isolated drag as the 737-800 fuselage, so its -10.6% fuel reduction from the baseline is entirely due to its secondary effects on the weight and drag of the 5 of 14 American Institute of Aeronautics and Astronautics Paper 2011-3970
other components. This shows the necessity of using the airplane re-optimization process shown in Figure 1 to evaluate configuration changes. D.
D8.2
The D8.2 configuration has two major changes from the D8.0: 1. The engines are moved to the rear fuselage, with the following benefits: • • • • •
Improves propulsive efficiency via fuselage Boundary Layer Ingestion (BLI) Rear fuselage provides flow alignment for engines, allowing minimal lightweight nacelles Greatly reduces the engine-out yaw moments, shrinking the vertical tail area and weight Provides noise shielding, since engine faces are invisible from the ground Fin strakes function as engine/tail mounting pylons, as additional acoustic shields
2. The Mach number is reduced from 0.80 to 0.72, giving the following benefits: • Allows low-sweep wing for reduced structural weight, and increased cruise CL and CLmax . • Simplifies BLI by virtually eliminating streamwise-vorticity distortion into the engine fans The D8.0’s tail reduction is now of course partially but not completely offset by the engines’ rearward CG shift. The increased cruise CL is a natural consequence of simple sweep theory, which dictates the scaling laws M ∼ 1/ cos Λ, CL ∼ cos2 Λ ∼ 1/M 2 for a given normal-section transonic airfoil. The overall CD is less than this, so that the overall resulting CL /CD increases, as given in Table 3. At the lower flight Mach, the potential flow over the D8 fuselage has a local M ≃ 0.6, which is what the fan requires, as shown in Figure 5. No additional diffusion is needed from the nacelle, so that the ingested boundary layer is relatively healthy and expected to be mostly free of problematic streamwise vorticity. A M (x )
2D−like deceleration by fuselage
M = 0.80 M = 0.72
Additional 3D deceleration by nacelle (generates secondary flow)
M fan = 0.60
Secondary flow (streamwise vorticity) due to local nacelle’s deceleration
Figure 5. Surface Mach numbers on upper rear D8.2 fuselage, computed with QUADPAN at two freestream Mach numbers. Reduced M∞ eliminates the need for local flow deceleration by nacelle, and the associated unfavorable secondary flow development.
further benefit of reduced cruise Mach is that it disproportionally reduces the supervelocities on the engine nacelle. Assuming a simple vortex-sheet model of the nacelle, shown in Figure 6, and the Mfan ≃ 0.6 requirement, the local Mach or velocity on the nacelle is Mnacelle
≃
Mfan + 2(M∞ − Mfan ) = 2M∞ − 0.6
(2)
From a dissipation argument,13 the associated nacelle drag scales as the local (V /V∞ )3 ≃ (M/M∞ )3 which implies that reducing the cruise Mach from 0.80 to 0.72 reduces CDnacelle by a factor of 0.66 . And since the buried engines require much less nacelle wetted area and are immersed in a slower local potential flow, the overall nacelle drag is greatly reduced by a factor of 0.22 . Table 3 indicates that the fuel-burn benefit of the D8.2 configuration’s rear-engine BLI installation, reduced flight Mach, and the other related benefits produces a large -33% fuel decrease relative to the baseline. This is attributable to a number of interacting effects, the major ones being the TSFC reduction from BLI, a large reduction in the nacelle size, weight, and drag, and a reduction of the vertical tail size due to 5× smaller engine-out yaw moments.
6 of 14 American Institute of Aeronautics and Astronautics Paper 2011-3970
Mnacelle
1.00
CDnacelle
1.00
Anacelle S
Mnacelle
0.84
CDnacelle
0.66
Anacelle S
M (x ) M = 0.80 M = 0.72
equivalent vortex sheet strength
M fan = 0.60
M nacelle
CDnacelle
Vnacelle V
3
Anacelle S
M fan
Figure 6. Nacelle surface supervelocities related to the freestream cruise M∞ , and the fan-face Mfan ≃ 0.6, indicating large nacelle-drag reductions from reduced cruise speeds.
There are other non-technical benefits and safety-related issues with the D8.2 configuration. It has dramatically reduced noise due to the engine acoustic shielding by the rear fuselage and fin strakes, which was analyzed in the N+3 report.8 A significant issue is engine-failure fratricide in the adjacent engines, which could possibly be addressed by containment measures or axial staggering. Conversely, the rear engines are invisible head-on, and are expected to be effectively immune to bird strike. Finally, the economic productivity drawbacks of the lower speed is actually more than compensated by the faster loading and unloading of the twin aisle cabin. Despite the D8.2’s 10% lower speed, its gate-to-gate trip time is actually less than that of the 737-800 for most US domestic flights.
IV.
Design Drivers
This section will discuss the considerations which drove to the D8 configuration. Although the TASOPT methodology simultaneously optimizes all the design variables of all the component models, these components will be considered in rough isolation below. This is to identify the major design drivers for each component, and to help explain why the global optimization arrived at a specific (and perhaps unexpected) design point. A.
Lift Components
In the subsequent discussion the overall lift coefficient is assumed to be broken down by components CL
=
CLwing + CLfuse + CLtail + CLnacelle
(3)
as shown in Figure 8. These are required mainly for TASOPT’s sizing and structural model. For example, CLwing sizes the exposed wing area, and also drives the wing bending moments and hence the wing’s structural weight. CLfuse is the fuselage carryover lift which is significantly increased in the D8 configuration, giving a very beneficial effect in shrinking the required exposed wing area and the corresponding weight and drag. CLtail is the horizontal tail’s load and is typically negative and hence unfavorable for wing weight. The nacelle lift CLnacelle is typically negligible, although its derivative ∂CLnacelle /∂CL has an unfavorable destabilizing contribution for conventional wing-mounted engines, but not for the aft-mounted engines of the D8.0 . TASOPT uses a simple parameterized spanwise load distribution. These are calibrated using QUADPAN calculations, with examples shown in Figures 9,10. The calculated CL component fractions are shown in Figure 7. Note the very large 20% lift fraction carried by the D8 fuselage, in both cruise and at high lift. B.
Tail Sizing
The horizontal tail has a significant contribution to the fuel burn, both direct and indirect. Its profile drag, and the increase of induced drag from the tail download both directly increase the overall CD /CL . The tail’s 7 of 14 American Institute of Aeronautics and Astronautics Paper 2011-3970
weight of course increases the overall weight, and its download increases the wing area and weight as well. Tail sizing can be examined via the usual pitch-trim and pitch-stability relations, as described Roskam,1 Torrenbeek,2 and many others. CMcg − where
∂CM ∂CL xnp c¯ Vh
xcg − xac − cℓ h V h = 0 c¯ xnp − xcg ∂cℓh Vh = + ≡ SM ∂CL c¯
(4)
CMac + CL
=
xac − xcg c¯ xac ∂cℓh Vh + c¯ ∂CL � �2 Sh ℓh Vh S c¯ V
= ≡ ≡
(5) (6) (7)
Here Vh is the horizontal tail-volume coefficient corrected for the dynamic pressure seen by the tail, xnp is the usual neutral point, and SM is the usual static margin. Also, CMac is the pitching moment coefficient about the aerodynamic center xac of the tail-off configuration, which will depend on the wing flap setting, and possibly also on the Mach number. For a transport aircraft, the tail is typically sized by the maximum required download, assumed here to be at the maximum-CL condition, the most-negative CMac (full flaps), and with the CG at its forward limit xcg fwd . The neutral point location xnp is determined by a minimum stability margin requirement with the CG at its aft limit xcg aft . For these two cases, equations (4) and (5) give
fuse.
tail
(8)
=
SMmin
(9)
High Lift
wing
fuse.
tail
0.038
0.036
−0.083
−0.086
0.0
nace.
α = 12 CL 2.3
D8.0
0.127
−0.002
−0.004
0.011
−0.017
0.193
0.135 0.0
0
0.845
737
D8.0
wing
0.923
1.0
=
0.201
737
α=2 CL = 0.55
Cruise
0.798
1.0
0.886
CMac xcg fwd − xac (−cℓh )max + Vh + CLmax c¯ CLmax ∂cℓh xac − xcg aft Vh + c¯ ∂CL
nace.
Figure 7. CL component fractions for the 737-800 and D8.0, computed with QUADPAN.
CL tail (−) CL fuse
0
bo /2
CL wing
p (y) y
CL nacelle
b/2
Figure 8. Components of the overall lift coefficient CL . Fuselage lift and less-negative tail load shrink the wing and hence its profile drag and structural weight. Nacelle lift influences pitch stability and hence tail size.
8 of 14 American Institute of Aeronautics and Astronautics Paper 2011-3970
Figure 9. QUADPAN paneling for the 737-800 and D8.0
Figure 10. QUADPAN surface Cp contours for the 737-800 and D8.0 at cruise.
which are added to eliminate xac and then easily solved for the required tail volume. Vh
=
�
∆xcg −CMac + SMmin + CLmax c¯
��
(−cℓh )max ∂cℓh + CLmax ∂CL
�−1
(10)
The required tail volume is therefore determined by three equally-important terms: – the pitching moment of the tailless configuration CMac , – the minimum static margin at the aft-CG limit SMmin, and – the CG-travel range ∆xcg /¯ c. The second factor in (10) simply scales the above three parameters, and depends on – the maximum-allowable downward lift coefficient of the tail (−cℓh )max , and – the tail’s lift-curve slope factor ∂cℓh /∂CL Most of the above parameters are favorably influenced by the D8 configuration. To compute them, wingbody-nacelle QUADPAN models were constructed for the 737-800 and D8 fuselages, using essentially the same wing planform with slight adjustments to obtain the same exposed+carrythrough wing areas. The outlines are compared in Figure 11, with their aerodynamic centers as computed by QUADPAN overlaid at the origin. The resulting computed CMac values are given in Table 4. In addition to the D8 fuselage having a less-negative CMac , the shorter twin-aisle cabin limits fore-aft passenger movement and hence has a smaller CG travel range ∆xcg /¯ c. These together give a roughly 20% reduction in the required tail volume and tail area compared to the conventional 737-800 fuselage. The less-negative CMac of the D8 gives additional benefits in cruise by reduction of the required tail download. This can be estimated from the trim relation (4), recast as an expression for the tail lift fraction. CLtail cℓ Sh = h CL CL S
� �2 Vh V
=
1 ℓh /¯ c
�
CMac ∂cℓh − SM + Vh CL ∂CL
�
9 of 14 American Institute of Aeronautics and Astronautics Paper 2011-3970
(11)
60 50
y
40 30 20 10 0 -80
-60
-40
-20
0
20
x - xac
40
60
80
Figure 11. Outlines for the 737-800 and D8 fuselages with a common wing and nacelles, shown aligned at their tailless aerodynamic centers. Their pitching-moment characteristics are computed with QUADPAN.
Again, the less-negative CMac of the D8 fuselage has a direct benefit in reducing the tail download in cruise. The parameters for the 737-800 and D8.0 aircraft are given in Table 4, which produce the required tail volumes and cruise tail loads shown in Figure 12. The D8 results in a roughly 20% reduction in the required horizontal tail area, and an upward shift in the tail load of about 3% of aircraft weight in cruise. These together produce roughly a -4.5% reduction in the mission fuel burn all else being equal. Table 4. Tail-sizing and tail-load parameters at M = 0.80, CL = 0.55, calculated with QUADPAN.
Aircraft
CMac
∂cℓh /∂CL
∆xcg /¯ c
737-800 D8.0
-0.1665 -0.0825
0.36 0.41
0.586 0.507
0.04
1.4 1.2
0.02
1
Vh
D8.0
737-800
SM = SM
0
0.8
D8.0
min
SM = SM
CLtail-0.02 ____ CL
0.6
min
-0.04
SM = SM
0.4
-0.06
0.2
min
737-800
-0.08
0
min
SM = SM
+ 0.5 ∆x
+ 0.5 ∆x
cg
cg
-0.1
-0.2 0
0.05
0.1
SMmin
0.15
0.2
0
0.05
0.1
SMmin
0.15
0.2
Figure 12. Required tail volume and resulting cruise tail lift fraction for the D8.0 and 737-800 aircraft, as given by equations (10) and (11), for the parameters in Table 4.
C.
Induced drag considerations
One seemingly plausible counter-argument to carrying a substantial lift on a fuselage is that it will produce a significant induced drag penalty. An isolated lifting fuselage would indeed have a very severe induced drag penalty due to the very limited span of its wake trace in the Trefftz Plane. This is especially true for the typical fuselage like the 737’s which tapers to a point, since any shed vorticity must then occur via boundary layer separation over the tailcone, so that the vortex-wake span is even smaller than the maximum fuselage width. However, the presence of the wing and its wake completely changes this situation. The condition of zero pressure jump across a vortex sheet leads to the relation ~avg · ∇s Γ V
= 0 10 of 14
American Institute of Aeronautics and Astronautics Paper 2011-3970
(12)
where
~avg V
=
� 1 �~ ~low Vupp + V 2
is the average of the velocities above and below the sheet, and ∇s is the gradient on the sheet. Hence, the wing circulation Γ(y) at some spanwise wing location y convects unchanged into the Trefftz Plane along the average streamline parallel to V~avg , arriving at a more inboard location y ′ . A few of these average streamlines are sketched in Figure 13, as they contract behind the fuselage. The contraction still occurs even with the flat rear D8 fuselage, as the QUADPAN-generated streamline shows. The result is that the wing-root circulation values Γ(yo ) connect behind the fuselage (to within the fuselage’s viscous displacement-body width 2yo′ ), giving an overall a smooth Γ(y′ ) in the Trefftz Plane. In effect, a lifting fuselage can “employ” the wing to put a nonzero Trefftz-Plane circulation directly behind itself, by pinching in the wing’s wake. The total Trefftz-Plane circulation Γ(y′ ) will get locally modified by any additional vorticity shed off the 737 tailcone, or the D8 fuselage trailing edge. However, for pitch trim considerations the D8 fuselage is shaped to generate nearly zero local lift over its flat rear part, so that it actually sheds very little vorticity and hence is not expected to disrupt the smooth Γ(y′ ) contribution of the contracted wing wake. This can be seen from the streamline in Figure 13, which lies nearly in the freestream direction at the fuselage trailing edge, indicating a near-zero sheet strength there. A potentially complicating issue is the twin vertical tails, which for simplicity were omitted from the QUADPAN model. In principle these could act as winglets and mitigate the induced drag consequence of additional lift on the rear fuselage. However, to attain pitch trim such rear lift would need to be offset by a download on the horizontal tail, and hence would be largely pointless. So the ideal vertical tails are nearly unloaded and hence “invisible” in the Trefftz Plane, and therefore do not influence the argument here. There is still some induced drag penalty from the effective span reduction from b to b′ in the Trefftz Plane due to the fuselage, as derived by Nikolski.14 This contraction is accounted for in TASOPT, but this is minor in any case, amounting to slightly less that 0.5% increase in induced drag for the baseline 737-OPT, and 0.8% increase for the D8.x.
Γ( y) yo
b /2
y
737
y
D8 Vlow Vupp Γ( y’)
fuselage’s displacement body
y’o
y’
b’/2
y’
Figure 13. Streamline contraction due to fuselage leads to smooth Trefftz-Plane circulation, regardless of fuselage lift, or whether fuselage closes to a point (737) or edge (D8). Streamline contraction for the D8 fuselage in cruise is confirmed by streamline traced from wing trailing edge in QUADPAN solution.
The overall conclusion is that there is little induced-drag consequence to fuselage lift in general, provided that the rear fuselage flow is well behaved. On a conventional fuselage there must be no separation off the tailcone, and on the D8 fuselage there must be little local lift on the rear flat portion.
11 of 14 American Institute of Aeronautics and Astronautics Paper 2011-3970
V.
Low speed tunnel model evaluation
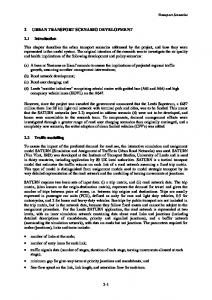
A 20:1 scale (90 inch span) low speed model of the earlier D8.1 configuration has been built, shown in Figure 14. The D8.1 is the same as the D8.2, except for a 150 ft unconstrained span and three smaller rear engines. The model is intended mainly to validate the aerodynamic performance and stability characteristics
Figure 14. 20:1 scale low-speed wind tunnel model.
of the D8.x fuselage/wing/tail combination, and hence does not have the rear engine nacelles. The model’s wing airfoils also differ from the full-scale transonic airfoils, which is necessary to give good behavior at relatively low test Reynolds numbers, especially near the tips and on the tail. Angle of attack sweeps were run at tunnel speeds of 80mph to 120mph, giving chord Reynolds numbers of 560K to 845K at the wing root, and 115K to 170K at the extreme wing tip. The outermost wing airfoil and tail airfoil are RC glider type sections which remain well-behaved down to 80K, so no erratic low-Re behavior is expected from the model. Both clean and tripped cases were runs, the trips being 0.1× 0.012 in tape placed on all the leading edges at 5%-10% chord, and around the fuselage 1.5 in behind the nose. Figures 15,16 show the measured CL (α), CD (CL ) data, with and without trips. The α values, and the estimated CDi components of the CD values have been corrected for the effects of tunnel-wall images using AVL.11 All curves show reasonably good behavior even past stall. Surface tufts indicated that the wing stalls first, followed by mild flow separation over the rear fuselage, giving some confidence that the BLI engine installation should work well at high angles of attack. The tripped 120 mph case in Figure 16 shows a maximum measured L/D = 16.1 value. Assuming the profile drag portion of the drag scales as the flat-plate turbulent skin friction, Cf
≃ 0.426/(log Reℓ − 0.407)2.64
(13)
the predicted maximum fully-turbulent cruise lift/drag ratio is roughly (L/D)max
≃
22.8
which is somewhat larger but quite close to the L/D ≃ 21 transonic-cruise value of the D8.1, as predicted by the TASOPT aerodynamic model used to optimize this configuration. This gives good confidence that the aerodynamic performance of the D8.x aircraft as predicted here is realizable.
12 of 14 American Institute of Aeronautics and Astronautics Paper 2011-3970
1.6
120 mph 80 mph tripped 120 mph tripped 80 mph
1.4 1.2 1 0.8
CL 0.6 0.4 0.2 0 -0.2 -4
-2
0
2
4
α
6
8
10
12
14
Figure 15. Measured CL (α) curves for the D8.1 model, with α corrected for tunnel wall effects.
1.6
120 mph 80 mph tripped 120 mph tripped 80 mph
1.4 1.2 1 0.8
CL 0.6
20:1
0.4 15:1 0.2 0 -0.2 0
0.01
0.02
0.03
0.04
0.05
0.06
0.07
0.08
0.09
0.1
CD Figure 16. Measured CD (CL ) curves for the D8.1 model, with CD corrected for tunnel wall effects.
VI.
Conclusions
This paper outlined the considerations which went into the aerodynamic development of the D8.x transport configuration. Global MDO analysis and computational and experimental data indicates that the configuration offers very large fuel-burn advantages over a more conventional transport configuration. 13 of 14 American Institute of Aeronautics and Astronautics Paper 2011-3970
Acknowledgements The author would like to thank Doug McLean of Boeing (ret.) for his many helpful discussions and suggestions.
References 1 J.
Roskam. Airplane Design. DAR Corporation, Lawrence, Kansas, 2000. Torrenbeek. Synthesis of Subsonic Airplane Design. Delft University Press, 1988. 3 D.P. Raymer. Aircraft Design: A Conceptual Approach. AIAA Education Series. AIAA, 1992. 4 B. Knapp, Matt. Applications of a nonlinear wing planform design program. Master’s thesis, MIT, Aug 1996. 5 S. Wakayama. Lifting Surface Design Using Multidisciplinary Optimization. PhD thesis, Stanford, June 1994. 6 S. Wakayama. Blended-wing-body optimization setup. AIAA Paper 00-4740, Sept 2000. 7 I. Kroo. PASS, program for aircraft synthesis studies. Software Package, Desktop Aeronautics, Palo Alto, CA, 2005. 8 E.G. et al Greitzer. N3 Aircraft Concept Designs and Trade Studies. Technical Report NASA CR-2010-216794/VOL1, NASA, 2010. 9 M. Drela. N3 Aircraft Concept Designs and Trade Studies – Appendix. Technical Report NASA CR-2010-216794/VOL2, NASA, 2010. 10 M. Drela and M.B. Giles. Viscous-inviscid analysis of transonic and low Reynolds number airfoils. AIAA Journal, 25(10):1347–1355, Oct 1987. 11 M. Drela and H. Youngren. Athena Vortex Lattice, Sep 2004. http://raphael.mit.edu/avl. 12 H.H. Youngren, E.E. Bouchard, R.M. Coopersmith, and L.M. Miranda. Comparison of panel method formulations and its influence on the development of quadpan, an advanced low order method. AIAA Paper 83-1827, 1988. 13 M. Drela. Power balance in aerodynamic flows. AIAA Journal, 47(7):1761–1771, July 2009. Also AIAA Paper 09-3762, San Antonio Conference, June 2009. 14 A.A. Nikolski. On lift properties and induced drag of wing-fuselage combination. Technical Report NASA RE-5-1-59W, NASA, 1959. 2 E.
14 of 14 American Institute of Aeronautics and Astronautics Paper 2011-3970