Water Resour Manage (2014) 28:4385–4400 DOI 10.1007/s11269-014-0758-0
Diagnosing Climate Change and Hydrological Responses in the Past Decades for a Minimally-disturbed Headwater Basin in South China Yiping Wu & Dongsheng Cheng & Wende Yan & Shuguang Liu & Wenhua Xiang & Ji Chen & Yueming Hu & Qian Wu
Received: 18 February 2014 / Accepted: 16 July 2014 / Published online: 26 July 2014 # Springer Science+Business Media Dordrecht 2014
Abstract Identifying the trends of climate and hydrological changes is important for developing adaptive strategies for effective water resources management. Many studies focused on the prediction of future climate at a regional/global scale using General Circulation Models (GCM) or these models’ downscaled outcomes. However, diagnosing historical trends is regarded valuable for local areas, especially considering the spatial heterogeneity (both occurrence and magnitude) of climate change and uncertainty of climate projection. In this study, we selected the headwater area of the East River Basin in South China, which has minimal human-induced disturbance, to detect climate change and its hydrological changes over a past 50-year (1955–2004) time period. Although the climate warming agreed with the global situation, its magnitude was small and no sign of intensified rainfall or change of annual rainfall was found. Nevertheless, no-rain days increased and light-rain days decreased,
Y. Wu (*) : W. Yan (*) : S. Liu : Q. Wu National Engineering Laboratory for Applied Forest Ecological Technology in Southern China, Central South University of Forestry and Technology, Changsha 410004, China e-mail:
[email protected] e-mail:
[email protected] D. Cheng China Institute of Water Resources and Hydropower Research (IWHR), Beijing 100038, China W. Xiang Faculty of Life Science and Technology, Central South University of Forestry and Technology, Changsha 410004, China J. Chen Department of Civil Engineering, The University of Hong Kong, Pokfulam, Hong Kong, China Y. Hu College of Engineering, South China Agricultural University, Guangzhou 510642, China
4386
Y. Wu et al.
indicating a longer dry interval between rainfall events. There was a significant downtrend of wind speed with a substantial reduction in magnitude, resulting in a decrease in the estimated potential evapotranspiration and a slight increase in the soil water content. Risks of flooding may not be a big concern, but water availability may be affected marginally in May and June due to the decreased rainfall and increased norain days. Overall, our results can improve the understanding of climate change and help watershed managers take precautions when facing climate change. This study also implies the necessity of investigating climate change at a local scale and at different time scales. Keywords Climate Change . Hydrological Responses . SWAT . Trend Analysis . Water Cycle
1 Introduction Emissions of greenhouse gases and aerosols due to anthropogenic activities (e.g., fossil fuel burning and land cover changes) continue to alter the atmosphere in ways that are expected to affect the climate. Based on the Intergovernmental Panel on Climate Change (IPCC) Fifth Assessment Report (AR5) (IPCC 2013), global surface temperatures have been rising with an average increase of 0.094±0.013 °C per decade since the late 19th century and a quickened warming pace in recent 30 years. The induced climate change characterized by global warming may have significant impacts on the terrestrial hydrological cycle by altering the spatial and temporal distribution of precipitation, air temperature, potential evapotranspiration (PET), actual ET, soil moisture, and plant growth (Dono et al. 2013; Houghton et al. 2001; Wu et al. 2012; Zhou et al. 2011). There is a theoretical expectation that climate warming will result in increases in ET and precipitation, leading to the likely intensification of the hydrological cycle (Allen and Ingram 2002; Houghton et al. 2001). In fact, globally averaged precipitation over land increased by about 2 % over the past century (Hulme et al. 1998), and the intensified hydrological cycle was also observed at local/global scales (Wild et al. 2008; Zhou et al. 2011). Although there is a general consensus of the global warming and increased precipitation (Houghton et al. 2001), the occurrence and the magnitudes of changes have been spatially variable. Some areas (e.g., parts of the southeastern United States and parts of the North Atlantic) have cooled slightly (http://www.ncdc.noaa.gov/cmb-faq/globalwarming.html), and some areas may have more (e.g., South China) and less (e.g., North China and the tropic region of Africa) precipitation (Piao et al. 2010). This indicates that climate change study is not only important at regional scale but also for a local area considering the spatial non-uniformity of the changes (Jung et al. 2013). Predicting the changes in both climate elements and the resulting hydrological responses is critical for evaluating water resources security. However, analyzing the past changes is important for understanding the water cycle and can provide valuable insights into the trends and magnitudes, especially in light of the substantial uncertainty of General Circulation Model (GCM) projections (Wolock and McCabe 1999). In a climate-change study it is usually a great challenge to attribute the water-cycle change (e.g., ET and streamflow) to a single driving force—climate change—especially in heavilymanaged areas where human activities may also play a non-negligible role. With this in mind, we selected the headwater area (i.e., the Xunwu River located in Jiangxi Province) of the East River Basin as the target because it is mostly forest-covered, undeveloped, and much less
Climate Change
4387
disturbed by human actions than the downstream area (i.e., a portion of Pearl River Delta with reservoir operation, irrigation, and high water demand) (Cui et al. 2007; Wu and Chen 2012, 2013b). Our objective is to diagnose the trends of climate change and its induced hydrological responses by analyzing the long-term observations of major climate elements and the key hydrological components simulated by the calibrated Soil and Water Assessment Tool (SWAT) for a past 50-year (1955–2004) period.
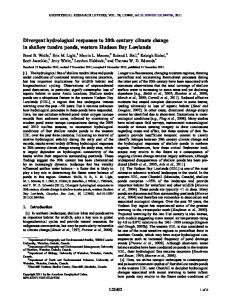
2 Materials and Methods 2.1 Study Area The East River Basin is one of the three main tributaries of the Pearl River (Zhujiang in Chinese). It is near the coast of the South China Sea and belongs to a monsoonal climate region with considerable variations in the spatiotemporal distribution of precipitation (Wu and Chen 2013a). This study focused on the headwater area of the East River Basin (i.e., the Xunwu River) above the Lizhangfeng flow gaging station, which has a drainage area of about 1,400 km2, accounting for 5.6 % of the East River Basin (Fig. 1). The Xunwu River channel has an average gradient of 0.221 %, higher than the average gradient of the East River (0.39‰). The annual average precipitation in this area is about 1,648 mm/year based on the 50-year (1955–2004) precipitation data from the Xunwu station (Fig. 1). The average discharge at Lizhangfeng (Fig. 1) is around 38 m3/s, based on the discharge records of the available 12-year (1977–1988) period.
Fig. 1 Location of the headwater area (i.e., the Xunwu River above the Lizhangfeng flow gaging station) of the East River Basin in South China
4388
Y. Wu et al.
2.2 SWAT Model The SWAT model was developed by the U.S. Department of Agriculture (USDA) Agricultural Research Service (Arnold et al. 1998) for exploring the effects of climate and land cover changes on water, sediment, and agricultural chemical yields (Neitsch et al. 2005a). This physically based, watershed-scale, continuous model can simulate the hydrological cycle, cycles of plant growth, the transportation of sediment, and agricultural chemical yields on a daily time step. Further details about the model have been documented by Neitsch et al. (2005b). The SWAT model has been widely used for a variety of watershed issues including climate and land cover changes at watershed scales (Narsimlu et al. 2013; Shi et al. 2011; Thampi et al. 2010). Therefore, we selected this well-established model for simulating a few hydrological components, whose observations or long-term measurements are not available (e.g., streamflow and ET). Applying the calibrated and validated parameter values based on the 12-year observation for the 50-year period seemed feasible because the study area is a pristine headwater basin predominantly covered by forest with minimal disturbance by human actions. Besides, this model has been successfully used in the East River Basin (Wu and Chen 2013a, b). 2.3 Input Data and Model Setup The SWAT model requires inputs regarding weather, topography, soil, and land cover. Geospatial data and model parameterization. As in the previous studies (Wu and Chen 2013a, b), the 90-m Shuttle Radar Topography Mission (SRTM) Digital Elevation Model (DEM) data was used to delineate the study area into 11 subbasins (see Fig. 1). The 30-m land cover data for 2000 from the Chinese Academy of Sciences and the digitalized soil data published by Guangdong Soil Survey Office were used for parameterizing the model (Wu and Chen 2013a). The land uses in the Xunwu River Basin (above Lizhangfeng) were divided into four major groups: forest (85.30 %), agricultural land (13.45 %), pastureland (1.24 %), and urban (0.01 %). The soil map indicates red soil type for this area. The multiple Hydrological Response Unit (HRU) option in SWAT was used to represent each unique field as a separate unit, resulting in 67 HRUs. Climate data. The model requires daily climate data including precipitation, maximum/ minimum air temperature, solar radiation, wind speed, and relative humidity. All the climate data except for solar radiation were obtained for the Xunwu station (the only available weather station in the study area, Fig. 1) from the National Climatic Data Share Center of China (http://cdc.cma.gov.cn/home.do), covering our 50-year (1955–2004) study period. Because solar radiation data are not available in China’s dataset, we used the re-analysis data from the National Centers for Environmental Prediction and Atmospheric Research (NCEP/NCAR) covering a 38-year period of 1966 to 2003 for Xunwu (http://www.esrl.noaa.gov/psd/data/reanalysis/reanalysis.shtml). Considering the solar-radiation trend was fairly stable, we used the annual average to fill in the missing values. Streamflow data. The observed monthly streamflow data at the Lizhangfeng station, which is at the outlet of the study area (Fig. 1), covers a 12-year (1977–1988) period only, and they were used to calibrate and validate the SWAT model. 2.4 Model Calibration and Validation Hydrological models usually contain parameters that need to be estimated through calibration so that observed and predicted output values agree (Beven 2001). Through reviewing literature related to SWAT calibration and previous studies in this region, we selected seven parameters
Climate Change
4389
for model calibration (Table 1) using the built-in auto-calibration procedure (Green and van Griensven 2008). In this study, because the streamflow observations at Lizhangfeng are available for a 12year period only, SWAT was calibrated using the first six-year (1977–1982) record of the monthly streamflow, and then validated using data collected for the subsequent six years (1983–1988). We also used baseflow filter (Arnold and Allen 1999) to derive the slowresponse subsurface flow (i.e., both lateral flow from soil profile and baseflow from the shallow aquifer), which was also used to validate the simulated component. However, since the study period covers 50 years (1955–2004), the simulated hydrological variables by the calibrated model were used for the subsequent statistical analysis. This seemed feasible because the study area is a pristine headwater basin predominantly covered by forest and was undeveloped with minimal disturbance by human actions and the calibrated parameters are generally related to topography, soil, and land cover (Table 1). Additionally, we used a twoyear warm-up period (1953–1954) to minimize the impacts of uncertain initial conditions in the model simulation. 2.5 Statistical Analysis and Variables of Interest Is there a statistically significant uptrend or downtrend for the climate and hydrology in this area? To address this question, we used the least squares method to obtain the linear fits of trends in all variables of interest. If the slopes of fitted linear lines are significantly different from zero (t-test: P