Diagnosing Slow Web Page Access at the Client Side Tobias Flach, Ethan Katz-Bassett, and Ramesh Govindan Department of Computer Science University of Southern California
ABSTRACT Transient performance anomalies when accessing websites can be hard to replicate and make it difficult to detect and remedy their root causes. We propose a tool which passively monitors browser behavior and network traffic, while actively probing the network when detecting performance anomalies, and determining their root causes.
Categories and Subject Descriptors C.2.3 [Network Operations]: Network Monitoring; C.4 [Performance of Systems]: Measurement techniques, Performance attributes
Keywords Internet Measurements; Web Latency; Performance Anomalies
1.
INTRODUCTION
Detecting and diagnosing performance problems via measurements from a client perspective has been studied for a long time and a variety of tools has been proposed to help explain why some users observe slow web access. For example, Fathom [2] provides an API accessible by web page providers to take measurements when loading a page, whereas Netalyzr [4] analyses the network performance in general and is particularly useful in situations where a client observes persistent connectivity issues. Web pages have become increasingly complex and often require fetching content from many sources [1]. This makes it more challenging to establish which resource(s) are responsible for the degraded performance. In addition, users often observe bad performance sporadically. A web page might normally display after a very short delay, and only occasionally takes several seconds before the rendering process starts. A possible reason for this could be a costly recovery from a TCP tail packet drop when fetching a resource which has many dependents. We also observed cases where a web site request is pending Permission to make digital or hard copies of all or part of this work for personal or classroom use is granted without fee provided that copies are not made or distributed for profit or commercial advantage and that copies bear this notice and the full citation on the first page. Copyrights for components of this work owned by others than ACM must be honored. Abstracting with credit is permitted. To copy otherwise, or republish, to post on servers or to redistribute to lists, requires prior specific permission and/or a fee. Request permissions from
[email protected]. CoNEXT Student Workshop’13, December 9, 2013, Santa Barbara, CA, USA. Copyright 2013 ACM 978-1-4503-2575-2/13/12 ...$15.00. http://dx.doi.org/10.1145/2537148.2537160.
indefinitely, yet fetching the content finishes quickly after refreshing the page. Thus, we propose a tool which: • passively monitors browser behavior as well as network traffic, • actively probes the network when an anomaly has been detected, and • classifies the anomaly and determines root causes based on the collected data and feature-cause mappings. The user benefits from such a tool by getting educated about the factors causing slow web page access. In addition, even though events like this might be rare for a single user, the aggregate frequency can be large enough for a content provider to have an incentive to address the problem. Consequently, a better understanding of the root causes is useful to the content providers as well.
2.
COMPARISON TO OTHER WORK
It is challenging to reproduce transient performance anomalies, yet we want to understand their underlying causes in order to prevent them in the future. Due to their transient nature, existing measurement tools are insufficient for this task. Client-side frameworks like Fathom or Netalyzr, either provide a general performance overview, i.e. they only inspect the “average” performance thus ignoring anomalies which only show up in a small fraction of data points, or require a significant amount of overhead to guarantee that anomalies can be detected (which might be associated with any of the fetched resources). Other tools like Mirage [6], a headless web client to analyze page load times, or BISmark [5], a platform instrumenting home routers for measurements, are hard to deploy and focus on detecting widespread performance anomalies. Conversely, server-side mechanisms have only partial visibility into the application flow at the client since they only observe traffic to and from the client passing through the measurement node. As a result some performance anomalies remain hidden. For example, a content provider cannot observe unsuccessful connection attempts made by the client, or recognize interference caused by other applications running on the client machine. Our solution complements existing frameworks and is tailored for the detection and analysis of transient performance anomalies.
3.
HANDLING ANOMALIES
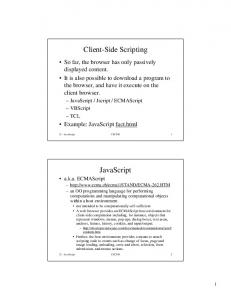
In Figure 1 we show the architecture of our tool, which consists of two components: a data collection and a data
Active Tab
Passive Passive Passive Tabs Windows Windows
Requested Requested Requested Resources Resources Resources
TCP Requested Requested Connections Resources Resources
Requested TCP packets Requested Resources Resources
Aggregate Statistics
Aggregate Statistics (for other traffic)
Pings + Traceroutes (limited)
Browser
Data Collection
Anomaly Rule Set
Anomaly Detection and Classification Data Analysis
Figure 1: Tool Architecture
analysis module. Both components are managed by a browser extension, which has also access to diagnostic tools like tcpdump, ping, or traceroute. Data Collection. Our browser extension continuously collects passive measurements, including metadata for each tab (like the resources requested and rendered in each tab) as well as temporarily buffered records of raw TCP connections and packets, accessible by running tcpdump in the background. When the analysis is triggered, either explicitly by the user or through predefined timer events (e.g. long request/response delay), we preprocess all available data. For the active tab, i.e. the tab where we expect to observe a performance anomaly, we keep all recorded data and associate resources requested by the browser with the TCP connections and packets responsible for fetching the data. In addition, we determine the hosts from which the resources were requested and issue traceroutes and pings to them. These data points are particularly useful to detect routing anomalies. Since we only issue the active measurements when the analysis stage is triggered, we avoid the unnecessary overhead of executing them during normal operation when network performance is satisfactory. We can further reduce the number of active probes by focusing on resources critical for the page load process. As such we can incorporate a selector avoiding data collection for resources like advertisements, popups, small icons, etc. For all other (passive) tabs and applications we compress the available data into aggregate statistics, including metrics like throughput and packet loss rates. This enables the analysis module to detect performance anomalies caused by interference between different browser tabs and/or applications. Data Analysis. First, we annotate TCP connections and packets by inspecting the observed packet traces and detecting features like fast retransmits, timeouts, reordering, depleted receiver window (rwnd). In a clustering step, we group traces with common properties together to help the detection of entities affected by a performance anomaly. For example, connections to different hosts can exhibit similar performance characteristics if the problem is located within the path segment shared by the routes to these hosts. In this case we can detect shared subpaths by inspecting traceroutes collected during the active measurement phase right before the analysis is triggered. Next, we use a predefined set of rules to map performance characteristics including the aggregated statistics and annotations to anomaly types. Example mappings are shown in Table 1. We partially derived this initial set from a manual inspection of anomaly
Feature(s) High RTT AND filled rwnd High packet loss Tail packet loss High packet reordering HTTP request w/o response Consecutive RTOs (HTTP GET) Low TP on all connections Low TP AND high TP on other connections
Anomaly type BDP limitation Network congestion TCP limitation Packet-based load balancing Backend error / reachability Backend error / reachability Access bandwidth limitation Unfair bandwidth allocation
Table 1: Examples for mapping performance features to anomaly types (TP = throughput, BDP = bandwidth delay product, RTO = retransmission timeout, RTT = round trip time, TP = throughput)
indicators observed in an earlier study [3] and ground truth about the underlying cause. Finally, we generate a report for the user explaining the detected anomalies. This helps nonexperts to gain a better understanding of network dynamics and their impact on performance. Expert users can use the information to pinpoint performance issues and possibly develop solutions to avoid them in the future. Optionally, the user can export the report and the raw data (in anonymized form), which can then be forwarded to the resource provider similar to a bug report. Extending the Rule Set. To continously improve the analysis stage we aim to extend the rule set through a feedback loop. We achieve this through a component which lets the user report data associated with unclassified anomalies to a centralized cloud platform. In a semi-automatic way, we then cluster the data collected from multiple users based on common features and identify new mappings between features and anomaly types.
4.
CONCLUSION AND NEXT STEPS
We propose a tool to detect transient performance anomalies at the client side and determine their root causes. It supplements existing frameworks which primarily focus on persistent anomaly detection, as well as active measurements as the primary data source. We are currently working on an implementation of our solution in the Chrome browser and we believe that providing explanations for slow web page accesses experienced by users is a sufficient incentive to generate a solid initial customer base for the tool. Finally we note that we plan to investigate an extension of our framework to support deployment on mobile devices as well.
5.
REFERENCES
[1] M. Butkiewicz, H. V. Madhyastha, and V. Sekar. Understanding Website Complexity: Measurements, Metrics, and Implications. In Proceedings of the Internet Measurement Conference (IMC), 2011. [2] M. Dhawan, J. Samuel, R. Teixeira, C. Kreibich, M. Allman, N. Weaver, and V. Paxson. Fathom: a Browser-based Network Measurement Platform. In Proceedings of the Internet Measurement Conference (IMC), 2012. [3] T. Flach, N. Dukkipati, A. Terzis, B. Raghavan, N. Cardwell, Y. Cheng, A. Jain, S. Hao, E. Katz-Bassett, and R. Govindan. Reducing Web Latency: the Virtue of Gentle Aggression. In Proceedings of the Conference of the ACM Special Interest Group on Data Communication (SIGCOMM), 2013.
[4] C. Kreibich, N. Weaver, B. Nechaev, and V. Paxson. Netalyzr: Illuminating the Edge Network. In Proceedings of the Internet Measurement Conference (IMC), 2010. [5] S. Sundaresan, W. De Donato, N. Feamster, R. Teixeira, S. Crawford, and A. Pescap`e. Broadband Internet Performance: A View From the Gateway. In ACM SIGCOMM Computer Communication Review, 2011. [6] S. Sundaresan, N. Feamster, R. Teixeira, and N. Magharei. Measuring and Mitigating Web Performance Bottlenecks in Broadband Access Networks. In Proceedings of the Internet Measurement Conference (IMC), 2013.