Complex systems such as a car brake, circulatory system, or legislative .... the sides of the brake drum are two thick semicircular structures called the brake ...
Diagrams and Descriptions in Acquiring Complex Systems Julie Heiser and Barbara Tversky (jheiser,{bt}@psych.stanford.edu) Department of Psychology Jordan Hall, Building 420 Stanford, CA 94305 USA
Abstract Complex systems such as a car brake, circulatory system, or legislative system can be conveyed by language or diagrams. Such systems can be presented from structural or functional perspectives. In three experiments, we examine communicating structure and function of mechanical systems (bike pump, car brake, pulley system) by text and diagrams in relation to mechanical ability. By adding arrows, structural diagrams can be enriched to convey functional information. Inferring structure from function was easier than inferring function from structure. Participants high in mechanical ability outperformed low participants except when text perspective matched question perspective. Those with low mechanical ability are at a disadvantage, especially for inferring function from diagrams. Comprehension of complex systems depends in sensible ways on perspective, medium, and ability.
Conveying Complex Systems When we learn about a new digital camera, attempt to troubleshoot a broken-down car, or try to understand a new finding in neuroscience, we need to understand a complex system. Despite the ubiquity of contact with complex systems, understanding them or interacting with them can be frustrating. The frustrations are due not only to the complexity of the systems but also to the inadequacy of instructions and explanations. Effective explanations of complex systems have a complexity of their own. Effectiveness depends on the perspective of the information to be conveyed, on the medium of conveying the information, and on the ability and expertise of the learner. Some of these complex interactions have been examined in previous work, though finding generality in the conclusions has been elusive (e.g., Hegarty, et al., 1990; Hegarty, et al., 1993; Mayer & Gallini, 1990; Morrison and Tversky, 2000). More clarity may be achieved by an analysis of the information to be conveyed relative to characteristics of the media and to qualities of individual differences. Information about complex systems is of two types: structural information, the configuration of parts or topology of the system, and functional information, the sequence of operations and outcomes. The configuration of parts has a spatial or metaphorically
spatial structure, and the sequence of operations has a temporal, causal structure. The primary media for conveying complex systems are language and diagrams. With an increasing emphasis on visual displays of information, we found it important to investigate the success that diagrams have in comparison to text in communicating this information. Structural information should be effectively conveyed in diagrams because diagrams use elements and relations in space to convey actual topology. Furthermore, arrows indicating the sequence of operations can be added to a diagram to convey functional information. There are conflicting results on the relations between medium and ability. Some studies show that people with low ability benefit from diagrams and others show that people with low ability have difficulties extracting information from diagrams (Hegarty 1992; Larkin & Simon, 1987; Mayer, 1989) An analysis of information perspective may reconcile these conflicting findings. In particular, low ability participants or novices may be able to extract structural but not functional information from diagrams. Functional information must be inferred from diagrams, in contrast to structural information, which is explicit. Three experiments examine the interactions of medium, content, and ability in the comprehension of complex systems. We use three systems that have been used with success in previous literature, a pulley system (adapted from Hegarty & Just, 1993), car brake and bicycle pump (both adapted from Mayer & Gallini, 1990).
Experiment 1: Descriptions from Diagrams Diagrams of complex systems are excellent for conveying structural information as they use space and the elements in it to convey real or conceptual elements and the relations among them. Adding arrows may facilitate conveying functional information as arrows indicate the temporal sequence of operations. Participants were asked to describe what is depicted in a diagram of a complex system, without and with arrows.
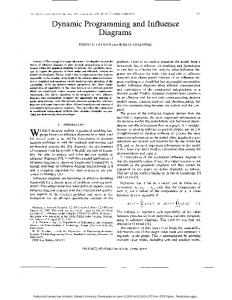
Method Participants Participants were 67 psychology students fulfilling a course requirement. Thirty-four participants described diagrams without arrows; 8 a car brake, 14 a bicycle pump, and 12 a pulley system (see Figure 1 for example of car brake diagram with arrows). Thirty-three participants described diagrams with arrows; 8 a car brake, 12 a bicycle pump, and 13 a pulley system. Procedure Participants were first asked to rate their mechanical ability and prior knowledge of the device given to them on a 1 to 7 scale, 1 = poor, 7 = excellent. In the 3 experiments reported here, participants self-rated their mechanical ability and their prior knowledge of the complex system presented. We chose a self-rated measure as it has been found to correlate with actual mechanical ability and spatial ability (Hegarty & Just, 1993; Heiser & Tversky, in prep). Participants were shown one of three diagrams: a car brake (Figure 1), bicycle pump, or a pulley system, either without or with arrows and asked to “Please examine the diagram above. On the lines below, write a description of the system in the diagram.”
the features of the components (i.e. the shape of a part) counted as structural information. Descriptions of the function of the system, the function of individual parts or the way the parts work together, counted as functional information. In the previous example, the first proposition, “the brake fluid is liquid” was coded as structural. The second proposition, “ the brake fluid travels down the tube” was coded as functional. Coders agreed 94%, and disagreements were settled through discussion.
Results and Discussion There were no main effects for diagram content, selfrated ability or total number of propositions across conditions. As predicted, participants who described diagrams with arrows produced significantly more functional units of information (M = 2.24, SD = 1.3) than participants who described diagrams without arrows (M = 1.26, SD= 1.1), F (1,61) = 10.9, p < .01. Similarly, participants who described diagrams without arrows generated significantly more structural units (M = 1.65, SD = 1.65), than those who described diagrams with arrows (M = .52, SD = .62), F (1,61) = 13.67, p < .01. The presence of arrows in a diagram of a mechanical system indicates the sequence of operations of the system. From the temporal sequence, participants readily made inferences to the function of the system, and described it in those terms.
Experiment 2: Diagrams from Descriptions Is the use of arrows to convey temporal, causal sequence so established that producers of diagrams will comply? Participants read either a structural or a functional description of a complex system, and produced a diagram. Figure 1: Car brake diagram with arrows (adapted from Mayer & Gallini (1990)) Coding Self-rated mechanical ability and self-rated prior knowledge of system correlated highly (r = .78, p < 01). They were averaged to provide a single ability score, ranging from 1-7 (poor-excellent). Descriptions of diagrams were coded blindly. Two coders divided each description into propositions. Coders were told that a proposition is the smallest unit of meaning in a sentence. For example, in the sentence “the liquid brake fluid travels down the tube,” there are two propositions. First, “the brake fluid is liquid” and second, “the brake fluid travels down the tube.” Coders categorized each proposition as structural or functional. Descriptions of the system structure or of
Method Participants 240 students in an introductory psychology course at Stanford University participated for course credit. Forty-four participants either did not draw a diagram or did not complete the questionnaire, leaving 93 participants in the functional description group and 103 in the structural description group, distributed fairly evenly across the three systems. Stimuli Structural and functional descriptions were written for each of the three systems, the car brake, bicycle pump, and pulley system. Those for the car brake appear in Table 1 and 2. Structural descriptions contain details of parts and their spatial relations, primarily using forms if the verb “to be” or verbs of fictive motion. Functional
descriptions contain actions and primarily using active verbs of motion.
consequences
structural descriptions were high mechanical ability participants (see Figure 2 for examples).
Table 1: Car brake structural description “The brake or brake drum is a circular structure. Directly inside the sides of the brake drum are two thick semicircular structures called the brake shoes. The brake fluid reservoir is located above and to the side of the brake drum. From the brake fluid reservoir, a tube runs down sideways and then down to the middle of the brake drum. Extending from both sides of the tube in the middle of the brake drum are wheel cylinders surrounding small pistons. Brake fluid can move from the reservoir through the tube to the pistons. The small pistons can move outward toward the brake shoes. The brake shoes can move outward toward the brake drum.”
Table 2: Car brake functional description “From the brake fluid reservoir, brake fluid enters and travels sideways and down the tube. As the brake fluid accumulates at the bottom of the tube, pressure is exerted on the small pistons inside the wheel cylinders. This causes the pistons to push outward toward the brake drum. The outward movement of the shoes causes friction along the inside of the brake drum, slowing the rotation of the wheel.”
Procedure Participants first rated their mechanical ability on a 1 to 7 scale, 1 = poor and 7 = excellent and their specific knowledge of the depicted mechanical system on the same scale. Participants then read a description of one of three labeled systems (car brake, bicycle pump, or pulley) and were asked: “In the space provid ed below the description, please construct a diagram of what you think the description is trying to convey.” Coding Self-rated mechanical ability and self-rated prior knowledge of the device were highly correlated, r = .72, p < 01. They were averaged to produce a single ability score for each participant. Diagrams were coded blindly by two coders for conventional elements, such as arrows or lines, that conveyed either structure or function. There were no disagreements in coding.
Results As before, there were no effects of mechanical system or for self-rated ability. Of the 196 depictions coded, the only graphical element added was arrows. The arrows were to indicate direction of motion of the mechanical system. As predicted 62/93 (66.7%) who depicted functional descriptions used arrows in their depiction to indicate sequence of operation, whereas 16/103 (15.5%) participants who depicted structural descriptions included arrows, X2 (N = 196) = 9, p .1 (see Figure 3). Structure was conveyed equally well by text and diagrams. Response time, however, was significantly longer on structural questions after studying a diagram (M = 5.1s, SD = 1.4s) than after studying a text (M = 4.2s, SD = 1.3s), F (1, 131) = 13.6, p < .01. This effect may be due to extra time required to translate a visual representation into a sentential representation in order to answer the verbal questions. Effect of Perspective There were no effects of perspective (structural or functional) on errors or response time on structural questions. Participants made similar numbers of errors on structural questions if a structural perspective was studied (M = 1.89, SD = 1.39) than if a functional perspective was studied (M = 2.13, SD = 1.41), p > .05 Though in this analysis, diagrams have a clear advantage because structure remains explicit in the diagram with arrows, the interaction between presentation and perspective was not significant, p > .1.
The finding that both high and low mechanical ability participants did not differ significantly on structural errors regardless of study perspective indicates that they were able to efficiently make inferences from function to structure. 4
Mean Error on Structural Questions Across Subjects
3.5
3
2.5
2
1.5
1
0.5
0
Low
High
No arrow diagram
Low
High
Arrow diagram
Low
High
Structural Text
Low
High
Functional Text
Figure 3. Errors on structural questions by ability, perspective and medium.
inferences from structural descriptions and diagrams, with or with out arrows. When functional information is presented verbally, low ability participants are no longer disadvantaged. Effect of Perspective There was a slight benefit for functional questions from studying functional material, however this effect was only marginally significant, F (1,139) = 3.5, p = .06. Performance was higher on functional questions after studying functional text or diagrams with arrows (M = 1.73, SD = 1.48), than after studying structural text or diagrams (M = 2.45, SD = 1.69). There were no differences in response times. There was an interaction between perspective and medium. Errors on functional questions were higher after studying a structural text (M=3.0, SD=1.7) than after studying a diagram without arrows (M=1.87, SD=1.5), functional text (M = 1.71, SD = 1.27) or diagram with arrows (M = 1.75, SD = 1.68), F(1, 139) = 17.48, p < .01. In general, participants were better at making functional inferences from diagrams, than from structural text.
Learning Functional Information
Effect of Medium There were no overall effects of medium on errors and response times on functional questions. However, medium and perspective interacted, F(1, 139) = 8.02, p < .01. High ability participants made fewer errors on functional questions when diagrams were studied (M = 1.1, SD = 1.1) than when text was studied, whereas low ability participants made fewer errors when text was studied (M = 2.6, SD = 1.6) than when diagrams were studied (M = 3.0, SD = 1.6). This effect however, could be driven by interaction between perspective of study and medium, where participants performed extremely well if functional text was studied, but not structural text. This is further discussed in the next section. Interestingly, high ability participants outperformed low ability participants on functional questions in all conditions except when functional text was studied (see Figure 4). These results indicate that low ability participants have difficulties making functional
4
3.5
Mean Errors on Functional Questions Across Subjects
Effect of Ability For functional questions there was a main effect for ability, where high mechanical ability participants made fewer errors (M = 1.44, SD = 1.3) than low ability participants (M= 2.75 SD= 1.6), F(1, 145) = 29.6, p.1. Mechanical ability interacted with medium. See the following section for details.
3
2.5
2
1.5
1
0.5
0
Low
High
No arrow diagram
Low
High
Arrow diagram
Low
High
Structural Text
Low
High
Functional Text
Figure 4: Errors on functional questions by ability, perspective and medium. Experiment 3 Discussion Structural information was effectively conveyed by well-constructed diagrams and text, from the perspective of the system’s structure or function. Mechanical ability of the participant, however, is important for predicting errors on structural questions. The results for functional information were quite different. Again, high mechanical ability participants outperformed low ability participants. This result was conditional upon presentation, however, where low ability participants performed as well as high ability participants when functional text was studied. Low ability participants were at their worst when functional inferences had to be made from diagrams. The results from Experiment 3 help to clarify the relationship between ability and comprehension of diagrams, illustrating the importance of the information
to be conveyed. Low mechanical ability participants were able to learn structure from both diagrams and text, but needed functional text to aid learning functional information.
General discussion Complex systems consist of structural information, a configuration of parts, and functional information, a sequence of operations and outcomes. The present research investigated the effects of medium, text and diagram, perspective of presentation, structural or functional, and ability on acquisition of complex systems. Diagrams use elements and relations in space to convey elements and relations in real or conceptual space. Thus, diagrams are especially suited to convey structural information. Experiment 1 and 2 showed that a simple addition to diagrams, arrows, enables a static diagram to convey functional information effectively. Participants spontaneously interpreted diagrams with arrows functionally, and produced diagrams with arrows for functional descriptions. In global acquisition of complex systems, however, arrows were sufficient for participants with high mechanical ability but not for those with low mechanical ability. In Experiment 3, participants were more adept at inferring structural information from functional than functional from structural. Apparently, function imposes more constraints on structure than structure imposes on function, in accordance with the design adage that form follows function. This means that function is not necessarily transparent from form. This fact is substantiated by the performance of low ability participants, who, in contrast to high ability participants, had trouble making functional inferences from diagrams. Similarly, Suwa and Tversky (2001) found that experienced architects were more likely to extract functional information from their sketches than novices. Low ability participants reached the level of high ability participants when the perspective of the questions matched that of the studied text. This suggests that the text guides the learner in forming a mental model of that information, especially for low ability learners. For this type of complex systems, including car brakes and bicycle pumps, the disadvantages of low ability can be overcome by the addition of explicit functional information. These results have implications for theories of diagrammatic reasoning. The findings indicate that learners of all abilities are able to extract essential parts and their interrelations from diagrams; however the advantage of diagrams disappears when learners with low mechanical ability are asked to make inferences beyond what is conveyed explicitly in the diagram.
In addition, these results have implications for design of instructions and explanations as well as comprehension of complex systems. Instructions and texts depending solely on diagrams will be ineffective for some users, especially for functional information. Instructional illustrations of mechanical, scientific, or abstract systems such as governmental legislation need to include explanatory text. Taking into account the ability of the learner, the perspective of the information, and the medium in which it is portrayed, will dramatically increase the accuracy and amount of information that can be acquired from a portrayal of a complex system.
Acknowledgements The first author is supported by an Eastman Kodak Inc., fellowship. The research is funded by Office of Naval Research, Grants Number NOOO14-PP-1-O649 and N000140110717 to Stanford University.
References Hegarty, M., Carpenter, P. A. & Just, M. A. (1990). Diagrams in the comprehension of scientific text. In R. Barr, M. L. Kamil, P., Mosenthal, & P. D. Pearson (Eds.) Handbook of reading research. New York: Longman. Hegarty, M. and Just, M.A. (1993). Constructing mental models of machines from text and diagrams. Journal of Memory and Language, 32, 717-742. Larkin, J.H. & Simon, H.A. (1987) Why a diagram is (sometimes) worth a thousand words. Cognitive Science, 11, 65-99. Mayer, R.E. (1989) Systematic thinking fostered by illustrations in scientific text. Journal of Educational Psychology, 89(2), 240-246. Mayer, R.E. and Gallini, J.K. (1990) When is an Illustration Worth Ten Thousand Words? Journal of Educational Psychology, Vol. 82 (4), 715-726. Morrison, J. B. (2000) Does Animation Facilitate Learning? An Evaluation of the Congruence and Equivalence Hypotheses. Unpublished Doctoral Dissertation. Department in Psychology, Stanford University. Morrison, J. B., and Tversky, B. (2001). The (In) effectiveness of animation in instruction. In Jacko, J. and Sears, A. (Editors), Chi 01: Extended Abstracts. Pp. 377-378. Danvers, MA: ACM. Suwa, M.,& Tversky, B. (1997). What architects and students perceive in their sketches: A protocol analysis. Design Studies, 18, 385-403.