Dialect classification using vowel acoustic parameters Charalambos Themistocleous a Centre
for Linguistic Theory and Studies in Probability, University of Gothenburg Dicksonsgatan 4, 412 56 Gothenburg, Sweden
Abstract This study provides a classification model of two Modern Greek dialects, namely Athenian Greek and Cypriot Greek, using information from formant dynamics of F 1, F 2, F 3, F 4 and vowel duration. To this purpose, a large corpus of vowels from 45 speakers of Athenian Greek and Cypriot Greek was collected. The first four formant frequencies were measured at multiple time points and modelled using second degree polynomials. The measurements were employed in classification experiments, using three classifiers: Linear Discriminant Analysis, Flexible Discriminant Analysis, and C5.0. The latter outperformed the other classification models, resulting in a higher classification accuracy of the dialect. C5.0 classification shows that duration and the zeroth coefficient of F 2, F 3 and F 4 contribute more to the classification of the dialect than the other measurements; it also shows that formant dynamics are important for the classification of dialect. Keywords: dialect classification, stress classification, formant dynamics, C5.0, vowels 2010 MSC: 00-01, 99-00
1. Introduction Spoken dialect identification refers to the process of determining the identity of a dialect based on acoustic evidence. There are two main theoretical and methodological approaches to spoken dialect identification. The first originates
Email address:
[email protected] (Charalambos Themistocleous)
Preprint submitted to Speech Communication
May 23, 2017
5
from studies on sociophonetics and aims to explain the variation that exists between dialects, sociolects, speech styles, and registers, and the causes that drive language variation and change (Foulkes & Docherty, 2006; Foulkes et al., 2010; Thomas, 2011, 2013). The second approach is automatic dialect classification, which aims to develop technologies for dialect identification in a wide range of
10
speech processing applications, such as in speech-to-text systems, spoken document retrieval, spoken language translation, and in dialogue systems (see Li et al., 2013, for a review), and may result in high classification accuracy of dialects (see Glembek et al., 2009; Dehak et al., 2010; Behravan et al., 2015). Yet, to model speech variation, automatic dialect classification methods (e.g., Joint
15
Factor Analysis and i-vector architectures), employ hyper-parameters that can be hard to interpret for the purposes of sociophonetic research (see Glembek et al., 2009; Dehak et al., 2010; Behravan et al., 2015). The purpose of this study is to offer an account of dialect variation in terms of vowel formants and vowel dynamics, using machine learning methods of-
20
ten employed in automatic dialect classification. To this purpose, this study classifies two varieties, Athenian Greek (AG) and Cypriot Greek (CG), whose phonemic inventories contain the same vowels: /i e a o u/ (Kontosopoulos, 1968; Newton, 1972a,b; Samaras, 1974; Botinis, 1981; Tseva, 1989; Jongman et al., 1989; Nicolaidis, 2003; Sfakianaki, 2002; Fourakis et al., 1999; Loukina, 2009,
25
2011; Themistocleous, 2017). Specifically, AG and CG vowels were produced in controlled settings and measured at multiple time points, which were then evaluated using a second degree (2nd ) polynomial fit. This method provides a rich description of vowel formants, as it considers the fluctuation of a formant’s frequency with respect to time and does not rely on a single measurement of
30
formants at the middle of the vowel’s duration (e.g. Cooper et al., 1952; Lisker, 1957, 1975; Stevens & Klatt, 1974; Rosner & Pickering, 1994; Themistocleous, 2017). The polynomial fit is appealing as each of the coefficients of the polynomial relates to characteristics of a formant contour, such as its position on the frequency axis (zeroth order coefficient) and the shape of the curve (see
35
also Cohen, 1995). Earlier studies by McDougall (2005; 2006) and McDougall 2
& Nolan (2007) using polynomial equations for regression showed that 2nd and 3rd degree polynomials perform better at 89-96% than raw data and static measurements of vowels (see also Van Der Harst et al., 2014). A key difference of this study with respect to most automatic language identification studies is that 40
it employs a text-dependent approach, whereas most other studies on language identification employ a text-independent approach (see for a discussion of these approaches Atal, 1974; Doddington, 1985; Farrell et al., 1994; Furui, 1997; Gish & Schmidt, 1994; Reynolds & Rose, 1995; Larcher et al., 2014; Mporas et al., 2016).
45
For the classification, we evaluated three different types of discriminative classifiers: Linear Discriminant Analysis (LDA), Flexible Discriminant Analysis (FDA), and C5.0. These classifiers as opposed to generative models, such as Naive Bayes and Hidden Markov Models (HMMs) do not rely on prior distributions and learned states (Zhang, 2014). The discriminative classifiers identify
50
a class of a specific observation, e.g., the dialect by generalizing from previous measurements. Details for each classifier are provided below. First, LDA is a classifier, which is very similar to multi-response regression. It permits the evaluation of a binary dependent variable using both continuous and categorical predictors (Harrington & Cassidy, 1999). Specifically, it at-
55
tempts to find a linear structure in the predictors that can best separate two or more groups. LDA relies on the Bayesian probability, the maximum likelihood assumption, and requires that the data are normally distributed. A number of studies by Najim Dehak and colleagues showed that LDA can potentially provide good classification outcomes when employed in the reduction of i-vector
60
dimensionalities of acoustic properties in state of the art i-vector architectures for speaker (Dehak et al., 2010; Sadjadi et al., 2016), accent (Behravan et al., 2015), and language classification (Dehak et al., 2011; Sizov et al., 2017). FDA employs non-parametric techniques for the classification of categorical variables (Trevor et al., 1994). So unlike LDA, it does not require that the
65
data are normally distributed. Because not all the predictors of this study are normally distributed, FDA is expected to offer a better classification accuracy 3
than LDA. C5.0 is a classification algorithm developed by Ross Quinlan (Quinlan, 1993). It assesses class factors, such as the dialect, based on a predefined set of pre70
dictors. C5.0 generates a decision tree and offers a ranking of features that can indicate the contribution of each acoustic feature in the classification. Specifically, it evaluates recursively the data and employs the predictors that can provide the best splitting of the data into more refined categories. The splitting criterion is the difference in information entropy (a.k.a., the normalized infor-
75
mation gain). The predictor that provides the highest normalized information gain is the one selected for the decision (see also Woehrling et al., 2009, who provide a classification of regional French varieties, using a different decision tree method). Typically, each split is an interpretation of the variation or impurity in the data. The algorithm will stop when there are not enough data left
80
to split. Finally, C5.0 provides both tree and rule models (for an application of C4.5, which is an earlier iteration of C5.0, on accent classification, see Vieru et al. (2011) and for the classification of stressed and unstressed fricatives using C5.0, see Themistocleous et al. (2016)). To evaluate the effects of vowel acoustic properties on dialect classification,
85
we also provide classification results for stress and vowel. A syllable in Modern Greek can be stressed or unstressed; the position of the stress in a Modern Greek word can change the meaning of the word, e.g., mi"lo ‘speak’ vs. "milo ‘apple’. Stressed vowels are overall longer and more peripheral than the unstressed (e.g., Botinis, 1989; Arvaniti, 1991; Themistocleous, 2014, 2015). We also pro-
90
vide comparative classification models for vowels; yet, unlike previous studies that provide acoustic evidence mainly from AG vowels (Kontosopoulos, 1968; Samaras, 1974; Botinis, 1981; Tseva, 1989; Jongman et al., 1989; Nicolaidis, 2003; Sfakianaki, 2002; Fourakis et al., 1999; Loukina, 2009, 2011; Themistocleous, 2017), this study provides cross-dialectal evidence from AG and CG (see,
95
however Themistocleous, 2017). Also, all previous studies on Modern Greek vowels rely on single acoustic measurements of formant frequencies at the middle of the vowel whereas this is the first study to analyze formant dynamics of 4
Greek vowels.
2. Methodology 100
This section presents the methods employed for the collection and analysis of the acoustic data. It also presents the selection criteria for the classification model reported in the paper. 2.1. Speakers A large corpus of AG and CG vowels was recorded in Athens and Nicosia.
105
These urban areas constitute the capital cities of Greece and Cyprus respectively. 45 female speakers between 19 and 29 years participated in the study: 25 CG speakers and 20 AG speakers. All speakers were born and raised in Nicosia and Athens respectively. Based on information from a demographic questionnaire, the participants from each dialect constituted sociolinguistically homo-
110
geneous groups: they originated from approximately the same socio-economic background and they were all university students, namely all CG speakers were students at the University of Cyprus and all AG speakers were students at the University of Athens. All participants knew English as a second language; four AG participants knew French as a third language. None reported a speech or
115
hearing disorder. 2.2. Speech Materials The speech materials consisted of a set of nonsense words, each containing one of the five Greek vowels (/ e i a o u /) in both stressed and unstressed position, word initially and word medially. The nonsense words had the structure
120
` (e.g., /"asa, "esa, "isa, etc./) or Vs` ` (/"sasa, Vsa a (e.g., /a"sa, e"sa, i"sa, etc./) sVsa "sesa, "sisa, etc./) and sVs`a (/sa"sa, se"sa, si"sa, etc./) and were embedded in the following carrier phrases. The AG carrier phrase was: “"ipes < keyword > "pali” (You told < keyword > again)
125
and the CG carrier phrase was: 5
Table 1: Speech material
Vowel
stressed
unstressed
stressed
unstressed
/e/
"esa
e"sa
"sesa
se"sa
/i/
"isa
i"sa
"sisa
si"sa
/a/
"asa
a"sa
"sasa
sa"sa
/o/
"osa
o"sa
"sosa
so"sa
/u/
"usa
u"sa
"susa
su"sa
“/"ipes < keyword > "pale/” (You told < keyword > again). Each subject produced 80 utterances (i.e., 5 vowels × 2 stress conditions × 2 word placement conditions × 4 repetitions), resulting in a total of 3600 productions. To facilitate vowel segmentation and to control formant transi130
tions at the beginning and the end of a vowel, the voiceless alveolar fricative [s] was selected as the immediate segmental environment–before and after–the designated vowel. Filler words were added in the carrier sentences to provide variation within the experimental material and to minimize speaker’s attention on the experimental words.
135
2.3. Procedures The recordings were conducted in a recording studio in Athens, Greece and in a quiet room at the University of Cyprus in Nicosia, for the AG and CG speech material respectively. Two researchers, a female AG speaker and a male CG speaker (the author), provided standard instructions to the speakers before
140
the recording, e.g., to speak at a normal pace, sit appropriately in front of the microphone, and keep a designated distance. The target words were presented in standard Greek orthography (the stress marks are conventionally represented in Greek orthography). All stimuli were randomized. Between the repetitions there was a two-minute break. The speakers read sentences out loud from a
145
computer screen, at a comfortable, self-selected rate. Recordings were made on a Zoom H4n audio recorder where voice was sampled at 44.1 kHz.
6
For the acoustic analysis, the sounds were analysed by using the open source software Praat 5.3.32 (Boersma & Weenink, 2010). The keywords were located and segmented manually. Specifically, vowel onsets and offsets were located by 150
using simultaneous inspections of the waveform and the spectrogram. Because all measured vowels in the segmental material were interposed between voiceless alveolar fricatives [s], the vowel onset was clearly marked by the beginning of F 2 and F 1 and vowel offset by the end of F 2. Vowel onset was located before the first peak in the periodic waveform and vowel offset was defined as the
155
beginning of the following fricative consonant [s]. The rise of the intensity at the vowel onset and the fall of the intensity at the vowel offset facilitated the segmentation. All segmentation decisions were checked and corrected twice by the first author by using a PRAAT script. 2.4. Measurements
160
The measurements included the vowel formants (F 1, F 2, F 3, F 4) and vowel duration. Praat’s standard LPC-based method was employed for the extraction of vowel formants. To model formant dynamics, 9 measurements at 9 equidistant points from the vowel onset to the vowel offset were conducted. Specifically, vowels were
165
measured at the 10 − 20 − 30 − 40 − 50 − 60 − 70 − 80 − 90% of vowel duration. In order to avoid any effects of the adjacent consonants, only seven equidistant measurements were included in the final analysis, namely from 20% – 80% (see for this practice Jacewicz et al., 2011, p. 686). A polynomial fit was employed to model the formant dynamics of F 1, F 2, F 3, and F 4 and, therefore provide
170
a more detailed and precise characterization of formant frequencies. The Nth degree polynomial is given by
fm,j (t) = a0,m + a1,m t + a2,m t2 + . . . + aN −1,m tN ,
(1)
where t = 1, . . . , 7 is a discrete index that represents the duration of the vowel and j an index that varies from 1, . . . , 4 to denote F 1, F 2, F 3, and F 4 respectively. The index m = 1, . . . , M represents the vowel sample approximated 7
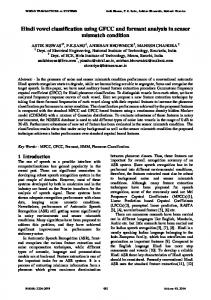
(a) Classification Models for dialect.
(b) Classification Models for Stress.
Figure 1: ROC curves for the models generated by the machine learning algorithms C5.0, FDA, LDA for the classification of speech dialect and stress.
175
with curve fitting. The second degree polynomials employed here result in three polynomial coefficients: the a0 , which corresponds to the starting frequency of the formant, i.e., at the 20% of the actual vowel’s duration, whereas the other two coefficients, namely the a1 and a2 describe the shape of the vowel formants. 2.5. Model Evaluation
180
Three classification algorithms, namely C5.0, FDA, and LDA were employed for the classification of dialect, stress, and vowel. Duration and the three formant coefficients of vowel formants were employed as predictors. To evaluate the classification results from the three classifiers, the data were separated into a training set consisting of the 90% of the data (3240 productions) and an eval-
185
uation set consisting of the 10% (360 productions) of the data; also, a repeated 10-fold cross validation with 3 repeats was employed. For model comparison, we employed the receiver operating characteristic (ROC), the sensitivity, the specificity, and the accuracy (see Table 2 and Figure 1). The sensitivity and the specificity are measures for estimating the per-
190
formance of the binary classifications. The sensitivity shows the proportion of
8
Table 2: ROC, Sensitivity, Specificity of the models generated by SVM, C5.0, FDA, LDA for the classification of speech dialect.
Category
ROC
Sensitivity
Specificity
method
Dialect
0.83
0.75
0.74
C5.0
0.78
0.69
0.74
FDA
0.65
0.68
0.56
LDA
0.91
0.83
0.83
C5.0
0.90
0.80
0.83
FDA
0.89
0.81
0.80
LDA
Stress
Table 3: Metrics for the models generated by C5.0, FDA, LDA for the classification of vowel.
Method
logLoss
ROC
Accuracy
Kappa
Sensitivity
C5.0
0.40
0.91
0.83
0.66
0.83
FDA
1.25
0.79
0.54
0.42
0.53
LDA
1.35
0.75
0.49
0.34
0.46
Method
Specificity
Positive Pred.
Negative Pred.
Detection Rate
Balanced Accuracy
C5.0
0.84
0.83
0.83
0.41
0.83
FDA
0.88
0.55
0.88
0.11
0.71
LDA
0.87
0.55
0.87
0.10
0.67
positives that were correctly identified as positives. The specificity indicates the proportion of negatives that were identified correctly as negatives. The ROC curve visualizes these two measures and enables us to compare the curves of the different models and select the best one. The accuracy is the proportion 195
of true results, namely, the true positives and true negatives. In the case of vowel classification, which is not binary, we relied mainly on the accuracy of the model. The ROC curve is created by plotting the sensitivity of the model against the 1 - specificity. The best curve is the one that approaches to the top left corner of the graph whereas a sub-optimal curve is the one that approaches
200
the 45◦ diagonal of the ROC space (see Figure 1). Overall, C5.0 performed better than the other classification methods. The
9
worst classifier was LDA, which performed suboptimally. For this reason, the classification results will be reported using C5.0. The statistical analysis and the classification was carried out in R (R Core Team, 2016), using caret (Kuhn, 205
2016) and the C5.0, package (Kuhn et al., 2015).
3. Results After curve fitting the vowels, the mean and the standard deviation (SD) of the polynomial coefficients a0 , a1 , a2 were calculated separately for each vowel, stress, and dialect. The results of the polynomial fitting of vowel formants are 210
reported in Table 4; Figure 2 shows the fitted F1, F2, F3, and F4 of the CG stressed vowels; Figure 3 shows the fitted F1, F2, F3, and F4 of the CG unstressed vowels; Figure 4 shows the fitted F1, F2, F3, and F4 of the AG stressed vowels; and Figure 5 shows the fitted F1, F2, F3, and F4 of the AG unstressed vowels. Table 5 shows the mean duration and the standard deviation for the
215
stressed and unstressed vowels in AG and CG. All vowels differ in their intrinsic duration. Overall, stressed vowels are longer than the unstressed vowels. The results reported in this section were all generated by C5.0 with a repeated 10-fold cross-validation with 3 repeats. Note that C5.0 automatically drops the variables that do not contribute to the classification so the remaining
220
output always consists from the predictors that contribute to the classification. Dialect: The classification of the dialect (Accuracy= 0.74, 95% CI [0.71, 0.77], kappa= 0.5) involves all formant frequencies not simply F1, F2, and F3. The coefficients that determine the shape of F2 and F3 are ranked higher than the effects of stress on F1. The contribution of each measurement for the clas-
225
sification of vowels is shown in Table 6. The duration and the starting frequencies of F2, F3, F4, and F1 have the greatest contribution for the classification of the dialect. The polynomials coefficients that determine the shape of the formant contours also contribute to the classification of dialect.
230
Stress: The results of the stress classification—cross-validated, 10 fold, re-
10
Table 4: Mean and SD for of the a0 , a1 , and a2 polynomial coefficients of F1, F2, F3, and F4. Vowel
dialect
Stress
F1 a0
F1 a0
F1 a1
F1 a1
F1 a2
F1 a2
F2 a0
F2 a0
F2 a1
F2 a1
F2 a2
F2 a2
M
SD
M
SD
M
SD
M
SD
M
SD
M
SD
a
CG
Stressed
708.72
196.36
23.09
20.70
-1.45
1.25
1796.25
421.67
6.27
50.30
-0.54
2.96
e
CG
Stressed
567.80
157.86
14.19
18.38
-0.85
0.99
2018.19
427.56
9.35
60.56
-0.78
3.56
i
CG
Stressed
501.40
188.53
12.75
20.33
-0.67
1.18
2262.93
476.78
15.53
52.00
-1.33
2.93
o
CG
Stressed
572.43
166.16
13.69
18.09
-0.83
0.97
1675.04
520.23
0.51
38.17
-0.17
2.48
u
CG
Stressed
507.80
172.26
9.50
25.00
-0.51
1.44
1677.96
558.75
-9.62
62.55
0.63
4.18
a
AG
Stressed
658.45
173.82
25.27
22.33
-1.47
1.22
1779.76
280.62
-2.93
39.73
0.04
2.38
e
AG
Stressed
577.05
119.94
21.29
17.45
-1.25
0.89
1934.62
266.63
3.09
37.96
-0.37
2.23
i
AG
Stressed
478.81
144.17
14.44
20.81
-0.75
1.07
2123.36
351.08
9.85
39.54
-0.85
2.18
o
AG
Stressed
560.13
104.70
21.40
21.49
-1.20
1.13
1576.28
330.91
-11.44
38.11
0.46
2.30
u
AG
Stressed
478.65
117.06
15.08
23.27
-0.74
1.18
1568.11
377.44
-14.20
43.80
0.74
2.75
a
CG
Unstressed
663.27
184.51
14.19
21.69
-1.03
1.26
1791.61
402.67
-3.50
41.37
-0.08
2.71
e
CG
Unstressed
529.05
157.27
8.38
25.98
-0.59
1.47
2026.28
392.70
1.26
50.83
-0.41
3.28
i
CG
Unstressed
475.62
167.96
8.91
26.35
-0.53
1.59
2223.61
464.10
6.33
50.91
-0.82
2.97
o
CG
Unstressed
535.95
158.42
7.07
27.17
-0.50
1.60
1725.24
439.36
-14.28
55.03
0.60
3.89
u
CG
Unstressed
483.44
173.78
2.05
32.87
-0.05
2.13
1803.20
491.43
-22.73
61.84
1.40
4.29
a
AG
Unstressed
584.78
166.34
15.53
23.39
-1.06
1.35
1797.82
272.49
-7.92
22.99
0.25
1.60
e
AG
Unstressed
513.77
155.02
11.27
24.51
-0.77
1.34
1943.32
257.05
-0.95
24.80
-0.27
1.59
i
AG
Unstressed
461.38
184.00
7.98
30.73
-0.41
1.94
2109.45
314.76
-0.33
28.09
-0.40
1.78
o
AG
Unstressed
528.68
143.61
0.45
39.38
-0.02
2.44
1643.82
321.36
-26.41
45.34
1.43
3.13
u
AG
Unstressed
497.87
185.21
-10.30
54.16
0.85
3.51
1708.39
348.29
-31.10
48.11
1.80
3.47
F3 a0
F3 a0
F3 a1
F3 a1
F3 a2
F3 a2
F4 a0
F4 a0
F4 a1
F4 a1
F4 a2
F4 a2
M
SD
M
SD
M
SD
M
SD
M
SD
M
SD
a
CG
Stressed
2833.48
369.66
-15.01
68.13
0.77
3.96
4010.19
801.41
-42.97
98.32
2.36
5.74
e
CG
Stressed
2882.91
344.33
-8.74
56.69
0.54
3.37
3919.62
856.75
-40.44
97.03
2.42
5.67
i
CG
Stressed
3000.88
307.24
-1.39
45.86
-0.11
2.83
4015.08
928.47
-18.64
64.90
0.85
3.65
o
CG
Stressed
2965.85
311.88
-5.72
46.86
0.22
2.86
4030.25
590.04
-22.72
51.29
1.20
3.06
u
CG
Stressed
3011.21
293.61
-9.97
54.80
0.48
3.31
3886.92
857.30
-18.48
60.04
0.93
3.58
a
AG
Stressed
2870.93
222.36
-26.99
50.68
1.50
2.90
4086.23
666.12
-41.91
81.15
2.34
4.83
e
AG
Stressed
2897.85
224.56
-19.24
48.33
1.05
2.66
4087.10
795.51
-44.94
86.77
2.42
4.93
i
AG
Stressed
2930.61
189.79
-11.09
36.12
0.53
1.96
4166.19
599.72
-31.64
72.62
1.58
4.32
o
AG
Stressed
2882.88
209.80
-21.57
38.26
1.12
2.18
3766.96
626.73
-15.84
60.19
0.82
3.41
u
AG
Stressed
2868.23
193.82
-15.08
40.21
0.67
2.20
3713.15
700.25
-20.33
62.87
1.07
3.67
a
CG
Unstressed
2873.43
370.59
-22.79
63.68
1.37
3.91
3944.07
1089.24
-23.92
75.65
1.41
4.70
e
CG
Unstressed
2951.65
310.55
-16.92
52.07
0.90
3.22
4051.97
945.40
-18.31
64.77
1.00
3.98
i
CG
Unstressed
3012.94
296.61
-10.91
45.54
0.39
2.79
4032.84
1044.23
-9.96
46.12
0.33
2.72
o
CG
Unstressed
3020.32
318.88
-18.18
55.19
1.02
3.37
3946.60
989.19
-16.98
42.98
0.92
2.76
u
CG
Unstressed
3100.34
320.73
-23.24
48.13
1.35
3.08
3825.24
1094.19
-18.50
48.67
1.05
3.15
a
AG
Unstressed
2926.55
204.49
-14.78
32.40
0.72
1.96
4192.51
613.37
-12.56
51.33
0.44
3.17
e
AG
Unstressed
2954.14
204.89
-11.38
32.61
0.47
1.80
4225.25
605.10
-8.06
67.08
0.17
3.83
i
AG
Unstressed
2972.61
207.23
-11.19
29.80
0.44
1.85
4206.72
655.20
-8.02
44.32
0.06
2.62
o
AG
Unstressed
2927.39
233.22
-23.65
37.24
1.33
2.29
3800.89
579.00
-20.60
53.87
1.18
3.31
u
AG
Unstressed
2915.60
235.14
-28.97
40.67
1.65
2.66
3727.32
785.16
-26.68
62.37
1.69
3.90
11
Table 5: Mean duration and standard deviation (in ms) for the AG and CG vowels in stressed and unstressed positions. AG Stressed
CG
Unstressed
Stressed
Unstressed
M
SD
M
SD
M
SD
M
SD
/e/
133
28
78
21
137
24
94
19
/i/
115
30
58
20
118
28
83
21
/a/
142
27
94
19
149
26
107
20
/o/
140
28
84
20
139
25
96
22
/u
121
30
68
19
123
27
82
21
Vowels
peated 3 times—yielded a 83% accuracy, (kappa= 0.7). The contribution of each measurement for the classification of vowels is shown in Table 7. Specifically, duration and F1 a1 / a2 , F2 a2 , and F4 contribute more to the classification of stressed vs. unstressed vowels. What is more important 235
however, is that all acoustic properties contribute in different degrees, especially the polynomial coefficients that determine the shape of vowel formants. Notably, the latter suggests that stress has an effect on the formant contour as a whole. Vowels: The classification of vowel shows that all predictors contribute significantly for the classification of vowel categories (classification accuracy= 0.57,
240
95% CI[0.5355, 0.6021], Kappa = 0.5). The best classification results were obtained for vowel /i/, /u/, and /e/ and the worst for /a/ and /o/. The contribution of each measurement for the classification of vowels is shown in Table 9. The polynomial coefficients of F 1 and the polynomial coefficients of F 2 and
245
F 3 are the most important properties for the classification of vowels. In addition to the first three formants, F 4 and duration also contribute to the classification of vowels.
12
Table 6: Rankings of the variable contribution for the classification of dialect.
Rank
Variable
100 %
duration
100 %
F2 a0
100 %
F3 a0
100 %
F4 a0
99.04 %
F1 a0
99.03 %
F2 a2
99.03 %
F3 a2
99.02 %
F2 a1
92.51 %
F3 a1
92.30 %
F1 a1
91.21 %
F4 a1
86.36 %
F1 a2
80.15 %
F4 a2
13
Table 7: Rankings of the variable contribution for the classification of stress.
Rank
Variable
100%
duration
100%
F1 a1
100%
F1 a2
99.99%
F2 a2
99.99%
F4 a0
99.99%
F4 a1
99.97%
F2 a1
99.97%
F3 a2
99.77%
F3 a0
99.17%
F2 a0
98.71%
F1 a0
91.03%
F3 a1
84.85%
F4 a2
Table 8: Classification matrix with the percentage of correctly classified vowels.
classified as
a
e
i
o
u
a
89.30
2.17
6.36
1.41
0.76
e
3.37
91.34
3.64
1.10
0.55
i
2.11
1.24
95.78
0.31
0.56
o
2.43
1.25
4.09
88.83
3.40
u
2.85
0.63
3.20
1.88
91.45
14
Table 9: Rankings of the variable contribution for the classification of vowel.
Rank
Variable
100%
F1 a0
100%
F1 a1
100%
F1 a2
100%
F2 a0
100%
F2 a1
100%
F2 a2
100%
F3 a0
100%
F3 a1
100%
F3 a2
100%
F4 a0
99.79%
duration
99.77%
F4 a1
98.92%
F4 a2
15
4. Discussion In this study, we ran a number of classification experiments using vowel 250
data from two Greek dialects: AG and CG. Specifically, this study tested and evaluated three different types of discriminative classifier before focusing in just one, C5.0, which was found to outperform the other two classifiers, namely the LDA and the FDA in the classification of dialect. The study provides for the first time acoustic evidence of AG and CG formant dynamics, as all
255
previous studies on Greek vowels rely on a single measurement at the middle of the vowel formant (Kontosopoulos, 1968; Samaras, 1974; Botinis, 1981; Tseva, 1989; Jongman et al., 1989; Nicolaidis, 2003; Sfakianaki, 2002; Fourakis et al., 1999; Loukina, 2009, 2011; Themistocleous, 2017). It also provides for the first time evidence of the F 3 and F 4 of Cypriot Greek vowels. More importantly,
260
the study shows that formant measurements of F 1–F 4, dynamic measurements, and duration result in high classification accuracy of these two varieties using C5.0 decision trees. An advantage of the method employed in this study is that it resulted in a classification of Greek dialects, using features from vowels that can be read-
265
able by humans and can be interpreted from a sociophonetic point of view to explain sociophonetic variation. In other words, the classification explains how dialect affects formant dynamics, and vowel duration, using the actual values of formants and duration. Notably, C5.0 classification showed that the most significant acoustic properties for the classification of the two Greek dialects are
270
duration and the polynomial coefficients of F 2, F 3, F 4, and F 1—in this order. Also, it showed that the effects of the dialect pertain higher order formants, such as F 3 and F 4. In fact, F 4 contributes more to the classification of dialect than F 1, which—along with F 2—plays an important role for the classification of vowel and stress. Overall, our findings indicate that the effects of dialect
275
are not located on specific acoustic properties of vowels but affect all measured acoustic properties in different degrees, as became evident by the ranking of the acoustic measurements in the classification model.
16
With respect to stress, the classification showed that stressed vowels are longer than unstressed vowels. This finding corroborates earlier studies on 280
CG (Themistocleous, 2017) and AG vowels (e.g., Botinis, 1989; Arvaniti, 1991; Fourakis et al., 1999; Loukina, 2009, 2011; Themistocleous, 2017). More specifically, the classification demonstrated that duration contributes greatly to the distinction between stressed and unstressed vowels (e.g., see Jongman et al., 1989; Nicolaidis, 2003; Arvaniti, 1991, 2000; Sfakianaki, 2002; Fourakis et al.,
285
1999; Themistocleous, 2017). Moreover, the formant dynamics of AG and CG vowels also contribute to the classification of stress, that became evident by the contribution of a1 and a2 polynomial coefficients, which determine the shapes of the contours of F 1 and F 2 in the classification of stress. In fact, their ranking in the classification was higher than that of the starting frequency (i.e., the a0 ),
290
which suggests that there is a difference in the shape of the formant contours of stressed and unstressed vowels. The most significant factors for the classification of vowels are the polynomial coefficients of F 1 followed by the polynomial coefficients of F 2. So, the findings corroborate earlier studies, which suggest that F 1 and F 2 are the most sig-
295
nificant formant frequencies for the classification of vowels (e.g. Cooper et al., 1952; Lisker, 1957, 1975; Stevens & Klatt, 1974; Rosner & Pickering, 1994). Also, AG and CG differ in the F 3 formant frequency, which follows F 1 and F 2 in significance based on the C5.0 ranking. This finding is consistent with previous findings by Themistocleous (2017), who shows that AG high vowels /i
300
u/ and the back /o/ had a significantly lower F 3 than the corresponding CG vowels; this suggests that AG vowels are characterized by more lip-rounding than the corresponding CG vowels (Themistocleous, 2017). Also, a1 and a2 polynomial coefficients of vowel formants were employed for the classification of vowels. These coefficients determine the shape of the formant contour, which
305
suggests that the overall shape of formant contours differs form vowel to vowel. Note that the duration in the classification of vowels is ranked lower than in the case of stress and dialect, which suggests that formants are more important than duration for the classification of Greek vowels. 17
Overall, the same acoustic measurements can distinguish the dialect, the 310
stress, and the vowel. The ranking of acoustic measurements determines the classification results in the three classification cases. For instance, for the classification of dialect and stress, C5.0 classifier identifies the duration as a more important factor than vowel formants. Also, it identifies F 4 as more important for the classification of dialect than for the classification of vowels.
315
To conclude, this work established the effects of the acoustic properties of AG and CG vowels in highly controlled settings for the classification of dialect, vowel, and stress. Overall, text-dependent studies such as this one can result in high accuracy. In a future study, it is worth comparing these findings with a text-independent study of vowels produced in other types of speech data and
320
in more realistic, less-controlled scenarios.
5. Acknowledgements I would like to thank Professor Paul Foulkes and the two anonymous reviewers for their comments and suggestions, which greatly improved the paper.
6. Bibliography 325
Arvaniti, A. (1991). The phonetics of modern Greek rhythm and its phonological implications. Ph.D. thesis Cambridge University. Arvaniti, A. (2000). The phonetics of stress in Greek. Journal of Greek Linguistics, 1 , 9–39. Atal, B. S. (1974).
330
Effectiveness of linear prediction characteristics of the
speech wave for automatic speaker identification and verification. Journal of the Acoustical Society of America, 55 , 1304–1312. URL: https://www. scopus.com/inward/record.uri?eid=2-s2.0-0016067897&doi=10.1121% 2f1.1914702&partnerID=40&md5=464557fdc167e6bf8f8959df140bd96e. doi:10.1121/1.1914702.
18
335
Behravan, H., Ville, H., & Kinnunen, T. (2015). Factors affecting i-vector based foreign accent recognition: A case study in spoken Finnish. Speech Communication, 66 , 118–129. Boersma, P., & Weenink, D. (2010). Praat: doing phonetics by computer. URL: http://www.praat.org/.
340
Botinis, A. (1981). The Greek vowels. Working Papers. Department of Linguistics and Phonetics, Lund University, 21 , 29–36. Botinis, A. (1989). Stress and prosodic structure in Greek : a phonological, acoustic, physiological and perceptual study. Lund: Lund University Press ; Bromley : Chartwell-Bratt.
345
Cohen, L. (1995). Time-Frequency Analysis. Englewood Cliffs: Prentice Hall. Cooper, F., Dellatre, P., Liberman, A., Borst, J., & Gerstman, L. (1952). Some experiments on the perception of synthetic speech sounds. Journal of the Acoustical Society of America, 24 , 597–606. Dehak, N., Kenny, P., Dehak, R., Dumouchel, P., & Ouellet, P. (2010). Front-
350
end factor analysis for speaker verification. IEEE Transactions on audio, speech and language processing, 19 , 788 – 798. Dehak, N., Torres-Carrasquillo, P. A., Reynolds, D., & Dehak, R. (2011). Language recognition via ivectors and dimensionality reduction. Interspeech 2011 , (pp. 857–860).
355
Doddington, G. R. (1985).
Speaker recognitionidentifying people by their
voices. Proceedings of the IEEE , 73 , 1651–1664. URL: https://www.scopus. com/inward/record.uri?eid=2-s2.0-0022150488&doi=10.1109%2fPROC. 1985.13345&partnerID=40&md5=09a050861d5592dd783df0f958572127. doi:10.1109/PROC.1985.13345. 360
Farrell, K. R., Mammone, R. J., & Assaleh, K. T. (1994). Speaker recognition using neural networks and conventional classifiers. IEEE Transactions on Speech and Audio Processing, 2 , 194–205. URL: https://www. 19
scopus.com/inward/record.uri?eid=2-s2.0-0028204659&doi=10.1109% 2f89.260362&partnerID=40&md5=4daab981ce2d0cb41f4908aa14aac680. 365
doi:10.1109/89.260362. Foulkes, P., & Docherty, G. (2006). The social life of phonetics and phonology. Journal of Phonetics, 34 , 409–438. doi:10.1016/j.wocn.2005.08.002. Foulkes, P., Scobbie, J., & Watt, D. (2010). Sociophonetics. In W. Hardcastle, J. Laver, & F. Gibbon (Eds.), The Handbook of Phonetic Sciences (pp. 703–
370
754). Oxford: Wiley-Blackwell. (2nd ed.). Fourakis, M., Botinis, A., & Katsaiti, M. (1999). Acoustic characteristics of Greek vowels. Phonetica, 56 , 28–43. Furui, S. (1997).
Recent advances in speaker recognition.
Recognition Letters, 375
18 ,
859–872.
URL:
Pattern
https://www.scopus.com/
inward/record.uri?eid=2-s2.0-0031223555&partnerID=40&md5= 05bb7ddaa0fc9e8bf8d2ebcae9152d26. Gish, H., & Schmidt, M. (1994).
Text-independent speaker identifica-
tion. IEEE Signal Processing Magazine, 11 , 18–32. URL: https://www. scopus.com/inward/record.uri?eid=2-s2.0-0028516097&doi=10.1109% 380
2f79.317924&partnerID=40&md5=be276f48ccf247eb6aaac768ee17aae4. doi:10.1109/79.317924. Glembek, O., Burget, L., Dehak, N., Br¨ ummer, N., & Kenny, P. (2009). Comparison of scoring methods used in speaker recognition with joint factor analysis. In 2009 IEEE International Conference on Acoustics, Speech and Signal
385
Processing (pp. 4057–4060). doi:10.1109/ICASSP.2009.4960519. Harrington, J., & Cassidy, S. (1999). Techniques in speech acoustics. Dordrecht Boston: Kluwer Academic Publishers. Jacewicz, E., Fox, R. A., & Salmons, J. (2011). Vowel change across three age groups of speakers in three regional varieties of American English. Journal of
390
Phonetics, 39 , 683–693. 20
Jongman, A., Fourakis, M., & Sereno, J. (1989). The acoustic vowel space of modern Greek and German. Language and Speech, 32 , 221–248. Kinnunen, T., & Li, H. (2010). recognition: 395
An overview of text-independent speaker
From features to supervectors.
Speech Communication,
52 , 12 – 40. URL: http://www.sciencedirect.com/science/article/ pii/S0167639309001289. doi:https://doi.org/10.1016/j.specom.2009. 08.009. Kontosopoulos, N. (1968). Kymografikai kai fasmatografikai erevnai epi ton hellinikon fthongon (waveform and spectographic studies of Greek sounds).
400
Athina, 70 . Kuhn, M. (2016). caret: Classification and Regression Training. URL: https: //CRAN.R-project.org/package=caret r package version 6.0-68. Kuhn, M., Weston, S., Coulter, N., & code for C5.0 by R. Quinlan, M. C. C. (2015). C50: C5.0 Decision Trees and Rule-Based Models. URL: https:
405
//CRAN.R-project.org/package=C50 r package version 0.1.0-24. Larcher, A., Lee, K. A., Ma, B., & Li, H. (2014). Text-dependent speaker verification: Classifiers, databases and {RSR2015}. Speech Communication, 60 , 56 – 77. URL: http://www.sciencedirect.com/science/article/ pii/S0167639314000156. doi:https://doi.org/10.1016/j.specom.2014.
410
03.001. Li, H., Ma, B., & Lee, K. A. (2013). Spoken language recognition: From fundamentals to practice. Proceedings of the IEEE , 101 , 1136–1159. Lisker, L. (1957). Closure duration and the intervocalic voiced-voiceless distinction in English. Language, 33 , 42–49.
415
Lisker, L. (1975). Is it VOT or a first-formant transition deterctor? Journal of the Acoustical Society of America, 57 , 1547–1551.
21
Loukina, A. (2009). Phonetic variation in spontaneous speech. vowel and consonant reduction in Modern Greek dialects. In Oxford University Working Papers in Phonetics 12 (pp. 36–56). University of Oxford volume 12. 420
Loukina, A. (2011). Phonetic variation in regional varieties of Modern Greek: vowel raising. In M. Janse, B. Joseph, P. Pavlou, A. Ralli, & S. Armosti (Eds.), Studies in Modern Modern Greek Dialects and Linguistic Theory (pp. 61–71). Research Centre of Kykkos Monastery. Mporas, I., Safavi, S., & Sotudeh, R. (2016). Improving robustness of speaker
425
verification by fusion of prompted text-dependent and text-independent operation modalities. In Speech and Computer (pp. 378–385). Heidelberg: Springer Verlag volume 9811 of Lecture Notes in Computer Science (including subseries Lecture Notes in Artificial Intelligence and Lecture Notes in Bioinformatics). doi:10.1007/978-3-319-43958-7_45.
430
Newton, B. E. (1972a). Cypriot Greek. Its phonology and inflections. The Hague, Paris: Mouton. Newton, B. E. (1972b). The generative interpretation of dialect. A study of Modern Greek phonology. Cambridge: University Press. Nicolaidis, K. (2003).
435
Acoustic variability of vowels in Greek spontaneous
speech. In Proceedings of the 15th International congress of Phonetic Sciences (pp. 3221–3224). Quinlan, R. (1993). C4.5: Programs for Machine Learning. San Francisco: Morgan Kaufmann Publishers, Inc. R Core Team (2016). R: A Language and Environment for Statistical Com-
440
puting. R Foundation for Statistical Computing Vienna, Austria. URL: https://www.R-project.org/. Reynolds, D. A., & Rose, R. C. (1995).
Robust text-independent speaker
identification using gaussian mixture speaker models.
IEEE Transac-
tions on Speech and Audio Processing, 3 , 72–83. URL: https://www. 22
445
scopus.com/inward/record.uri?eid=2-s2.0-0029209272&doi=10.1109% 2f89.365379&partnerID=40&md5=9305e3b83c6d4a39e8b7466a0fb44ca6. doi:10.1109/89.365379. Rosner, B. S., & Pickering, J. B. (1994). Vowel Perception and Production. Oxford University Press.
450
Sadjadi, S. O., Ganapathy, S., & Pelecanos, J. W. (2016). The IBM 2016 speaker recognition system. Odyssey 2016 , (pp. 174–180). Samaras, M. (1974). Study of the influence of the accent on Modern Greek vowel formant structure. Bulletin de l’Institut de Phonetique de Grenoble, 3 , 129–138.
455
Sfakianaki, A. (2002). Acoustic characteristics of greek vowels produced by adults and children. In M. Makri-Tsilipakou (Ed.), Selected Papers on Theoretical and Applied Linguistics from the 14th International Symposium, April 20-22, 2000 (pp. 1–16). Thessaloniki: Department of Theoretical and Applied Linguistics, School of English, Aristotle University of Thessaloniki.
460
Sizov, A., Lee, A. L., Kong, & Kinnunen, T. (2017). Direct optimization of the detection cost for i-vector-based spoken language recognition. IEEE/ACM Transactions on Audio, Speech, and Language Processing, 25 , 588–597. doi:10.1109/TASLP.2017.2651377. Stevens, K. N., & Klatt, D. (1974). Role of formant transitions in the voiced-
465
voiceless distinction for stops. Journal of the Acoustical Society of America, 55 , 653–659. Themistocleous, C. (2014). Edge-tone effects and prosodic domain effects on final lengthening. Linguistic Variation, 14 , 129160. Themistocleous, C. (2015). Seeking an anchorage. stability and variability in
470
tonal alignment of rising prenuclear pitch accents in Cypriot Greek. Language and Speech, (pp. 1–29). doi:doi:10.1177/0023830915614602.
23
Themistocleous, C. (2017). The nature of phonetic gradience across a dialect continuum: Evidence from Modern Greek vowels. Phonetica, 74 , 157 – 172. Themistocleous, C., Savva, A., & Aristodemou, A. (2016). Effects of stress on 475
fricatives: Evidence from Standard Modern Greek. In Interspeech 2016 (pp. 1–4). Thomas, E. (2013). Sociophonetics. In J. Chambers, & N. Schilling (Eds.), The Handbook of Language Variation and Change (pp. 108–127). Oxford: Blackwell Publishing. (2nd ed.).
480
Thomas, E. R. (2011). Sociophonetics : an introduction. New York: Palgrave Macmillan. Trevor, H., Robert, T., & Buja, A. (1994). Flexible discriminant analysis by optimal scoring. Journal of the American Statistical Association, 89 , 1255– 1270.
485
Tseva, A. (1989). Structure acoustique des voyelles du Grec Moderne: Ouen sont les connaissances?
Bulletin de l’Institut de Phonetique de Grenoble,
17-18 , 87–107. Van Der Harst, S., Van De Velde, H., & Van Hout, R. (2014). Variation in Standard Dutch vowels: The impact of formant measurement methods on 490
identifying the speaker’s regional origin. Language Variation and Change, 26 , 247–272. Vieru, B., de Mare¨ uil, P. B., & Martine, A.-D. (2011). Characterisation and identification of non-native French accents. Speech Communication, 53 , 292– 310.
495
Woehrling, C., de Mare¨ uil, P. B., & Adda-Decker, M. (2009). Linguisticallymotivated automatic classification of regional French varieties. Interspeech 2009 , (pp. 2183–2186).
24
Zhang, S.-X. (2014). Structured Support Vector Machines for Speech Recognition. Thesis Cambridge University Press.
25
Figure 2: CG stressed vowel formants modelled using polynomial fitting. The horizontal lines from bottom to top represented the F1, F2, F3, and F4 formant frequencies of Greek vowels [i e a o u].
26
Figure 3: CG unstressed vowel formants modelled using polynomial fitting. The horizontal lines from bottom to top represented the F1, F2, F3, and F4 formant frequencies of Greek vowels [i e a o u].
27
Figure 4: CG stressed vowel formants modelled using polynomial fitting. The horizontal lines from bottom to top represented the F1, F2, F3, and F4 formant frequencies of Greek vowels [i e a o u].
28
Figure 5: CG unstressed vowel formants modelled using polynomial fitting. The horizontal lines from bottom to top represented the F1, F2, F3, and F4 formant frequencies of Greek vowels [i e a o u].
29