BMC Proceedings
BioMed Central
Open Access
Proceedings
Different normalization strategies for microarray gene expression traits affect the heritability estimation Jun Ma1 and Zhaohui S Qin*2 Address: 1Department of Molecular Cellular and Developmental Biology, University of Michigan, 210 Washtenaw Avenue, LSI 6026, Ann Arbor, Michigan 48109-2216, USA and 2Center for Statistical Genetics, Department of Biostatistics, University of Michigan, M4232 SPHII, 1420 Washington Heights, Ann Arbor, Michigan 48109-2029, USA Email: Jun Ma -
[email protected]; Zhaohui S Qin* -
[email protected] * Corresponding author
from Genetic Analysis Workshop 15 St. Pete Beach, Florida, USA. 11–15 November 2006 Published: 18 December 2007 BMC Proceedings 2007, 1(Suppl 1):S154 Marsha A Wilcox, John
Genetic S Witte, Qiong Analysis Yang, Workshop Andreas Ziegler, 15: Gene Laura Expression Almasy Analysis and Jean and W MacCluer Approaches to Detecting Proceedings Multiple Functional Loci
http://www.biomedcentral.com/content/pdf/1753-6561-1-S1-info.pdf Heather J Cordell, Mariza de Andrade, Marie-Claude Babron, Christopher W Bartlett, Joseph Beyene, Heike Bickeböller, Robert Culverhouse, Adrienne Cupples, E Warwick Daw, Josée Dupuis, Catherine T Falk, Saurabh Ghosh, Katrina A Goddard, Ellen L Goode, Elizabeth R Hauser, Lisa J Martin, Maria Martinez, Kari E North, Nancy L Saccone, Silke Schmidt, William Tapper, Duncan Thomas, David Tritchler, Veronica J Vieland, Ellen M Wijsman,
This article is available from: http://www.biomedcentral.com/1753-6561/1/S1/S154 © 2007 Ma and Qin; licensee BioMed Central Ltd. This is an open access article distributed under the terms of the Creative Commons Attribution License (http://creativecommons.org/licenses/by/2.0), which permits unrestricted use, distribution, and reproduction in any medium, provided the original work is properly cited.
Abstract Several studies have been conducted to assess the influence of genetic variation on genome-wide gene expression profiles measured by the microarray technologies. Due to substantial noise in microarray-based experiments, it has long been recognized that proper normalization is a crucial step to ensure sensitive and reliable downstream analyses. This is especially true when large number of samples were collected and analyzed. In this study, we investigated the impact of different normalization strategies on genome wide linkage analyses, in particular, the estimation of heritability of gene expression traits. We used the Genetics Analysis Workshop 15 Problem 1 data. We found that there are significant differences in the estimated number of genes showing heritability when different normalization strategies were used. RMA (robust multiarray average) and dChip identify 45% and 13% more genes showing heritability than MAS 5.0, respectively. Our study also reveals that a large number of genes show strong "family effect" in their expression levels but no significant heritability. Analysis of their annotation indicates different types of genes were enriched in this group compared to genes showing strong heritability.
Background DNA microarray technologies provide a method to measure gene expression levels on a genomic scale. Recently, this technique has been applied in genetics studies to investigate the effects of genetic variants on gene expression levels [1-5]. This approach is referred to as geneticalgenomics approach [6] in which gene expression levels were treated as quantitative traits. As expected, the accuracy and reliability of the expression measurements are essential and have significant impact on identifying loci
that affect these quantitative traits. However, it has long been recognized that there is substantial intrinsic noise contained in microarray data. Removing systematic noise from raw microarray data is crucial for the downstream analyses. For Affymetrix GeneChip technology, which generated our data, there are two issues that need to be addressed. First, since a gene is represented by one or more probe sets, each contains series of perfect and mismatch probe pairs; a crucial step is to combine the intensity measures from multiple probes to produce a single Page 1 of 5 (page number not for citation purposes)
BMC Proceedings 2007, 1(Suppl 1):S154
value that best captures the expression level of the particular RNA transcript. Second, significant differences between chips have been observed due to various experimental artifacts; therefore it is important that a cross-chip normalization step is applied such that noise due to chipspecific experimental conditions can be removed to allow comparison across multiple chips. An array of summarization and normalization strategies have been proposed to address these issues and are implemented in software such as MAS 5.0 [7], dChip [8], RMA (robust multiarray average) [9], among others. These methods are based on different statistical models, different summarization strategies, and different cross-chip normalization methods. As a consequence, the normalized gene expression profiles produced by these methods are quite different. Results obtained from high level analyses such as detection of differentially expressed genes, clustering, and classification are often dependent on the summarization and normalization strategies used during the pre-processing step. Several studies have been conducted to compare the effects of various normalization strategies on high-level analyses [10-12]. More recently, the impact of various normalization strategies on genetical-genomics experiments conducted on recombinant inbred mouse strains have been evaluated and debated [13-15]. In this study, we used a novel design to study the consequences of different normalization strategies on gene expression trait heritability estimates. Our objectives are two-fold: first, heritability is an important measure in linkage studies as it is often used as a screening tool to select traits of interest. Whether the normalization step significantly influences the heritability measure is of great interest. Second, as pointed out by Chesler et al. [13], in microarray experiments, it is very difficult to determine "which method best approximates 'truth' in a situation in which truth is typically unknown", for example, determining differentially expressed genes. However, random noise alone is unlikely to produce gene expression pattern that show heritability in multiple multi-generation families, thus heritability measure in a large linkage study present a desirable setting to compare the sensitivity and specificity of various normalization methods. We hypothesize that noise associated with microarray experiments tends to eliminate or weaken the expression profile pattern of heritable gene such that heritability will be difficult to detect without proper normalization. Here we use the Genetics Analysis Workshop 15 Problem 1 to test our hypothesis. We choose MAS 5.0, RMA and dChip because they are commonly used in analyzing Affymetrix GeneChip data. Other normalization strategies
http://www.biomedcentral.com/1753-6561/1/S1/S154
can be compared similarly. We used Bioconductor package [16] built on top of the R programming language to perform the analyses in this study.
Methods Normalization strategy Three normalization strategies were used in this study. MAS 5.0 is the updated version of the Affymetrix analysis algorithm. This method uses both the signals from perfect match and mismatch probes. The signal from a mismatch is calculated in such a way that it is never greater than the signal from a perfect match. dChip introduced a statistical model at the probe level to compute the so-called expression index. In such a model, both perfect match and mismatch probes are utilized. Using specific parameters to account for probe- and chip-specific effects, this model summarizies probe-level data and cross-chip normalization simultaneously. RMA introduces a new expression measure that is primarily based on perfect match probes. Mismatch probes were used to calculate background signal to non-specific binding. Specific distribution assumptions are made to make sure the transformed measurements are positive. A quantile normalization technique [10] is used to normalize expression levels from multiple chips. Data Expression levels of genes in lymphoblastoid cells from 14 three-generation Centre d'Etude du Polymorphisme Humain Utah families (4 grandparents, 2 parents, 8 offsprings per sibship, for a total of approximately 14 individuals per family) were obtained using the Affymatrix Human Focus Arrays, which contain probes for 8792 transcripts. About 100 individuals' array hybridizations were performed in duplicate. In this study, only the first array of the duplicated individual was used. So gene expression data from 194 different individuals were analyzed.
After probe-level data were converted to expression levels and data log-transformed, a filtering step was applied to select differentially expressed genes for further analysis. This is necessary because genes that do not show much variation among individuals are non-informative in heritability estimation. We used two selection criteria for each gene, 1) the absolute difference (maximum-minimum) has to be greater than 1 and 2) the relative difference (maximum/minimum) has to be greater than 1.5. This variance filter is different from that used in Morley et al. [1] but it has been frequently used in microarray studies such as that of Tamayo et al. [17].
Results Heritability Following the filtering step, approximately 1750 genes were selected and subsequently processed by each of the
Page 2 of 5 (page number not for citation purposes)
BMC Proceedings 2007, 1(Suppl 1):S154
http://www.biomedcentral.com/1753-6561/1/S1/S154
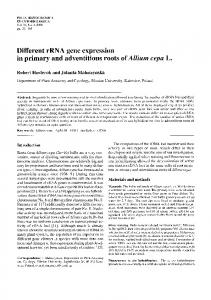
Table 1 demonstrates the numbers of genes that pass the variance filter are roughly the same in each of the three categories; however the numbers of heritable genes identified by the three normalizing strategies differ. Using a FDR of 0.05, dChip and RMA identified 13.6% and 43.1% more heritable genes than MAS 5.0, respectively. When the FDR threshold is lowered to 0.01, the differences changed to 12.3% and 45.6%, respectively. Using RMA, 57.5% of genes that passed the variance filter display significant heritability pattern; their heritability estimates range from 0.11 to 0.97 with median of 0.26. To examine the overlaps of heritable genes detected under three different normalization strategies, we plotted the correspondence at the top (Figure 1) [21]. This plot indicates that the agreement between the three lists of heritable genes is low, ranging from 26% to 48%. We also measured the type I error rates of heritability estimates resulting from the three normalization strategies. From the 100 permutation tests performed, using nominal p-value of 0.05 as the cut-off, we found that the average proportions of genes incorrectly detected as heritable are 2.2%, 2.5%, and 1.4% for MAS 5.0, dChip, and RMA, respectively (Table 1). This indicates that these normalization strategies are conservative and RMA in fact displays the lowest type I error rate. Family-specific traits We also found that a large number of genes display strong family specific effects; that is, a majority of the overall variance in the expression levels comes from across families. We first used RMA to normalize expression levels and then used one-way ANOVA to identify genes showing family-specific expression patterns. Although the majority of these genes show heritability in their gene expression trait, about 40% fail to show significant heritability using Table 1: Number of heritable genes identified after using there different normalization methods
No. selected genes for analysis No. heritable genes with FDR ≤ 0.05 No. heritable genes with FDR ≤ 0.01 Average no. false positives after permutation with p-value ≤ 0.05 (standard deviation)
RMA
dChip
MAS 5.0
1737 994 757 24.4 (4.5)
1764 791 584 43.8 (5.4)
1785 696 520 39.1 (6.5)
Correspondence at the top 0.6
linkage concordance
three normalizing strategies. Heritability of these genes was then calculated by POLY software [18]. To correct for multiple testing, we computed the false-discovery rate (FDR) [19] using the q-value software [20]. The numbers of heritable genes after the three normalization strategies using two different FDR thresholds are summarized in Table 1.
0.5 0.4
RMA vs Dchip RMA vs MAS Dchip vs MAS
0.3 0.2 0.1 0 20
60
100 200 300 400 size of the list
Figure Correspondence identified MAS 5.0,1 dChip, after using and analysis three RMAofdifferent three lists normalization of heritablestrategies: genes Correspondence analysis of three lists of heritable genes identified after using three different normalization strategies: MAS 5.0, dChip, and RMA.
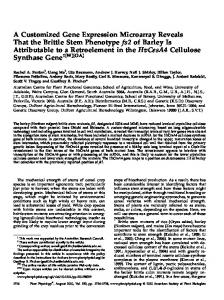
nominal p-value of 0.05 as the cut-off. We speculate that the expression levels of these genes may be affected by non-genetics factors such as environment or population substructures. Venn diagrams on genes showing heritability and family-specific effects can be found in Figure 2. Comparison of annotations To determine which functional categories are enriched among genes that show patterns of heritability and/or family-specific effects, we analyzed three lists of genes using GOstat [22], a software tool that calculates the statistical significance of the gene ontology (GO) term enrichment. The three lists are genes that show heritability and family-specific effects, genes that show heritability but no family specificity, and genes that show family-specific effects but no heritability. In this analysis, we only used expression levels obtained using RMA. Table 2 summarize the results. From this table, we found that the most notable functional category for genes that display both heritability and family-specific effect is apoptosis, a major type of program cell death. Apoptosis plays an important role in development, immune cell regulation, and
Family effect genes
Heritable genes 400
599
447
Figure Venn specific diagram effect 2 of genes that show heritability and/or family Venn diagram of genes that show heritability and/or family specific effect.
Page 3 of 5 (page number not for citation purposes)
BMC Proceedings 2007, 1(Suppl 1):S154
http://www.biomedcentral.com/1753-6561/1/S1/S154
Table 2: Annotation comparison of genes that show heritability and/or family specific effect
Heritable and family effect
p-Value
Family effect non-heritable
p-Value
Heritable non-family effect
Protein binding Intracellular part Apoptosis
3.71 × 10⁻¹³ 4.83 × 10⁻¹¹ 4.83 × 10⁻¹¹
2.99 × 10⁻²⁴ 8.73 × 10⁻²² 5.14 × 10⁻¹⁸
Programmed cell death Plasma membrane Cell death Organ development
4.83 × 10⁻¹¹ 1.66 × 10⁻¹⁰ 1.76 × 10⁻¹⁰ 1.76 × 10⁻¹⁰
Intracellular part Cytoplasm Intracellular membrane bound organelle Intracellular organelle Protein binding Mitochondria Cytosol
3.32 × 10⁻¹⁷ 2.37 × 10⁻¹⁶ 7.5 × 10⁻¹⁶ 4.11 × 10⁻¹⁵
Cell proliferation Intracellular membranebound organelle Cell part
1.76 × 10⁻¹⁰ 6.54 × 10⁻¹⁰
Cell cycle Organelle lumen
3.53 × 10⁻¹³ 2.04 × 10⁻¹¹
Protein binding 7.12 × 10⁻¹⁹ Integral to plasma membrane 5.58 × 10⁻⁹ Intrinsic to plasma 5.68 × 10⁻⁹ membrane Receptor binding 6.99 × 10⁻⁸ Plasma membrane 6.99 × 10⁻⁸ Intracellular part 1.08 × 10⁻⁷ Regulation of cell 7.81 × 10⁻⁷ proliferation Intracellular organelle 2.12 × 10⁻⁶ Cell communication 3.34 × 10⁻⁶
6.54 × 10⁻¹⁰
Nucleus
6.51 × 10⁻¹¹
Morphogenesis
response to cell damage. Another notable feature is that significant functional categories in these three groups differ, which indicates significant difference among these three groups of genes.
p-Value
4.51 × 10⁻⁶
Competing interests The author(s) declare that they have no competing interests.
Acknowledgements Discussion and conclusion This study assesses the impact of different normalization strategies on heritability estimation in genetical-genomics studies. Using Genetics Analysis Workshop 15 Problem 1 and three different methods (RMA, dChip, and MAS 5.0) we found that normalization strategies used to summarize data across multiple chips significantly influences the identification of heritable genes. The percentage of overlap between heritable genes identified using different methods is low. Among the three methods tested, RMA reveals the greatest number of heritable genes, followed by dChip and MAS 5.0. Interestingly, RMA also yields the least number of false positives in the permutation test. It is known that RMA performs well in cross-chip normalization, which may explain its highest sensitivity and specificity among the three methods tested. However, more studies are needed before a general conclusion can be drawn. The permutation test also suggests that all three methods produce conservative results in terms of heritability estimates. We also found a large number of genes with expression patterns that show significant family-specific effect, but no significant heritability. Annotation analysis indicates that different functional categories are enriched among these genes relative to heritable genes, indicating that perhaps these genes are involved in different functional mechanisms. Recent genome-wide linkage scans of the same data set have indicated that normalization methods play an important role in the linkage results. These and our studies suggest that close attention needs to be paid to the preprocessing steps because they significantly impact the downstream analyses.
We thank Drs. Gonçalo Abecasis, Weimin Chen, and Jun Ding for helpful discussion and comments. This article has been published as part of BMC Proceedings Volume 1 Supplement 1, 2007: Genetic Analysis Workshop 15: Gene Expression Analysis and Approaches to Detecting Multiple Functional Loci. The full contents of the supplement are available online at http://www.biomedcentral.com/ 1753-6561/1?issue=S1.
References 1. 2.
3.
4.
5.
6. 7. 8. 9.
10.
Morley M, Molony CM, Weber TM, Devlin JL, Ewens KG, Spielman RS, Cheung VG: Genetic analysis of genome-wide variation in human gene expression. Nature 2004, 430:743-747. Monks SA, Leonardson A, Zhu H, Cundiff P, Pietrusiak P, Edwards S, Phillips JW, Sachs A, Schadt EE: Genetic inheritance of gene expression in human cell lines. Am J Hum Genet 2004, 75:1094-1105. Cheung VG, Spielman RS, Ewens KG, Weber TM, Morley M, Burdick JT: Mapping determinants of human gene expression by regional and genome-wide association. Nature 2005, 437:1365-1369. Deutsch S, Lyle R, Dermitzakis ET, Attar H, Subrahmanyan L, Gehrig C, Parand L, Gagnebin M, Rougemont J, Jongeneel CV, Antonarakis SE: Gene expression variation and expression quantitative trait mapping of human chromosome 21 genes. Hum Mol Genet 2005, 14:3741-3749. Stranger BE, Forrest MS, Clark AG, Minichiello MJ, Deutsch S, Lyle R, Hunt S, Kahl B, Antonarakis SE, Tavaré S, Deloukas P, Dermitzakis ET: Genome-wide associations of gene expression variation in humans. PLoS Genet 2005, 1:e78. Li J, Burmeister M: Genetical genomics: combining genetics with gene expression analysis. Hum Mol Genet 2005, 14:R163-R169. Hubbell E, Liu WM, Mei R: Robust estimators for expression analysis. Bioinformatics 2002, 18:1585-1592. Li C, Wong WH: Model-based analysis of oligonucleotide arrays: expression index computation and outlier detection. Proc Natl Acad Sci USA 2001, 98:31-36. Irizarry RA, Hobbs B, Collin F, Beazer-Barclay YD, Antonellis KJ, Scherf U, Speed TP: Exploration, normalization, and summaries of high density oligonucleotide array probe level data. Biostatistics 2003, 4:249-264. Bolstad BM, Irizarry RA, Astrand M, Speed TP: A comparison of normalization methods for high density oligonucleotide
Page 4 of 5 (page number not for citation purposes)
BMC Proceedings 2007, 1(Suppl 1):S154
11.
12.
13.
14. 15.
16. 17.
18. 19. 20. 21.
22.
http://www.biomedcentral.com/1753-6561/1/S1/S154
array data based on variance and bias. Bioinformatics 2003, 19:185-193. Shedden K, Chen W, Kuick R, Ghosh D, Macdonald J, Cho KR, Giordano TJ, Gruber SB, Fearon ER, Taylor JM, Hanash S: Comparison of seven methods for producing Affymetrix expression scores based on false discovery rates in disease profiling data. BMC Bioinformatics 2005, 6:26. Hoffman R, Seidl T, Dugas M: Profound effect of normalization on detection of differentially expressed genes in oligonucleotide microarray data analysis. Genome Biol 2002, 3:RESEARCH0033. Chesler EJ, Bystrykh L, de Haan G, Cooke MP, Su A, Manly KF, Williams RW: Reply to "Normalization procedures and detection of linkage signal in genetical-genomics experiments". Nat Genet 2006, 38:856-858. Williams RB, Cotsapas CJ, Cowley MJ, Chan E, Nott DJ, Little PF: Normalization procedures and detection of linkage signal in genetical genomics experiments. Nat Genet 2006, 38:855-856. Petretto E, Mangion J, Cook SA, Aitman TJ, Pravenec M, Schulz H, Fischer J, Hubner N: Reply to "Normalization procedures and detection of linkage signal in genetical-genomics experiments". Nat Genet 2006, 38:858-859. Gentleman R, Carey VJ, Huber Wm, Irizarry RA, Dudoit S: Bioinformatics and Computational Biology Solutions Using R and Bioconductor New York: Springer; 2005. Tamayo P, Slonim D, Mesirov J, Zhu Q, Kitareewan S, Dmitrovsky E, Lander ES, Golub TR: Interpreting patterns of gene expression with self-organizing maps: methods and application to hematopoietic differentiation. Proc Natl Acad Sci USA 1999, 96:2907-2912. Chen WM, Abecasis GR: Estimating the power of variance component linkage analysis in large pedigrees. Genet Epidemiol 2006, 30:471-484. Benjamini Y, Hochberg Y: Controlling the false discovery rate: a practical and powerful approach to multiple testing. J Roy Stat Soc Ser B 1995, 57:289-300. Storey JD, Tibshirani R: Statistical significance for genomewide studies. Proc Natl Acad Sci USA 2003, 100:9440-9445. Irizarry RA, Warren D, Spencer F, Kim IF, Biswal S, Frank BC, Gabrielson E, Garcia JG, Geoghegan J, Germino G, Griffin C, Hilmer SC, Hoffman E, Jedlicka AE, Kawasaki E, Martínez-Murillo F, Morsberger L, Lee H, Petersen D, Quackenbush J, Scott A, Wilson M, Yang Y, Ye SQ, Yu W: Multiple-laboratory comparison of microarray platforms. Nat Methods 2005, 2:345-350. Beissbarth T, Speed TP: GOstat: find statistically overrepresented gene ontologies within a group of genes. Bioinformatics 2004, 20:1464-1465.
Publish with Bio Med Central and every scientist can read your work free of charge "BioMed Central will be the most significant development for disseminating the results of biomedical researc h in our lifetime." Sir Paul Nurse, Cancer Research UK
Your research papers will be: available free of charge to the entire biomedical community peer reviewed and published immediately upon acceptance cited in PubMed and archived on PubMed Central yours — you keep the copyright
BioMedcentral
Submit your manuscript here: http://www.biomedcentral.com/info/publishing_adv.asp
Page 5 of 5 (page number not for citation purposes)