3076 • The Journal of Neuroscience, March 19, 2008 • 28(12):3076 –3089
Behavioral/Systems/Cognitive
Differential Columnar Processing in Local Circuits of Barrel and Insular Cortices Hajime Sato,* Yasushi Shimanuki,* Mitsuru Saito,* Hiroki Toyoda,* Takashi Nokubi, Yoshinobu Maeda, Takashi Yamamoto, and Youngnam Kang Department of Neuroscience and Oral Physiology, Osaka University Graduate School of Dentistry, Suita, Osaka 565-0871, Japan
The columnar organization is most apparent in the whisker barrel cortex but seems less apparent in the gustatory insular cortex. We addressed here whether there are any differences between the two cortices in columnar information processing by comparing the spatiotemporal patterns of excitation spread in the two cortices using voltage-sensitive dye imaging. In contrast to the well known excitation spread in the horizontal direction in layer II/III induced in the barrel cortex by layer IV stimulation, the excitation caused in the insular cortex by stimulation of layer IV spread bidirectionally in the vertical direction into layers II/III and V/VI, displaying a columnar image pattern. Bicuculline or picrotoxin markedly extended the horizontal excitation spread in layer II/III in the barrel cortex, leading to a generation of excitation in the underlying layer V/VI, whereas those markedly increased the amplitude of optical responses throughout the whole column in the insular cortex, subsequently widening the columnar image pattern. Such synchronous activities as revealed by the horizontal and vertical excitation spreads were consistently induced in the barrel and insular cortices, respectively, even by stimulation of different layers with varying intensities. Thus, a unique functional column existed in the insular cortex, in which intracolumnar communication between the superficial and deep layers was prominent, and GABAA action is involved in the inhibition of the intracolumnar communication in contrast to its involvement in intercolumnar lateral inhibition in the barrel cortex. These results suggest that the columnar information processing may not be universal across the different cortical areas. Key words: barrel cortex; insular cortex; lateral inhibition; functional column; GABAA receptor; voltage-sensitive dye
Introduction In the rodent barrel cortex, a distinct topographical representation of the whisker is well known (Woolsey and Van der Loos, 1970; Moore et al., 1999), and the presence of columnar organization is most apparent in this area as revealed by the barrel structure of layer IV (Feldmeyer et al., 1999, 2005; Laaris et al., 2000; Lubke et al., 2000; Petersen and Sakmann, 2000, 2001; Bender et al., 2003). In contrast, in the primary gustatory area of the insular cortex, the topographical representation of the four basic tastes (sweet, sour, salty, and bitter) appears to be much less distinct (Yamamoto et al., 1980, 1984, 1985; Kosar et al., 1986; Ogawa et al., 1991, 1992). Indeed, there were considerable overlaps among the representation areas of the four basic tastes in rats (Accolla et al., 2007). The taste neurons are intermingled with sensory neurons for various other modalities such as tactile, thermal, and nociceptive sensations (Cechetto and Saper, 1987; Yamamoto et al., 1988; Allen et al., 1991; Hanamori et al., 1998). Furthermore, the gustatory insular cortex is mainly composed of Received July 12, 2007; revised Feb. 4, 2008; accepted Feb. 4, 2008. This work was partly supported by Grant-in-Aid for Scientific Research on Priority Areas (A) 17021027 from Japan Ministry of Education, Culture, Sports, Science, and Technology (Y.K.). We thank Hendrik W. Steenland for editing this manuscript. *H.S., Y.S., M.S., and H.T. contributed equally to this work. Correspondence should be addressed to Dr. Youngnam Kang, Department of Neuroscience and Oral Physiology, Osaka University Graduate School of Dentistry, 1-8, Yamadaoka, Suita, Osaka 565-0871, Japan. E-mail:
[email protected]. DOI:10.1523/JNEUROSCI.0172-08.2008 Copyright © 2008 Society for Neuroscience 0270-6474/08/283076-14$15.00/0
dysgranular and agranular cortices, thereby displaying either a thin layer IV or no layer IV (Yamamoto et al., 1984). Thus, information processing in the insular cortex would be predicted to differ from other sensory cortical areas. However, several studies suggested that the gustatory insular cortex processes information through functional column. For example, when simultaneous recordings were obtained from two neurons closely located in the insular cortex, they displayed synchronous activities in response to a taste stimulation (Nakamura and Ogawa, 1997; Yokota and Satoh, 2001). Furthermore, tasteresponsive mechanoreceptive neurons with the same receptive field are topographically arranged in the insular cortex (Wang and Ogawa, 2002). However, it is not yet firmly established whether the distinct functional column exists in the insular cortex, and it is also not clear whether columnar information processing is universal or distinctive between the insular and other sensory cortices. Higher brain functions such as learning and cognition are thought to be mediated by synchronization of firing activities of pyramidal neurons located within a single column or in different columns of the cerebral cortex (Gray et al., 1989; Roy and Alloway, 1999). Synchronous activities among pyramidal neurons in the neighboring columns may be regulated by GABAergic lateral inhibition (Chagnac-Amitai and Connors, 1989). If the lateral inhibition in the barrel and insular cortices were different, such discrepancies would be helpful for a better understanding of the functional role of the lateral inhibition in the synchronization.
Sato et al. • Excitation Spreads in Barrel and Insular Columns
J. Neurosci., March 19, 2008 • 28(12):3076 –3089 • 3077
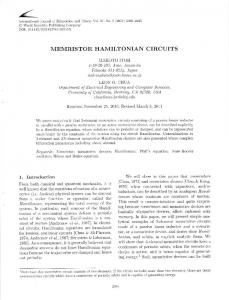
Materials and Methods All experiments were performed in accordance with the guidelines of Osaka University Graduate School of Dentistry for the care and use of laboratory animals. Slice preparation. We prepared slices using standard methods (Kang et al., 2004; Saito et al., 2006; Kang et al., 2007). Wistar rats of both sexes at 18 –22 and 15–22 d of age (Charles River Breeders, Osaka, Japan) were used for the experiments on the barrel and insular cortices, respectively. They were anesthetized with diethylether, and the brain was quickly removed from the skull and immersed in ice-cold modified artificial CSF (M-ACSF) (in mM: 230 sucrose, 2.5 KCl, 10 MgSO4, 1.25 NaH2PO4, 26 NaHCO3, 2.5 CaCl2, and 10 D-glucose). The caudal end of the brain block was cut at 15° tilted caudally from the coronal plane. With a microslicer (Super ZERO-1; Dosaka EM, Kyoto, Japan), sections of 350 m thickness including both the whisker barrel and gustatory insular cortices were cut parallel to the plane, referring to the anatomical landmarks of the rhinal fissure and the middle cerebral artery (Yamamoto et al., 1985; Kosar et al., 1986; Cechetto and Saper, 1987; Accolla et al., 2007) (Fig. 1A). By intracellular injection of Lucifer yellow (Fig. 1Ba) with biocytin (Fig. 1Bb) and by extracellular application of DiI (Fig. 1C,D), we confirmed that apical dendrites of pyramidal neurons in deep layers are well preserved in these slice preparations. Slices were incubated at 32°C for 30 min in 50% M-ACSF and 50% normal ACSF (N-ACSF) (in mM: 126 NaCl, 3 KCl, 1 MgSO4, 1.25 NaH2PO4, 26 NaHCO3, 2 CaCl2, and 10 D-glucose). The slices were then placed in N-ACSF at room temperature (20 –24°C). N-ACSF was continuously gassed with a mixture of 95% O2–5% CO2. Optical recording using a voltage-sensitive dye. The slices were stained for 60 min with a styryl pyridinium dye RH414 (Invitrogen, Tokyo, Japan) that was dissolved in dimethylsulfoxide and added to the gassed N-ACSF at a dilution of 1:1000 to yield a final concentration of 200 M. The stained slices were placed in the recording chamber perfused continuously with N-ACSF at a flow rate of 1.5 ml/min at the room temperature during Figure 1. Locations of the barrel and insular cortices. Aa, A side view of the whole rat brain showing locations of the barrel and imaging experiments. The slices were illuminated insular cortices (stippled areas). The location of the insular cortex determined, referring to the anatomical landmarks of the with light of 535 ⫾ 15 nm wavelength using a stamiddle cerebral artery (MCA) and the rhinal fissure (RF). Scale bar, 5 mm. Ab, A section cut at 15° tilted caudally from the coronal bilized 150 W xenon lamp (Opti-Quip, Highland plane, showing the locations of the barrel and insular cortices, the respective small parts of which were visualized with IR-DIC Mills, NY). The fluorescence emitted from optics. Scale bar, 2 mm. D, Dorsal; L, lateral. Ac, Barrels visible in layer IV of the barrel cortex. Scale bar, 200 m. Ad, A thin strip voltage-sensitive dye was long-pass filtered above of the granular layer (interrupted line) visible between layers III and V in the dysgranular insular cortex. The arrowhead indicates 580 nm and measured with a CCD camera (Neuthe RF. Scale bar, 500 m. Ba, A fluorescence image of an insular layer V pyramidal neuron that was labeled by injection of Lucifer roCCD-SM; RedShirtImaging, Fairfield, CT), yellow and biocytin through the patch pipette. Scale bar, 20 m. Bb, A bright-field image of dendritic arborizations of the insular which was attached to an upright microscope (BXpyramidal neuron (Ba) that was visualized with DAB reaction. The arrowhead indicates the RF. The interrupted line represents the 51WI; Olympus, Tokyo, Japan) equipped with a border between the pia mater and the layer I. The apical dendrites of the layer V pyramidal neuron reached the cortical surface. water immersion objective (10⫻, 0.3 numerical Scale bar, 50 m. C, D, Bright-field (a) and fluorescence (b) images of the identical area of the barrel (C) and insular (D) cortices. aperture; Olympus). The imaged area was 1.6 ⫻ A small amount of DiI (dissolved in DMSO) injected into the two neighboring barrels (Ca,b) and into the layer V of the insular 1.6 mm 2, and each pixel (element) of the 80 ⫻ 80 cortex (Da,b) through the glass pipette. DiI fluorescence observed 10 h after the injection (Cb,c, Db,c). Areas enclosed with array detected the optical signals generated by a rectangles (Ca,b, Da,b) are enlarged in Cc and Dc. Apical dendrites are visible very close to the cortical surface. Continuous and square region (20 ⫻ 20 m 2) on the slice. Two interrupted lines represent the cortical surface and the border between layers I and II, respectively. Scale bars, Ca,b, Da,b, 500 m; Cc, Dc, 100 m. Fluorescence images shown in Cc and Dc were reconstructed by using a laser-scanning confocal microscopy. hundred and fifty-six consecutive frames of the fluorescence images were captured at a sampling rate of 1 kHz, and stimulation was applied when capturing the 25th frame. Eight series of the entire Here, we addressed these questions by quantitatively analyzing 256 optical images obtained at an interval of 15 s were averaged to improve the spatiotemporal dynamics of the excitation spread in the barthe signal-to-noise ratio. No change in fluorescence intensity was observed rel and insular cortices, in the absence and presence of bicuculline in the absence of RH414. or picrotoxin, using voltage-sensitive dye imaging.
3078 • J. Neurosci., March 19, 2008 • 28(12):3076 –3089
Microstimulation of 100 s duration was delivered via a sharp monopolar tungsten electrode (DC resistance, 1 M⍀) placed at the center of a barrel in the barrel cortex (Fig. 1 Ac) or at “layer IV,” which is a site 300 – 400 m lateral to the tail end of granular layer IV in the transition zone between the dysgranular and agranular insular cortices (Fig. 1 Ad). This tail of granular layer IV was clearly visible with infrared– differential interference contrast (IR-DIC) optics. Microstimulation was also applied to layer III or layer V. Stimulus intensities were changed between 4 and 8 V, which were 1.2- to 1.8-fold greater than the threshold intensity. The stimulation with the intensity ⬎8 V was never used because the slice tissue was often lesioned by such stimuli. An antagonist of GABAA receptor, bicuculline, and a blocker of GABA-gated Cl ⫺ channels, picrotoxin (Sigma-Aldrich, St. Louis, MO), were bath applied at concentrations of 10 and 100 M, respectively. Data analysis. The optical data were analyzed by using NeuroPlex (RedShirtImaging) and were displayed as pseudocolor images. Voltagesensitive dye signals were calculated as ⌬F/F0, where ⌬F is the difference (F0 ⫺ F ) between the resting light intensity (F0) and the respective fluorescence responses ( F) obtained before and after stimulation. For pseudocolor coding (purple to red), the optical signals obtained from the average of 3 ⫻ 3 pixels ranging between the minimal (⫺4.5 ⫻ 10 ⫺3) and maximal values (⫹7.0 ⫻ 10 ⫺3) of ⌬F/F0 were scaled between 0 and 127. Optical signals smaller than the minimal and larger than the maximal were treated as 0 and 127, respectively. Amplitudes of the optical responses were normalized to the maximum amplitude of the response obtained at the crossing point (the average of 3 ⫻ 3 pixels) of the vertical and horizontal axes, and were plotted as a normalized optical response (NOR). The vertical axis was drawn from the stimulated site (location of the initial response) perpendicularly to the cortical surface, and the orthogonal horizontal axis was drawn through the midpoint of the excited band of layer II/III in the barrel cortex. In the insular cortex, the orthogonal horizontal axis was drawn through the midpoint of cytoarchitectural layer II/III itself, because there was no discrete horizontal spread of excitation confined within layer II/III (see Fig. 2C). To show the temporal profiles of optical responses in layers II/III and V, two regions of interest (ROI-1 and ROI-2) were placed at the crossing point and the site 240 m below the lower margin of the barrel or the tip of layer IV in the insular cortex on the vertical axis. Numerical data are expressed as the mean ⫾ SD. Statistical significance was assessed using ANOVA with post hoc PLSD test. Curves representing temporal and spatial profiles were smoothed by using Savitzky– Golay (S–G) averaging method, unless otherwise mentioned.
Results Spatiotemporal patterns of the excitation spread induced by layer IV stimulation in the barrel cortex We analyzed the spatiotemporal patterns of excitation spread with reference to the septum of respective barrels, which is visible as a column boundary at a low magnification (10⫻) in slice preparations of the barrel cortex (Fig. 2 Aa). After microstimulation of the center of a barrel in a column (Fig. 2 Aa), the initial optical response was evoked in a limited area within a single barrel at a latency of 1 ms (stage 1) (Fig. 2 Ab). This was likely caused by direct activation of layer IV neurons in response to the microstimulation (Gustafsson and Jankowska, 1976). Subsequently, the excitation spread toward layer II/III (stage 2) (Fig. 2 Ac), and then began leaving layer IV to propagate into layer II/III where the strength of excitation increased (stage 3) (Fig. 2 Ad). Thereafter, the excitation propagated completely into layer II/III, and simultaneously spread in the horizontal direction into the neighboring columns partly, in layer II/III (stage 4) (Fig. 2 Ae). During stage 4, the strength of excitation in layer II/III of the stimulated (home) column reached a maximum level. However, the excitation in layer V/VI of the home column was not apparent throughout stages 1– 4 (Fig. 2 Ab– e), consistent with a previous report (Petersen and Sakmann, 2001). Here, we analyzed the vertical and horizontal profiles of the
Sato et al. • Excitation Spreads in Barrel and Insular Columns
spatiotemporal pattern of the excitation spread by plotting the amplitude of optical responses normalized to its maximum value (i.e., NOR) against the position on the vertical (Fig. 2 Aa, interrupted line labeled with V) and horizontal (Fig. 2 Aa, interrupted line labeled with H) axes. The vertical and horizontal spatial profiles of the excitation spread were documented at the four stages described above (Fig. 2 Ba,b), because the time course of excitation spread varied from slice to slice. The mean lag times of stages 1– 4 examined in five slices were 1 ms (black curve), 5.1 ⫾ 0.5 ms (blue curve), 8.1 ⫾ 1.7 ms (green curve), and 10.5 ⫾ 1.7 ms (orange curve), respectively. As revealed by the averaged vertical profiles obtained from five slices, the peak position of the optical response shifted from layer IV toward layer II/III and its peak amplitude increased, with the progression from stage 1 to stage 4 (Fig. 2 Ba, arrows). The averaged horizontal profiles of the excitation spread in layer II/III (n ⫽ 5) also revealed that the optical response increased both in amplitude and in spatial extent with stage progression (Fig. 2 Bb). The optical response reached a plateau level only in amplitude (⬎90% peak value indicated with an interrupted line) at the end of stage 3 (green curve), but continued to increase in the spatial extent until the end of stage 4 (orange curve), consequently exhibiting a trapezoidal pattern of the horizontal spatial profile at stage 4. The enhancement of optical responses in layer II/III has previously been predicted by the exact overlap in layer II/III between the two terminal arborization fields of layer IV and layer II/III neurons (Feldmeyer et al., 2006). The temporal profiles of the optical responses were also analyzed at ROI-1 in layer II/III and ROI-2 in layer V in five slices (Fig. 2 A, blue and red squares, respectively). The optical response in layer II/III reached a peak value at the end of stage 3 (mean lag time, 8.3 ⫾ 0.4 ms) and remained almost unchanged for 3.0 ⫾ 0.9 ms by the end of stage 4 (mean lag time, 11.3 ⫾ 1.1 ms), thereafter rapidly decaying (Fig. 2 Bc, blue filled circles). During this plateau phase (Fig. 2 Bc, inset), the excitation spread in the horizontal direction in layer II/III, as revealed by the trapezoidal pattern in the horizontal profile (stage 4) (Fig. 2 Bb, orange curve). Because of the variation of temporal profiles from slice to slice, the duration of plateau phase in the averaged temporal profile is not necessarily equivalent to the mean duration of plateau phases in five temporal profiles. The optical response in layer V displayed a similar time course to that seen in layer II/III but was much smaller in amplitude than that in layer II/III (Fig. 2 Bc, red filled circles). Spatiotemporal patterns of the excitation spread induced by layer IV stimulation in the insular cortex The vertical and horizontal spatial profiles of excitation spread in the insular cortex were documented at the following three stages in five slices examined. After microstimulation of layer IV (defined in Materials and Methods), a prominent initial optical response was evoked in a stimulated area at a latency of 1 ms (stage 1) (Fig. 2Cb), similar to that seen in the barrel cortex (Fig. 2 Ab). Subsequently, the excitation spread bidirectionally toward layers II/III and V at stage 2 with a mean lag time of 6.1 ⫾ 1.2 ms (Fig. 2Cc). It then spread over both layer II/III and layer V entirely, forming a columnar pattern of the optical image at stage 3 with a mean lag time of 10.9 ⫾ 2.7 ms (Fig. 2Cd). During stage 3, the amplitude of the optical response at the midpoint of layer II/III right above the location of the initial response reached a maximum value. As revealed by the averaged vertical profile (n ⫽ 8), the initial response observed at stage 1 with a mean lag time of 1 ms was very
Sato et al. • Excitation Spreads in Barrel and Insular Columns
J. Neurosci., March 19, 2008 • 28(12):3076 –3089 • 3079
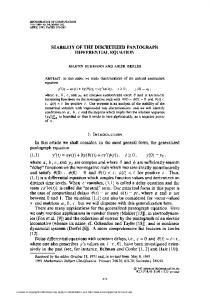
Figure 2. Spatiotemporal patterns of the excitation spread induced by stimulation of layer IV in the barrel and insular cortices. A, The image of barrels in the examined slice illuminated by transmitted light (a). Sample pseudocolor images captured at the respective times after stimulation of layer IV (b– g). Spatiotemporal patterns of the excitation spread documented at four distinct stages according to the locus of excitation (b– e). Note a marked horizontal spread of excitation in layer II/III (e). Also note that layer V/VI remained almost unexcited throughout stages 1– 4 (b– e). B, The averaged spatial patterns (n ⫽ 5) showing the vertical spread of excitation from layer IV to layer II/III (a) and those showing the horizontal spread of excitation within layer II/III (b), measured at stage 1 (black curve), stage 2 (blue curve), stage 3 (green curve), and stage 4 (orange curve). Note the upward shift of the peaks of the optical responses with the progression from stage 1 to stage 4 (a, arrows). Also note the trapezoidal pattern in the horizontal spread of excitation within layer II/III at stage 4 (b). The blue and red filled circles represent the averaged temporal profiles (n ⫽ 5) of the excitation at ROI-1 and ROI-2 in layers II/III (A, blue squares) and V (A, red squares), respectively (c). Note a plateau phase seen in the averaged (Figure legend continues.)
3080 • J. Neurosci., March 19, 2008 • 28(12):3076 –3089
sharp and strong (Fig. 2 Da, black curve). However, both the vertical spatial profiles at stages 2 and 3 displayed no sharp peak (Fig. 2 Da, blue and green curves). Thus, the excitation in the initial response appeared to spread bidirectionally into layers II/ III and V (Fig. 2 Da), unlike for the barrel cortex (Fig. 2 Ba). Contrary to the increment of the peak amplitude of responses during the vertical spread of excitation in the barrel cortex (Fig. 2 Ba), the peak amplitude of responses in the insular cortex decreased during the vertical spread of excitation (Fig. 2 Da, compare blue and green curves with black one). This suggests an involvement of the inhibition of neurons in layers II/III and V by the activity of layer IV neurons in depressing the vertical spread of excitation. This possibility was examined by applying bicuculline as described in a later section. The averaged horizontal profile in layer II/III revealed that the insular cortex never displayed a trapezoidal pattern of the horizontal spatial profile, but instead showed a triangular or bell-shaped pattern even after reaching the maximum amplitude, unlike the case in the barrel cortex (Fig. 2, compare Db, Bb). The temporal profile of the excitation in the insular cortex was also distinct from that in the barrel cortex. The optical response at ROI-1 in layer II/III (Fig. 2C, blue square) and that at ROI-2 in layer V (Fig. 2C, red square) in the insular cortex reached the peak values 10.9 ⫾ 2.6 and 8.9 ⫾ 1.1 ms (n ⫽ 8) after stimulation, respectively (Fig. 2 Dc, blue and red filled circles, respectively). In contrast to what was observed in the barrel cortex (Fig. 2 Bc), the optical responses in ROI-1 and ROI-2 decayed very slowly (Fig. 2 Dc). These results indicate that a distinct functional column exists in the insular cortex and that there may be differences in the local circuits of functional column between the insular and barrel cortices, as reflected in the differences in the spatiotemporal pattern of the optical response between the two cortices. Thus, there were distinct differences in the spatiotemporal pattern of the excitation spread between the barrel and insular cortices. Next, we examined whether GABAA inhibition is involved in generating such differences. Effects of bicuculline on the excitation spread induced by layer IV stimulation in the barrel cortex When the optical response was evoked in the presence of bicuculline (10 M) by stimulation of layer IV in the barrel cortex, the horizontal spread of excitation in layer II/III remarkably extended far beyond the distal end of the neighboring columns after 4 (Figure legend continued.) temporal profiles in layer II/III (inset). Also note that the amplitude of the averaged optical response in layer V was much smaller than that in layer II/III. C, The image of dysgranular and agranular regions of the insular cortex in the examined slice illuminated by transmitted light (a). The granular layer IV is clearly discernible under the IR-DIC optics as shown in Figure 1 Ad, but less visible in this image captured by the CCD camera for optical signals. The arrowhead indicates the RF. Sample pseudocolor images captured at the respective times (b– e). Spatiotemporal patterns of the excitation spread documented at three distinct stages according to the locus of excitation (b– d). Note that the excitation spread bidirectionally toward layers II/III and V, consequently showing a columnar image pattern. D, The averaged spatial patterns (n ⫽ 8) showing the vertical spread of excitation from layer IV to both layers II/III and V (a) and those showing the confined horizontal spatial extent of the excitation (b), measured at stage 1 (black curve), stage 2 (blue curve), and stage 3 (green curve), respectively. Note that the sharp and largest initial response at stage 1, followed by the bowl-shaped vertical pattern with smaller amplitudes (stages 2 and 3), indicating the bidirectional spread of excitation into layers II/III and V. Also note the triangular pattern of the horizontal spatial profile (b), unlike the case in the barrel cortex (Bb). The blue and red filled circles represent the averaged temporal profiles (n ⫽ 8) of the excitation at ROI-1 and ROI-2 in layers II/III (C, blue square) and V (C, red square), respectively (c). Note the slower decay of the excitation in the insular cortex than in the barrel cortex (Bc).
Sato et al. • Excitation Spreads in Barrel and Insular Columns
stage 4 (Fig. 3Be). Such a remarkable extension of the horizontal spread resulted in excitation in layer V of the same columns that exhibited the synchronous excitation in layer II/III (Fig. 3, compare Be, Ae, three arrowheads). Thereafter, the horizontal spread in layer II/III continued to extend for ⬃18 ms and reached a maximum value (Fig. 3Bf ), subsequently causing excitation in layer V of a more remote column (Fig. 3Bf, arrowhead). In five slices, the spatiotemporal patterns of the excitation spread were compared more quantitatively between the optical responses obtained in the absence and presence of bicuculline. As revealed in the averaged temporal profiles in layer II/III in the absence and presence of bicuculline (Fig. 3Ca, blue filled and open circles, respectively), bicuculline had no apparent effect on the temporal profiles until the end of stage 2 (Fig. 3Ca, black and blue arrows), but subsequently increased the peak amplitude by 37 ⫾ 16% and prolonged the half-duration from 11.4 ⫾ 3.2 ms to a mean value at least larger than 152 ms (Fig. 3Ca). Also, in layer V, until the end of stage 2 (Fig. 3Cb, black and blue arrows), there were no marked differences in the temporal profile between the optical responses in the absence and presence of bicuculline (Fig. 3Cb, red filled and open circles, respectively). Thereafter, however, bicuculline markedly increased the peak amplitude by 232 ⫾ 102% and prolonged the half-duration of the optical response in layer V from 16.8 ⫾ 6.7 ms to a mean value at least larger than 169 ms (Fig. 3Cb), similar to the case with layer II/III (Fig. 3Ca). It was difficult to accurately measure the half-duration in the presence of bicuculline because it often exceeded the measurable time window of 231 ms after stimulation. The vertical and horizontal profiles of the excitation spread obtained in the absence and presence of bicuculline (solid and dotted curves, respectively) were compared at the respective stages (Fig. 3 D, E). As revealed by averaging the spatial profiles at the same stages obtained from five slices, the vertical and horizontal profiles at stages 1 and 2 (black and blue, respectively) were not markedly affected by bicuculline (Fig. 3Da,Ea, compare solid and dotted curves). Subsequently, bicuculline increased the overall amplitudes in the vertical and horizontal profiles at stages 3 and 4, leaving their spatial extents of the excitation spread almost unchanged (Fig. 3Db,Eb, compare orange solid and dotted curves). Thereafter, however, both the amplitude and the spatial extent in the horizontal profile continued to increase, and only the amplitude reached a maximum value (Fig. 3Eb, violet dotted curve) at a time, which was defined as the end of stage 5 (mean lag time, 23.5 ⫾ 9.1 ms) (Fig. 3Ca, violet arrow). Then, after the slow decay of the optical response (Fig. 3Ca, blue open circles), the spatial extent in the horizontal profile was further increased, and reached a maximum value (Fig. 3Eb, red dotted curve) at a time that was defined as the end of stage 6 (mean lag time, 40.3 ⫾ 9.6 ms) (Fig. 3Ca, red arrow). The amplitude at ROI-1 at the end of stage 6 was smaller than the maximum value at the end of stage 5, but was invariably larger than that of the response showing the maximum horizontal width at stage 4 in the absence of bicuculline (Fig. 3Eb, compare red dotted curve and orange solid curve). The enhancement or generation of the excitation in layer V (Fig. 3Db, asterisk), especially at stage 6, was invariably associated with the remarkable extension of the horizontal spread of excitation within layer II/III (Fig. 3Eb, asterisk). These results indicate that GABAA inhibition began to operate after the excitation left layer IV and propagated into layer II/III, suggesting that the GABAergic interneurons were activated after activation of layer II/III pyramidal neurons. The synchronous excitation of neighboring columns within layer II/III (Fig. 3Eb, asterisk) resulted in the excitation of layer V output neurons in
Sato et al. • Excitation Spreads in Barrel and Insular Columns
J. Neurosci., March 19, 2008 • 28(12):3076 –3089 • 3081
the width of columnar pattern increased in comparison with the case in the absence of bicuculline (Fig. 4A,B). The temporal profiles of excitation in layers II/III and V (ROI-1 and ROI-2, respectively) (Fig. 4A,B) were compared in the absence and presence of bicuculline (filled and open circles, respectively) (Fig. 4Ca,Cb). Bicuculline began to affect the temporal profiles of the excitation in layers II/III and V by the end of stage 2 (Fig. 4Ca,Cb, blue arrows). Subsequently, bicuculline markedly increased the amplitudes of the optical responses in layers II/III and V by 138 ⫾ 64 and 170 ⫾ 102%, respectively, and prolonged the times-to-peak from 11.0 ⫾ 3.2 to 37.6 ⫾ 7.9 ms in layer II/III (Fig. 4Ca, green and orange arrows) and from 9.0 ⫾ 1.3 to 39.4 ⫾ 11.7 ms in layer V (Fig. 4Cb, green and orange arrows). As also revealed by the averaged vertical and horizontal profiles of the excitation spread, bicuculline did not markedly affect these profiles at stage 1 (Fig. 4C, black arrow; Da,Ea, black solid and dotted curves). At stages 2 and 3 (Fig. 4C, blue and green arrows), bicuculline increased the amplitudes of the optical responses in both layers II/III and V/VI to values larger than those of the initial response, without changing the spatial extents in the vertical and horizontal profiles markedly (Fig. 4D,E, blue and green solid and dotted curves). Thereafter, both the amplitude and the spatial extent in the vertical and horizontal profiles were considerably increased by bicuculline, for example, 34 ms after stimulation (Fig. 4Bd) during stage 4 (Fig. 4Db,Eb, orange solid and dotted curves). Then, only the amplitude reached a maximum value at a time that was defined as the end of stage 4 (mean lag time, 40.5 ⫾ 10.3 ms) (Fig. 4Ca, orange arrow). This would indicate that inhibition of neurons in layers II/ III and V/VI by the activity of the layer IV Figure 3. Effects of bicuculline on the excitation spread induced by layer IV stimulation in the barrel cortex. A, B, Sample neurons is involved in depressing the vertical pseudocolor images captured at the respective times in the absence (A) and presence (B) of bicuculline (10 M). Note a marked spread of excitation, as originally suggested extension of the horizontal spread in layer II/III far beyond the distal end of the neighboring columns by bicuculline, leading to an by the control spatiotemporal pattern. The excitation in layer V (Be, Bf, arrowheads) of the columns that displayed synchronous excitation in layer II/III. C–E, Slight and averaged vertical profile of the excitation marked increases in excitation in layers II/III and V, respectively, with marked prolongation in the decay time course in both layers spread revealed a marked synchronous exciII/III and V after bicuculline application (Ca, Cb). No apparent effect of bicuculline on the spatiotemporal patterns of the excitation in layers II/III and V before stage 3 (compare Aa,b, Ba,b; also see Ca,b, Da, and Ea). The obvious enhancements of the amplitude tation between neurons in layers II/III and and spatial extent in the vertical and horizontal profiles by bicuculline at stages 5 and 6 (compare solid and dotted curves in Db V/VI, particularly during stage 4, in the presand Eb). It is likely that GABAA inhibition began to operate after the excitation propagated into layer II/III. Note that the ence of bicuculline (Fig. 4Db, asterisk). Nevsimultaneous excitation of layer II/III between the neighboring columns (Eb, *) increases the excitation of layer V output neurons ertheless, the spatial extent in the horizontal (Db, *) in the same columns as those displaying the excitation in layer II/III. profile in the insular cortex remained much smaller than in the barrel cortex (compare the same columns (Fig. 3Db, asterisk). This may be reflected in Figs. 3Eb, 4Eb). These results indicate that the activity of GABAA action is mainly involved in the intracolumnar inhibition in the inthe longer time-to-peak of the excitation in layer V in comparisular cortex, rather than in the intercolumnar lateral inhibition simson with that in layer II/III (Fig. 3, compare violet arrow in Ca, ilar to that seen in the barrel cortex. red arrow in Cb). Effects of bicuculline on the excitation spread induced by layer IV stimulation in the insular cortex When the optical response was evoked in the presence of bicuculline (10 M) by stimulation of layer IV in the insular cortex,
Differential effects of bicuculline on the optical responses between the barrel and insular cortices Between the barrel and insular cortices, the effects of bicuculline on the vertical and horizontal profiles of the maximum
3082 • J. Neurosci., March 19, 2008 • 28(12):3076 –3089
Sato et al. • Excitation Spreads in Barrel and Insular Columns
spread were compared. First, we defined the amplitudes in layers II/III (ROI-1) and V (ROI-2) in the vertical profile as p and q, respectively (Fig. 5Aa,b), and calculated the ratio of q/p to evaluate the vertical spread. The q/p measured at the time of the maximum vertical spread was significantly ( p ⬍ 0.001) larger in the insular cortex (0.68 ⫾ 0.10; n ⫽ 5) than in the barrel cortex (0.22 ⫾ 0.05; n ⫽ 5) (Fig. 5B, gray and black solid bars). After application of bicuculline, the q/p in the barrel cortex significantly ( p ⬍ 0.001) increased to 0.51 ⫾ 0.03 (Fig. 5B, black solid and hollow bars), whereas the q/p in the insular cortex increased significantly ( p ⬍ 0.001) but only to 0.82 ⫾ 0.08 (Fig. 5B, gray solid and hatched bars). Next, to compare the effects of bicuculline on the horizontal spread of excitation, we measured the width at the 90% value of the averaged maximum amplitude (0.9-max width) in the horizontal profile to estimate the maximal spatial extent of the horizontal spread of excitation (Fig. 5Ca,Cb). The averaged maximum amplitude was calculated by averaging over the amplitudes of five respective points distributed within ⫾40 m from the peak point along the horizontal axis, at stage 4 (control) and stage 6 (effects of bicuculline) in the barrel cortex (Fig. 5Ca) and at stage 3 (control) and stage 4 (effects of bicuculline) in the insular cortex (Fig. 5Cb). In the absence of bicuculline, the 0.9-max width was significantly ( p ⬍ 0.02) larger in the barrel cortex (392 ⫾ 52 m) than in the insular cortex (144 ⫾ 56 m) (Fig. 5D, black and gray solid bars). After bath application of bicuculline, the 0.9-max width underwent a significant ( p ⬍ 0.001) increase of 940 ⫾ 227 m in the barrel cortex (Fig. 5D, black solid and hollow bars) without Figure 4. Effects of bicuculline on the excitation spread induced by layer IV stimulation in the insular cortex. A, B, Sample a marked increase in amplitude (Fig. pseudocolor images captured at the respective times in the absence (A) and presence (B) of bicuculline (10 M). Note an apparent wider columnar image pattern of the excitation spread in the insular cortex after bicuculline application (Bd). C–E, 5Ca), whereas it underwent a significant Marked increases in the excitation and the prominent prolongation in the decay time course by bicuculline in both layers II/III and ( p ⬍ 0.005) but small increase of 340 ⫾ V (Ca, Cb). No apparent effect of bicuculline on the spatiotemporal patterns of the excitation in layers II/III and V/VI before stage 68 m in the insular cortex (Fig. 5D, gray 2 (compare Aa,b, Ba,b; see also Da and Ea). Marked enhancements of the amplitude and spatial extent in the vertical and solid and hatched bars) after marked in- horizontal profiles by bicuculline at stages 3 and 4 (compare Ac,d, Bc,d; see also Db and Eb). It is likely that GABAA inhibition of creases in the amplitudes of the optical neurons in layers II/III and V/VI began to operate as soon as the excitation reached the respective layers (Db, *). responses (Fig. 5Cb). The extension of the horizontal spread of excitation by tex, bicuculline similarly increased both the times-to-peak in laybicuculline was significantly ( p ⬍ 0.001) larger in the barrel ers II/III and V from their similar control values (Fig. 4Ca,b, cortex than in the insular cortex. orange arrows), as late as those in layer V/VI of the barrel cortex. In the barrel cortex, the time-to-peak of optical responses in This would suggest the involvement of mutual interaction bethe presence of bicuculline was significantly ( p ⬍ 0.02) longer in tween layers II/III and V/VI pyramidal neurons in increasing the layer V (34.2 ⫾ 8.0 ms) than in layer II/III (23.4 ⫾ 4.0 ms) (Fig. 3, amplitude of the optical response throughout the whole column compare violet and red arrows in Ca and Cb). This longer timein the insular cortex. to-peak in layer V may indicate that the increase in the 0.9-max Thus, regardless of the absence or presence of bicuculline, width in layer II/III by bicuculline was followed by the increases there were distinct differences in the spatiotemporal pattern of in the q/p ratio, suggesting that, in the barrel cortex, the extension excitation spread or propagation between the barrel and insular of horizontal spread of excitation in layer II/III consequently cortices, suggesting the difference at least in the excitatory local enhanced the excitation in layer V. However, in the insular cor-
Sato et al. • Excitation Spreads in Barrel and Insular Columns
J. Neurosci., March 19, 2008 • 28(12):3076 –3089 • 3083
ROI-1 by stimulation of layer III displayed a composite temporal profile (Fig. 6 Ea), in which a transient plateau phase was followed by a small slow component (compare Figs. 6 Ea, 2 Bc). The 0.9-max width was measured just before the offset of the plateau phase (Fig. 6 Ea, arrowhead). When the stimulus intensity was increased from 4.6 ⫾ 0.6 to 6.6 ⫾ 0.6 V (n ⫽ 4), the maximum amplitude of the optical response at ROI-1 to layer III stimulation significantly ( p ⬍ 0.05) increased by 23 ⫾ 9% (Fig. 6 Ea), which was accompanied by a significant ( p ⬍ 0.05) increase in the 0.9max width from 450 ⫾ 46 to 550 ⫾ 91 m (Fig. 6Gb). Although the optical responses induced by layer III stimulation tended to display a larger 0.9-max, both ends of the horizontal spatial profile at the 0.9-max amplitude never exceeded the distal end of the adjacent columns (Fig. 6C,Gb), as were the cases with layer IV stimulation (Fig. 6 A). As long as the optical response displays a trapezoidal spatial profile of Figure 5. Comparison of the effects of bicuculline on the optical responses induced by layer IV stimulation between the the horizontal excitation spread in layer barrel and insular cortices. A, Vertical profiles of excitation spread in the barrel (a) and insular (b) cortices obtained in the II/III, the maximum amplitude of such a absence (solid curves) and presence (dotted curves) of bicuculline. B, The ratio (q/p; see Results for detail) was significantly greater in the insular cortex (0.68 ⫾ 0.10; n ⫽ 5) than in the barrel cortex (0.22 ⫾ 0.05; n ⫽ 5). Bath application spatial profile may reflect the number of of bicuculline significantly increased the ratio (q/p) in the barrel cortex (0.51 ⫾ 0.03; n ⫽ 5), whereas a significant but neurons in unit area that display synsmaller increase was observed in the insular cortex (0.82 ⫾ 0.08; n ⫽ 5). ***p ⬍ 0.001. C, Horizontal profiles of chronous activity, and the 0.9-max width excitation spread in the barrel (a) and insular (b) cortices obtained in the absence (solid curves) and presence (dotted may reflect the horizontal spatial extent curves) of bicuculline. D, The 0.9-max width (see Results for detail) of the horizontal spread of excitation in the barrel of the area, in which layer II/III neurons cortex (392 ⫾ 52 m) was significantly greater than in the insular cortex (144 ⫾ 56 m). Bath application of bicuculline display synchronous activity. Therefore, significantly increased the 0.9-max width in the barrel (1332 ⫾ 258 m) and insular cortices (484 ⫾ 70 m), respec- the effects of changes in the stimulus intively. Note that the extension of the horizontal spread by bicuculline was significantly greater in the barrel cortex (940 ⫾ tensity on the horizontal spatial extent of 227 m) than in the insular cortex (340 ⫾ 68 m). *p ⬍ 0.02; **p ⬍ 0.005; ***p ⬍ 0.001. synchronized area can be estimated by comnetwork between the two cortices. However, it is not clear paring the 0.9-max width of the horizontal spatial profiles whether these differences arise depending on the stimulation site having different amplitudes (Fig. 6Gb). or stimulus intensity. In the next series of experiments, we examBath application of picrotoxin markedly prolonged the ined the effects of changes in the stimulus intensity and of temporal profiles of optical responses without markedly changes in the stimulation site on the optical responses. changing the initial responses (Fig. 6 Fa), similar to the case with the bath application of bicuculline (Fig. 3Ca). Thus, the Effects of changes in the stimulus intensity and in the characteristic trapezoidal pattern of the horizontal spatial prostimulation site on the optical responses in the barrel cortex file seen in response to layer IV stimulation in the barrel cortex As seen in the pseudocolor images (Fig. 6 A), the amplitude (Fig. 3 A, B,E) was preserved in response to layer III stimulaand the extent of horizontal excitation spread of optical retion, and was not markedly affected by changing the stimulus sponses in layer II/III at stage 4 appeared to increase with an intensity, regardless of the absence or presence of picrotoxin increase in the intensity of stimulation applied to a layer IV (Fig. 6C, D, Gb). barrel. When the intensity of stimulation applied to layer IV Next, we compared the two optical responses induced by was linearly increased from 4.0 to 7.0 V by 1 V step in four stimulation of layer III (5.8 ⫾ 1.8 V) and layer V (5.8 ⫾ 0.7 V) in different slice preparations, the mean maximum amplitude of the same slice preparation to examine the effects of changes in the optical responses at ROI-1 (Fig. 6 Ba) and the mean 0.9-max stimulation site on the optical response. In contrast to the bandwidth (Fig. 6 Bb) at stage 4 increased in parallel. After an inlike image pattern induced 10 and 16 ms after layer III stimulacrease in the stimulus intensity from 4.0 to 6.0 V, the maxition (Fig. 7A), stimulation of a site of layer V in the same slice mum amplitude of the optical response at ROI-1 increased preparation induced beaded-string-like image patterns at the significantly ( p ⬍ 0.05) by 23 ⫾ 13%, and the 0.9-max width same timings (Fig. 7Ba). However, the same stimulation of layer also increased significantly ( p ⬍ 0.01) from 315 ⫾ 38 to 480 ⫾ V in the presence of picrotoxin caused a band-like image pattern 37 m. However, both ends of the horizontal spatial profile at in layer II/III similar to that caused by stimulation of layer III the 0.9-max amplitude never exceeded the distal end of the (Fig. 7A), only at a latency ⬎16 ms (Fig. 7Bb). Thus, when stimadjacent columns. ulation was applied to layer V in the presence of picrotoxin, the A similar horizontal excitation spread was induced by stimuspatial profile of an excitation spread in the horizontal direction lation of layer III (Fig. 6C). However, unlike those induced by in layer II/III was very similar to that caused by stimulation of layer IV stimulation (Fig. 2 Bc), the optical response induced at layer IV or III (Figs. 2 A, 6C), whereas the temporal profile was
3084 • J. Neurosci., March 19, 2008 • 28(12):3076 –3089
Sato et al. • Excitation Spreads in Barrel and Insular Columns
much slower than that caused by stimulation of layer IV or III (compare Fig. 7Da with Figs. 3Ca, 6 Fa). During this slow time course, a small excitation caused in layer II/III by stimulation of layer V was amplified markedly within layer II/III (Fig. 7Ea) and spread in the horizontal direction (Fig. 7Eb), in the presence of picrotoxin. Thus, regardless of the stimulation site, a characteristic trapezoidal pattern of spatial profile of the excitation spread in the horizontal direction in layer II/III was invariably induced in the barrel cortex. Comparison of vertical excitation spread between the optical responses induced by stimulation of layer IV and layer III with varying intensities in the insular cortex In the insular cortex, the characteristic vertical spatial profile of excitation spread was not affected by changing stimulus intensity. Despite decreases in the intensity of stimulation applied to layer IV from 6.8 ⫾ 1.3 to 5.1 ⫾ 0.7 V (n ⫽ 4), the bidirectional excitation spread in the vertical direction into the superficial layer II/III and deep layer V/VI remained almost unchanged, al- Figure 6. Effects of changes in the stimulus intensity and the stimulation site on the optical response in the barrel cortex. A, though the amplitude of optical response Sample pseudocolor images of optical responses obtained at stages 1, 2, and 4 after a weak (4.0 V) (a) and strong (6.0 V) (b) was decreased (Fig. 8 A–C). In contrast, the stimulation applied to a layer IV barrel. B, The mean peak amplitude of NOR at ROI-1 (n ⫽ 4) (a) and the mean 0.9 max-width at excitation initiated by stimulation of layer stage 4 (n ⫽ 4) (b) plotted against stimulus intensity. *p ⬍ 0.05; **p ⬍ 0.01. C, D, Sample pseudocolor images of optical III appeared not to spread vertically into responses obtained 1, 10, and 22 ms after a weak (5.0 V) (a) and strong (7.0 V) (b) stimulation applied to layer III before (C) and the deep layer V/VI but remained confined after application of picrotoxin (100 M) (D). E, F, Averaged temporal profiles of optical responses (n ⫽ 4) to stimulation of layer III with weak (4.6 ⫾ 0.6 V) (open circles) and strong (6.6 ⫾ 0.6 V) (filled circles) intensities at ROI-1 (layer II/III) (a, blue circles) mostly within superficial layer II/III (Fig. and ROI-2 (layer V) (b, red circles) obtained before (E) and after application of picrotoxin (100 M) (F ). Responses at ROI-1 and 8 D–F ) regardless of the stimulus intensity -2 were normalized to the peak amplitude of the optical response at ROI-1 to a weak stimulation. Note the presence of a plateau changed between 5.0 ⫾ 0.7 and 6.6 ⫾ 0.8 V phase (arrowhead) in the temporal profiles at ROI-1 regardless of stimulus intensity (Ea) versus no marked response at ROI-2 (n ⫽ 4), as indicated by the lower horizon- (Eb). Application of picrotoxin caused marked increases in the optical response at ROI-1 (Fa) followed by a slower increase in the tal interrupted lines representing the bor- optical response at ROI-2 (Fb). The black solid and dotted lines (Fa) represent the same temporal profiles as those represented by der between layer III and layer V (Fig. 8 D). blue filled and open circles (Ea). No marked differences in the initial phase between the temporal profiles at ROI-1 obtained Thus, in the insular cortex, the layer IV before and after picrotoxin. G, Averaged vertical (a) and horizontal spatial profiles (b) of optical responses (n ⫽ 4) to stimulation stimulation invariably caused the bidirec- of layer III with weak (dotted curves) and strong (solid curve) intensities. Both ends of the horizontal spatial profile at the 0.9-max tional excitation spread in the vertical di- amplitude never exceeded the distal end of the adjacent columns (b), despite increase in stimulus intensity, unless GABAA rection, whereas layer III stimulation receptors are blocked by picrotoxin or bicuculline. caused a much less vertical spread confined vealed by the differential vertical spatial profiles (Fig. 9Ea, blue mostly within layer II/III. These were also revealed by the absence and red solid curves) and also by the temporal profiles (Fig. and presence of the difference in the amplitude between the tem9Ca,Da). In contrast to the difference in the amplitude between poral profiles at ROI-1 and ROI-2, in the optical responses to ROI-1 and ROI-2 in response to layer III stimulation (Fig. 9Ca, layer IV and layer III stimuli, respectively, regardless of stimulus compare blue and red filled circles), there was no apparent difintensity (Fig. 8 B, E). Such differences in the vertical excitation ference in the amplitude between ROI-1 and ROI-2 after the spread between the responses to stimulation of layer IV and layer narrow columnar pattern was formed at a latency of 13 ms after III (Fig. 8 A–C,D–F, respectively) may suggest that the synaptic stimulation of layer V (Fig. 9Da, compare blue and red filled connection between superficial and deep layers is not simply a circles). Thus, the synaptic connections between the deep and reciprocal one. In the next experiments, we addressed this possisuperficial layers in the insular cortex appeared not to be bility by directly comparing the two optical responses initiated by reciprocal. stimulation of layer III and layer V in the same slice preparation. However, in the presence of picrotoxin, the optical response measured 9 ms after layer III stimulation was markedly enhanced Consistent vertical excitation spread regardless of stimulation (Fig. 9, compare Aa, Ba; also compare filled and open circles in of layer III or layer V Ca), and then spread in the vertical direction into the deep layer In four slice preparations examined, the vertical excitation spread V/VI, consequently displaying a wide columnar image pattern initiated by stimulation of layer III (6.1 ⫾ 1.4 V) seemed to re(Fig. 9Ba), as partly revealed by the vertical spatial profile (Fig. main confined mostly within layer II/III (Fig. 9Aa), whereas that 9Eb, blue dotted curve). Picrotoxin also changed the narrow coinitiated by layer V stimulation (5.4 ⫾ 1.0 V) extended from deep lumnar pattern caused by layer V stimulation into a wide columto superficial layers to form a narrow columnar image pattern nar one (Fig. 9Ab,Bb), which may be secondary to increases in the (Fig. 9Ab). Such differential vertical excitation spreads were re-
Sato et al. • Excitation Spreads in Barrel and Insular Columns
J. Neurosci., March 19, 2008 • 28(12):3076 –3089 • 3085
deep layer. This may be attributable to the differential synchronization mechanisms in the superficial and deep layers, as described in Discussion. Thus, regardless of changes in the stimulation site, the insular cortex consistently displayed the characteristic columnar image pattern of excitation spread in response to stimulation of layer III, layer IV, or layer V, either in the absence or presence of picrotoxin.
Discussion The intracolumnar and intercolumnar flow of excitation in the barrel cortex In the barrel cortex, bicuculline had no apparent effect on the spatiotemporal patterns of the excitation spread until the excitation reached layer II/III at stage 3, Figure 7. Comparison of the two optical responses induced by stimulation of layer III and layer V in the barrel cortex. A, but subsequently produced a slight inSample pseudocolor images of optical responses obtained 1, 10, and 16 ms after stimulation of layer III. B, Sample pseudocolor crease in the peak amplitude and a images of optical responses obtained 1, 10, and 16 ms after stimulation of layer V before (a) and after application of picrotoxin (100 M) (b), displaying a beaded-string-like horizontal spread (a) and band-like horizontal spread (b), respectively. C, Aver- marked increase in the spatial extent of aged temporal profiles of optical responses at ROI-1 (n ⫽ 4) after stimulation of layer III (black circles) and layer V (blue circles), the horizontal spread in layer II/III (Fig. showing fast and slow rising time courses, respectively. D, Averaged temporal profiles of optical responses at ROI-1 (n ⫽ 4) (a, 3). This would indicate that GABAA acblue circles) and -2 (n ⫽ 4) (b, red circles) obtained by stimulation of layer V, before (filled circles) and after (open circles) tion begins immediately after the activaapplication of picrotoxin. E, Averaged vertical (n ⫽ 4) (a) and horizontal spatial profiles (n ⫽ 4) (b) of optical responses obtained tion of layer II/III pyramidal neurons to 16 –32 ms after stimulation of layer V in the absence (solid curve) and presence of picrotoxin (dotted curves). depress the horizontal spread of excitation. This is consistent with the previous findings that layer IV stellate neurons amplitudes of the optical responses in superficial and deep layers, make synaptic contacts onto pyramidal neurons, but not onto as revealed by the vertical spatial profile (Fig. 9, compare red solid GABAergic neurons, in layer II/III (Feldmeyer et al., 2002). and dotted curves in Ea and Eb). These wide columnar image In the absence of bicuculline, when the excitation reached patterns in the presence of picrotoxin were very similar to those layer II/III, it increased in strength and spread in the horizontal induced by stimulation of layer IV in the presence of bicuculline direction into the neighboring columns only partly, in layer II/III (Fig. 4 B). Thus, a reciprocal excitatory synaptic connection be(Fig. 2 A, B), in good agreement with the findings in the previous tween infragranular and supragranular layers emerged after rereport (Petersen and Sakmann, 2001). However, it is reported moving GABAA inhibition. that the axon collaterals of layer II/III pyramidal neurons extend In the optical responses induced by layer III stimulation in horizontally across two or three neighboring columns (1100 – the presence of picrotoxin (Fig. 9Ca,Cb), the time-to-peak 1200 m) (Lubke et al., 2003). Nevertheless, the majority of (59 ⫾ 11 ms) (red arrowhead) of the temporal profile at ROI-2 monosynaptic connections were detected between two layer II/ (red open circles) was invariably later than that (43 ⫾ 10 ms) III pyramidal neurons separated by an intercellular distance of (blue arrowhead) at ROI-1 (blue open circles), as expected ⬍100 –200 m (Holmgren et al., 2003; Feldmeyer et al., 2006). from the conduction delay from the superficial layer to the Then, the excitation spread in the horizontal direction into the deep layer. In contrast, in those induced by layer V stimulation neighboring columns in layer II/III may be primarily mediated by in the presence of picrotoxin (Fig. 9Da,b), the time-to-peak at disynaptic transmission between layer II/III pyramidal neurons. ROI-1 (71 ⫾ 9 ms) (blue arrowhead) was unexpectedly Such disynaptic transmissions would be more easily depressed by slightly earlier than that at ROI-2 (75 ⫾ 12 ms) (red arrowlateral inhibition, compared with monosynaptic transmission. head). Because there should be a conduction delay from the Indeed, after bicuculline application, the horizontal spread in deep layer to the superficial layer as seen in the absence of layer II/III extended remarkably beyond the distal end of the picrotoxin (Fig. 9Da, red and blue filled circles), the possible neighboring columns, during the prolonged time course from difference in the time-to-peak between ROI-1 and ROI-2 stage 4 to 6, indicative of disynaptic or polysynaptic transmission might have been masked by the active interaction between (Fig. 3). Thus, the intercolumnar synchronization in layer II/III layer III and layer V in the presence of picrotoxin. seems to be strictly controlled by GABAA inhibition (Laaris et al., Indeed, the time-to-peak at ROI-2 in the optical response 2000; Petersen and Sakmann, 2001; Laaris and Keller, 2002), induced by layer V stimulation (75 ⫾ 12 ms) was invariably and which is likely to operate in a feedforward manner after activation significantly ( p ⬍ 0.001) later than the time-to-peak at the same of layer II/III pyramidal neurons in the home column by the ROI-2 in the optical response induced by layer III stimulation inputs arising from layer IV. (59 ⫾ 11 ms). This suggests the activation of interactions or recurring inputs between layer III and layer V after the excitation The intracolumnar and intercolumnar flow of excitation in spread from the deep layer to the superficial layer in response to the insular cortex layer V stimulation. Layer III stimulation may not have activated Our data strongly suggest that the functional column does such interactions or recurring inputs because the amplitude of exist in the insular cortex, because the insular cortex displayed optical responses in the superficial layer reached the maximum a columnar image pattern of the excitation spread in response before or not later than the complete excitation spread into the
3086 • J. Neurosci., March 19, 2008 • 28(12):3076 –3089
Sato et al. • Excitation Spreads in Barrel and Insular Columns
Figure 8. Effects of changes in the stimulus intensity and the stimulation site on the optical response in the insular cortex. A, Sample pseudocolor images of optical responses obtained 1, 5, and 12 ms after stimulation of layer IV with a strong (6.5 V) (a) and weak intensity (5.0 V) (b). B, Averaged temporal profiles of optical responses (n ⫽ 4) to stimulation of layer IV with strong (6.8 ⫾ 1.3 V) (a, filled circles) and weak (5.1 ⫾ 0.7 V) (b, open circles) intensities at ROI-1 (layer II/III; blue circles) and ROI-2 (layer V; red circles). C, Averaged vertical spatial profiles of optical responses (n ⫽ 4) obtained 1 ms (black curves) and 12–13 ms (green curves) after stimulation of layer IV with strong (solid curves) and weak (dotted curves) intensities. D, Sample pseudocolor images of optical responses obtained 1, 5, and 9 ms after stimulation of layer III with a strong (6.5 V) (a) and weak intensity (5.0 V) (b). E, Averaged temporal profiles of optical responses (n ⫽ 4) to stimulation of layer III with strong (6.6 ⫾ 0.8 V) (a, filled circles) and weak (5.0 ⫾ 0.7 V) (b, open circles) intensities at ROI-1 (layer II/III; blue circles) and ROI-2 (layer V; red circles). F, Averaged vertical spatial profiles of optical responses (n ⫽ 4) obtained 1 ms (black curves) and 9 –10 ms (green curves) after stimulation of layer III with strong (solid curves) and weak (dotted curves) intensities.
to stimulation of layer IV (Fig. 2C,D). Recently, it has been demonstrated by intrinsic optical imaging in rat brain that the insular cortex displays the chemotopy for the four basic tastes of sweet, salty, sour, and bitter localized sequentially along the rostrocaudal extent, although there were considerable overlaps among their representation areas (Accolla et al., 2007). Such a topographical representation would require functional columns. In the presence of bicuculline, the spatial pattern of the excitation spread remained unchanged only at stage 1. Thereafter, however, bicuculline markedly increased the amplitude of the optical responses in layer II/III (Fig. 4Ca) and in layer V (Fig. 4Cb), which was accompanied by the extension of the width of the columnar image pattern. These observations would indicate that the two groups of GABAergic interneurons located in layers II/III and V within the same column begin to operate in parallel as soon as the excitation from layer IV reaches the respective layers, suggesting the presence of direct synaptic connections from layer IV neurons to GABAergic interneurons and pyramidal neurons in both layers. Therefore, it is likely that layer
IV neurons, presumably star pyramidal neurons, in deep layer III of the insular cortex exert simultaneous feedforward inhibition on pyramidal neurons in layers II/III and V, through the activation of GABAergic interneurons in the respective layers within the same column. Indeed, the time-to-peak and amplitude of the optical response in layer V were increased, in parallel with increases in those in layer II/III, after bicuculline application. Thus, the wider columnar pattern of the excitation spread on removal of GABAergic inhibition may be simply attributable to the enlargement of the “subliminal fringe” after the enhancement of the optical response in the whole column, rather than attributable to the removal of lateral inhibition. Distinctive and common features of columnar information processing between the barrel and insular cortices The horizontal and vertical excitation spreads were consistently induced in the barrel and insular cortices, respectively, even by stimulation of different layers with varying intensities, indicating the distinctive features of columnar information processing in the respective cortices. Involvement of GABAA
Sato et al. • Excitation Spreads in Barrel and Insular Columns
J. Neurosci., March 19, 2008 • 28(12):3076 –3089 • 3087
Figure 9. Asymmetrical connections between superficial and deep layers in the insular cortex. A, B, Sample pseudocolor images captured at the respective times in response to stimulation of layer III (a) and layer V (b), before and after application of picrotoxin, respectively. C, D, The averaged temporal profiles (a) of the optical responses at ROI-1 (n ⫽ 4) (blue circles) and ROI-2 (n ⫽ 4) (red circles), evoked by stimulation of layer III and layer V, respectively. Superimposed scaled temporal profiles at ROI-1 (blue circles) and ROI-2 (red circles) obtained in the presence of picrotoxin (b). The blue and red arrowheads indicate the mean times-to-peak (n ⫽ 4) at ROI-1 and ROI-2, respectively, to stimulation of layer III (Cb) and layer V (Db). S–G averaging was not applied. E, The averaged vertical spatial profiles (n ⫽ 4) obtained 7–9 and 13–20 ms after stimulation of layer III (a, blue solid curve) and layer V (a, red solid curve), respectively, and those obtained 32–35 and 31–35 ms after stimulation of layer III (b, blue dotted curve) and layer V (b, red dotted curve), respectively, in the presence of picrotoxin.
action in the columnar information processing was also distinctive between the two cortices. Therefore, the columnar information processing may not be universal across the different cortical areas. Nevertheless, there was an important common feature in the columnar information processing between the barrel and insular cortices. Regardless of the barrel or the insular cortex, stimulation in layer III caused a prominent excitation spread radially from the stimulation site (Figs. 6C,D, 7A, 8 D, 9Aa,Ba), whereas layer V stimulation never caused such a radial spread, but induced the excitation spread in layer II/III apart from the stimulation site (Figs. 7B, 9Ab,Bb). Therefore, synchronous activity appeared to be primarily caused among supragranular layer neurons, which can lead to the generation or enhancement of synchronous activity among infragranular layer neurons in the presence of bicuculline or picrotoxin (Figs. 3, 4, 7Bb, 9Bb). Indeed, in the presence of picrotoxin, the time-to-peak of the synchronized optical response in infragranular layers (ROI-2) to stimulation of layer V was invariably later than that of the synchronized optical response in infragranular layers (ROI-2) to stimulation of layer III (Fig.
9Cb,Db). This observation strongly suggests that the synchronization of neuronal activity in deep layers is secondary to the synchronous activity in superficial layers. Such layer-dependent synchronization may be explained by the possibility that the recurrent synaptic connections among layer II/III pyramidal neurons are much stronger than those among layer V/VI pyramidal neurons. Dual recordings from pairs of layer II/III pyramidal neurons and those from pairs of layer V neurons revealed no marked differences in the mean amplitude of unitary EPSPs, release probability, and the number of release sites between the synaptic connections among layer II/III and those among layer V pyramidal neurons (Feldmeyer et al., 2006; Frick et al., 2007, 2008). Then, the amount of convergence of the recurrent collateral inputs may be larger in layer II/III pyramidal neurons than in layer V pyramidal neurons. In support of such an idea, morphological studies revealed that recurrent axon collaterals of layer II/III pyramidal neurons form much more dense terminal fields in layer II/III than those of layer V pyramidal neurons do in layer V (Feldmeyer et al., 2006; Frick et al., 2008). Thus, synchronous activity would be easily induced in supragranular layer
3088 • J. Neurosci., March 19, 2008 • 28(12):3076 –3089
neurons, whereas the synchronous activity of infragranular layer neurons may be secondary to that in infragranular layer neurons. This may be a universal feature of columnar information processing regardless of cortical areas. The functional significance of columnar organization in the insular cortex In the insular cortex, a variety of neurons that respond to taste, tactile, thermal, or nociceptive stimulation (Cechetto and Saper, 1987; Yamamoto et al., 1988; Allen et al., 1991; Hanamori et al., 1998) were layer-specifically distributed. Tasteresponsive neurons together with low-threshold mechanoreceptive and wide-dynamic range neurons were mainly identified in layer V, whereas nociceptive-specific neurons were in layer II/III (Wang and Ogawa, 2002). The insular cortex is also involved in autonomic responses, because electrical stimulation of the insular cortex caused salivary secretion (Penfield and Boldrey, 1937; Cechetto and Saper, 1990), swallowing, throat sensation (Penfield and Boldrey, 1937), and changes in arterial blood pressure, heart rate (Ruggiero et al., 1987; Yasui et al., 1991), and gastric motility (Yasui et al., 1991). The neurons involved in these autonomic responses were found to be located in layer V (Ruggiero et al., 1987; Yasui et al., 1991). Taste perception may be performed through the integration of gustatory and somesthetic sensations, such as tactile, thermal, and nociceptive ones (Katz et al., 2002). The nociceptive sensation in the oral cavity may be somehow involved in hot and spicy “taste” sensation through the activation of capsaicin receptors. If such nociceptive sensation participates in the perception of taste, the sensory information arising from diverse modalities during tasting food would be integrated within a column through the strong facilitatory interaction between neurons in layers II/III and V/VI, as observed in the present study.
References Accolla R, Bathellier B, Petersen CC, Carleton A (2007) Differential spatial representation of taste modalities in the rat gustatory cortex. J Neurosci 27:1396 –1404. Allen GV, Saper CB, Hurley KM, Cechetto DF (1991) Organization of visceral and limbic connections in the insular cortex of the rat. J Comp Neurol 311:1–16. Bender KJ, Rangel J, Feldman DE (2003) Development of columnar topography in the excitatory layer 4 to layer 2/3 projection in rat barrel cortex. J Neurosci 23:8759 – 8770. Cechetto DF, Saper CB (1987) Evidence for a viscerotopic sensory representation in the cortex and thalamus in the rat. J Comp Neurol 262:27– 45. Cechetto DF, Saper CB (1990) Role of the cerebral cortex in autonomic functions. In: Central regulation of autonomic functions (Loewy AD, Spyer KM, eds), pp 208 –223. New York: Oxford UP. Chagnac-Amitai Y, Connors BW (1989) Synchronized excitation and inhibition driven by intrinsically bursting neurons in neocortex. J Neurophysiol 62:1149 –1162. Feldmeyer D, Egger V, Lubke J, Sakmann B (1999) Reliable synaptic connections between pairs of excitatory layer 4 neurones within a single “barrel” of developing rat somatosensory cortex. J Physiol (Lond) 521:169 –190. Feldmeyer D, Lubke J, Silver RA, Sakmann B (2002) Synaptic connections between layer 4 spiny neurone-layer 2/3 pyramidal cell pairs in juvenile rat barrel cortex: physiology and anatomy of interlaminar signalling within a cortical column. J Physiol (Lond) 538:803– 822. Feldmeyer D, Roth A, Sakmann B (2005) Monosynaptic connections between pairs of spiny stellate cells in layer 4 and pyramidal cells in layer 5A indicate that lemniscal and paralemniscal afferent pathways converge in the infragranular somatosensory cortex. J Neurosci 25:3423–3431.
Sato et al. • Excitation Spreads in Barrel and Insular Columns Feldmeyer D, Lubke J, Sakmann B (2006) Efficacy and connectivity of intracolumnar pairs of layer 2/3 pyramidal cells in the barrel cortex of juvenile rats. J Physiol (Lond) 575:583– 602. Frick A, Feldmeyer D, Sakmann B (2007) Postnatal development of synaptic transmission in local networks of L5A pyramidal neurons in rat somatosensory cortex. J Physiol (Lond) 585:103–116. Frick A, Feldmeyer D, Helmstaedter M, Sakmann B (2008) Monosynaptic connections between pairs of L5A pyramidal neurons in columns of juvenile rat somatosensory cortex. Cereb Cortex 18:397– 406. Gray CM, Konig P, Engel AK, Singer W (1989) Oscillatory responses in cat visual cortex exhibit inter-columnar synchronization which reflects global stimulus properties. Nature 338:334 –337. Gustafsson B, Jankowska E (1976) Direct and indirect activation of nerve cells by electrical pulses applied extracellularly. J Physiol (Lond) 258:33– 61. Hanamori T, Kunitake T, Kato K, Kannan H (1998) Responses of neurons in the insular cortex to gustatory, visceral, and nociceptive stimuli in rats. J Neurophysiol 79:2535–2545. Holmgren C, Harkany T, Svennenfors B, Zilberter Y (2003) Pyramidal cell communication within local networks in layer 2/3 of rat neocortex. J Physiol (Lond) 551:139 –153. Kang Y, Notomi T, Saito M, Zhang W, Shigemoto R (2004) Bidirectional interactions between h-channels and Na ⫹-K ⫹ pumps in mesencephalic trigeminal neurons. J Neurosci 24:3694 –3702. Kang Y, Saito M, Sato H, Toyoda H, Maeda Y, Hirai T, Bae YC (2007) Involvement of persistent Na ⫹ current in spike initiation in primary sensory neurons of the rat mesencephalic trigeminal nucleus. J Neurophysiol 97:2385–2393. Katz DB, Nicolelis MA, Simon SA (2002) Gustatory processing is dynamic and distributed. Curr Opin Neurobiol 12:448 – 454. Kosar E, Grill HJ, Norgren R (1986) Gustatory cortex in the rat. I. Physiological properties and cytoarchitecture. Brain Res 379:329 –341. Laaris N, Keller A (2002) Functional independence of layer IV barrels. J Neurophysiol 87:1028 –1034. Laaris N, Carlson GC, Keller A (2000) Thalamic-evoked synaptic interactions in barrel cortex revealed by optical imaging. J Neurosci 20:1529 –1537. Lubke J, Egger V, Sakmann B, Feldmeyer D (2000) Columnar organization of dendrites and axons of single and synaptically coupled excitatory spiny neurons in layer 4 of the rat barrel cortex. J Neurosci 20:5300 –5311. Lubke J, Roth A, Feldmeyer D, Sakmann B (2003) Morphometric analysis of the columnar innervation domain of neurons connecting layer 4 and layer 2/3 of juvenile rat barrel cortex. Cereb Cortex 13:1051–1063. Moore CI, Nelson SB, Sur M (1999) Dynamics of neuronal processing in rat somatosensory cortex. Trends Neurosci 22:513–520. Nakamura T, Ogawa H (1997) Neural interaction between cortical taste neurons in rats: a cross-correlation analysis. Chem Senses 22:517–528. Ogawa H, Ohgushi M, Hasegawa K, Murayama N (1991) Differential development of cortical taste areas in granular and dysgranular insular cortices in rats. Brain Res Dev Brain Res 60:271–274. Ogawa H, Murayama N, Hasegawa K (1992) Difference in receptive field features of taste neurons in rat granular and dysgranular insular cortices. Exp Brain Res 91:408 – 414. Penfield W, Boldrey E (1937) Somatic motor and sensory representation in the cerebral cortex of man as studied by electrical stimulation. Brain 60:389 – 443. Petersen CC, Sakmann B (2000) The excitatory neuronal network of rat layer 4 barrel cortex. J Neurosci 20:7579 –7586. Petersen CC, Sakmann B (2001) Functionally independent columns of rat somatosensory barrel cortex revealed with voltage-sensitive dye imaging. J Neurosci 21:8435– 8446. Roy S, Alloway KD (1999) Synchronization of local neural networks in the somatosensory cortex: a comparison of stationary and moving stimuli. J Neurophysiol 81:999 –1013. Ruggiero DA, Mraovitch S, Granata AR, Anwar M, Reis DJ (1987) A role of insular cortex in cardiovascular function. J Comp Neurol 257:189 –207. Saito M, Murai Y, Sato H, Bae YC, Akaike T, Takada M, Kang Y (2006) Two opposing roles of 4-AP-sensitive K ⫹ current in initiation and invasion of spikes in rat mesencephalic trigeminal neurons. J Neurophysiol 96:1887–1901.
Sato et al. • Excitation Spreads in Barrel and Insular Columns Wang X, Ogawa H (2002) Columnar organization of mechanoreceptive neurons in the cortical taste area in the rat. Exp Brain Res 147:114 –123. Woolsey TA, Van der Loos H (1970) The structural organization of layer IV in the somatosensory region (SI) of mouse cerebral cortex. The description of a cortical field composed of discrete cytoarchitectonic units. Brain Res 17:205–242. Yamamoto T, Matsuo R, Kawamura Y (1980) Localization of cortical gustatory area in rats and its role in taste discrimination. J Neurophysiol 44:440 – 455. Yamamoto T, Azuma S, Kawamura Y (1984) Functional relations between the cortical gustatory area and the amygdala: electrophysiological and behavioral studies in rats. Exp Brain Res 56:23–31. Yamamoto T, Yuyama N, Kato T, Kawamura Y (1985) Gustatory responses
J. Neurosci., March 19, 2008 • 28(12):3076 –3089 • 3089 of cortical neurons in rats. III. Neural and behavioral measures compared. J Neurophysiol 53:1370 –1386. Yamamoto T, Matsuo R, Kiyomitsu Y, Kitamura R (1988) Sensory inputs from the oral region to the cerebral cortex in behaving rats: an analysis of unit responses in cortical somatosensory and taste areas during ingestive behavior. J Neurophysiol 60:1303–1321. Yasui Y, Breder CD, Saper CB, Cechetto DF (1991) Autonomic responses and efferent pathways from the insular cortex in the rat. J Comp Neurol 303:355–374. Yokota T, Satoh T (2001) Three-dimensional estimation of the distribution and size of putative functional units in rat gustatory cortex as assessed from the inter-neuronal distance between two neurons with correlative activity. Brain Res Bull 54:575–584.