Cerebral Cortex October 2012;22:2313– 2321 doi:10.1093/cercor/bhr308 Advance Access publication November 7, 2011
Differential Expression Patterns of Striate Cortex-Enriched Genes among Old World, New World, and Prosimian Primates Toru Takahata1, Rammohan Shukla2,3, Tetsuo Yamamori2,3 and Jon H. Kaas1 1
Department of Psychology, Vanderbilt University, Nashville, TN 37240, USA, 2Division of Brain Biology, National Institute for Basic Biology, Okazaki, Aichi 444-8585, Japan and 3Department of Basic Biology, Graduate University for Advanced Studies (SOKENDAI), Okazaki, Aichi 444-8585, Japan Address correspondence to Toru Takahata, Department of Psychology, Vanderbilt University, PMB 407817, 2301 Vanderbilt Place, Nashville, TN 37240-7817, USA. Email:
[email protected].
A group of 5 genes, OCC1, testican-1, testican-2, 5-HT1B, and 5-HT2A, are selectively expressed in layer 4 (4C of Brodmann) of striate cortex (visual area V1) of both Old World macaques and New World marmoset monkeys. The expression of these genes is activity dependent, as expression is reduced after blocking retinal activity. Surprisingly, the pronounced expression pattern has not been found in rodents or carnivores. Thus, these genes may be highly expressed in V1 of some but perhaps not all primates. Here, we compared the gene expression in members of 3 major branches of primate evolution: prosimians, New World monkeys, and Old World monkeys. Although the expression pattern of 5-HT1B was well conserved, those of the other genes varied from the least distinct in prosimian galagos to successively more in New World owl monkeys, marmosets, squirrel monkeys, and Old World macaque monkeys. In owl monkeys, the expression of 5-HT2A was significantly reduced by monocular tetrodotoxin injection, while those of OCC1 and 5-HT1B were not. Thus, we propose that early primates had low levels of expression and higher levels emerged with anthropoid primates and became further enhanced in the Old World catarrhine monkeys that are more closely related to humans. Keywords: in situ hybridization, monocular inactivation, primate evolution, SPOCK, V1-specific
Introduction Historically, neocortical areas have been seen as varying only slightly in cytoarchitecture, with primary visual cortex (area 17, striate cortex or V1) being one of the most distinct fields, especially in primates (von Economo 1929; Lashley and Clark 1946; Bailey and von Bonin 1951). Thus, Zeki (1978) was able to conclude that it has been ‘‘well known for over 70 years’’ that prestriate cortex of the monkey has a uniform cytoarchitectural appearance. Such uniformity would seem to argue that processing would be much the same across cortical areas and mammalian species, with differences depending largely on differences in anatomical connections. However, the premise of great uniformity in cortical structure has been challenged recently by reports of molecular and cellular differences. The presumption that neuron densities are similar across cortical areas and mammalian species, except for V1 of some primates, no longer holds, as there are considerable variations in neuron densities across cortical areas and species (Collins et al. 2010). Recently, cortical patterns of gene expression have provided another way of characterizing and identifying cortical areas (Yamamori and Rockland 2006). Cortical areas and layers within
areas have been found to differ in patterns of gene expression (Watakabe 2009). The present comparative study involves gene expression in V1 of primates. Through molecular screening, several genes have been found to be preferentially expressed in V1 of macaque monkeys. These genes include those for OCC1, testican-1, and testican-2, which are in the same family of extracellular matrix proteins, and for 5-HT1B and 5-HT2A, which are serotonin receptors (Tochitani et al. 2001; Pierson et al. 2008; Kupers et al. 2009; Takahata et al. 2009; Watakabe et al. 2009). Their expression patterns are quite similar to each other. When in situ hybridization histochemistry (ISH) is used to identify cells that express these genes, a dense band of labeled neurons that is coextensive with layer 4C of Brodmann (1909), layer 4 of Ha¨ssler (1967), and others; see Casagrande and Kaas (1994) for layer numbering. The genes are expressed at very low levels elsewhere. Expression of these genes is activity dependent, as monocular inactivation (MI) with tetrodotoxin (TTX) reduces their mRNA (Takahata et al. 2009; Watakabe et al. 2009). The dense expression of OCC1 in V1 that has been studied in macaques was also observed in marmoset monkeys but not in mice, rabbits, and ferrets (Takahata et al. 2006). Even in huge database, there is no available evidence for any enriched gene expression in V1 in mice and rats, although some genes are preferentially expressed in limbic cortex and other genes in somatosensory cortex (Reinoso et al. 1996; Lein et al. 2007). Thus, it has been assumed that the dense expression of several genes in layer 4 of macaque V1 is a unique feature of primate visual cortex. However, considerable differences in gene expression may exist in V1 across the 15 families, 56 genera, and 203 species of primates that have evolved the last 80 million years or more (Purvis 1995). Early primates, most closely resembling presentday prosimian primates, were nocturnal (Ross and Martin 2007). Subsequently, in the prosimian radiation, galagos and lorises remained nocturnal, while some of the lemurs became diurnal. Anthropoid primates (present-day New World monkeys, Old World monkeys, apes, and humans) formed a diurnal branch of the primate radiation, with only one species, the owl monkey, readapting to nocturnal life. Diurnal monkeys adapted to daytime light levels by losing the reflecting tapetum of the eye, developing a fovea of the retina, and having proportionately more cortex devoted to central vision. Early catarrhine (Old World) monkeys acquired trichromatic vision and thalamic and cortical adaptations mediating detailed, color vision. Some New World monkeys independently acquired trichromatic color vision (Jacobs and Rowe 2004). Considering these variations in
Ó The Authors 2011. Published by Oxford University Press. This is an Open Access article distributed under the terms of the Creative Commons Attribution Non-Commercial License (http://creativecommons.org/licenses/by-nc/3.0), which permits unrestricted non-commercial use, distribution, and reproduction in any medium, provided the original work is properly cited.
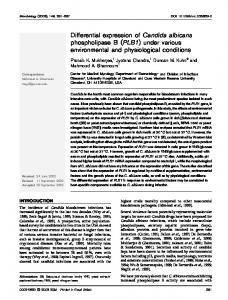
visual adaptations, the macaque pattern of V1-enriched gene expression may not be characteristic of all primates (Fig. 1). To obtain a more comprehensive understanding of gene expression in primate V1, we examined the mRNA expressions of OCC1, testican-1, testican-2, 5-HT1B, and 5-HT2A in galagos, marmosets, squirrel monkeys, and owl monkeys and compared the results with those from macaque monkeys. Materials and Methods The protocols used in this study were approved by the Animal Research Committee of the National Institute for Physiological Sciences, Japan and Animal Care and Use Committee at Vanderbilt University. They are in accordance with the animal care guidelines of the National Institutes of Health, USA. Animals and Sample Preparation Two Japanese macaques (Macaca fuscata, 5--6 kg), 2 marmosets (Callithrix jacchus, 500--600 g), 3 squirrel monkeys (Saimiri sciureus, 800--1000 g), 3 owl monkeys (Aotus trivirgatus, 1000--1200 g), and 2 galagos (Otolemur garnettii, 1000--1200 g) were studied in the current study. All primates were adults. One macaque and 2 of the owl monkeys were monocularly inactivated by TTX treatment. Under ketamine and medetomidine (macaque) or ketamine and isoflurane (owl monkey) anesthesia, 10 lL (4.7 mM, macaque) or 5 lL (1 mM, owl monkey) of TTX was injected into the vitreous cavity of the left eye. The animals were brought back to the normal cage, awoken, and allowed free moving for 24 h. This macaque was the same case as presented in the previous paper (Takahata et al. 2008). Since owl monkeys and galagos are nocturnal, their daytime was reversed in their home cage in animal facility, and they were perfused and fixed in their nighttime. Animals were perfused intracardially with 2--4% paraformaldehyde (PFA) in 0.1 M phosphate buffer (PB). The brain was then removed from the skull, postfixed for 3--6 h in the same fixative, and cryoprotected in 30% sucrose in 0.1 M PB at 4 °C. The frozen blocks were cut into sections on a sliding microtome into 35- to 40-lm thicknesses. The sections were maintained in a cryoprotectant solution (30% glycerol, 30% ethylene glycol, 40% 0.1 M phosphate-buffered saline [PBS]) at –20 °C. Histochemical Procedures For colorimetric ISH, digoxigenin (DIG)-labeled antisense and sense riboprobes were prepared from the plasmids using a DIG-dUTP labeling kit (Roche Diagnostics, Indianapolis, IN). The plasmids with inserts of macaque-specific sequences to each gene are identical to those used in the previous studies (Takahata et al. 2009; Watakabe et al. 2009). The plasmids for macaque 5-HT1Ba, 5-HT1B b and 5-HT2A, and marmoset
Figure 1. Phylogenetic relationship of species. Shaded species are nocturnal. Based on Murphy et al. (2001).
2314 Various V1-Enriched Gene Expression in Primate Species
d
Takahata et al.
5-HT1Ba were prepared and provided by Dr Akiya Watakabe. For other species, parts of each gene were cloned and inserted into plasmid vectors, and species-specific probes were prepared (Table 1). Since we were not able to successfully clone testican-1 in marmoset, squirrel monkeys, or owl monkeys, we used testican-1 probe from macaque cDNA for these species. We also did so for 5-HT2A in squirrel monkeys and owl monkeys. Nonetheless, as homologies of genes among New and Old World monkeys are usually more than 95% (see Table 1) and the staining patterns with such highly homologous probes are indistinguishable from those with species-specific probes in our ISH preparation, we regard that their staining patterns with macaque probes are highly specific to each gene. The sense probes detected no signals stronger than background. ISH was carried out as described previously (Takahata et al. 2006). Briefly, free-floating sections were soaked in 4% PFA/0.1 M PB (pH 7.4) overnight at 4 °C and treated with 10 lg/mL proteinase K for 30 min at 37 °C. After acetylation, the sections were incubated in hybridization buffer (53standard saline citrate [SSC: 150 mM NaCl, 15 mM Na citrate, pH 7.0], 50% formamide, 2% blocking reagent [Roche Diagnostics], 0.1% N-lauroylsarcosine [NLS], 0.1% sodium dodecyl sulfate, 20 mM maleic acid buffer; pH 7.5) containing 1.0 lg/mL DIG-labeled riboprobe at 60--65 °C overnight. Hybridized sections were washed by successive immersion in wash buffer 1 (23SSC, 50% formamide, 0.1% NLS; 60--65 °C, 20 min, twice), RNase A buffer (10 mM Tris--HCl, 1 mM ethylenediamine-N,N,N’,N’-tetraacetic acid, 500 mM NaCl; pH 8.0) containing 20 lg/mL RNase A (37 °C, 15--30 min), 23SSC/0.1% NLS (37 °C, 20 min, twice) and 0.23SSC/0.1% NLS (37 °C, 15 min, twice). Hybridization signals were visualized by alkaline phosphatase immunohistochemical staining using a DIG detection kit (Roche Diagnostics). Sections were mounted onto glass slides, dehydrated through a graded series of increasing ethanol concentrations followed by xylene, and then coverslipped with Permount. For architectonically identifying V1 and its laminar structure, one set of brain sections was processed for cytochrome oxidase (CO) (Wong-Riley 1979) and another set was stained for Nissl substance.
Results Gene expression varied in intensity and laminar pattern across the species tested. We recruit Ha¨ssler’s scheme of the V1 layering (Ha¨ssler 1967) and give Brodmann’s layers in parenthesis in this document. A common observation in V1 was that genes were densely expressed in layer 4 (4C). Often it was also apparent that the density was greater in inner layer 4 (4Cb) than in outer layer 4 (4Ca).
Expression of V1-Enriched Genes Is Prominent in Macaques As reported previously (Takahata et al. 2009; Watakabe et al. 2009), mRNAs of OCC1, testican-1, testican-2, 5-HT1B, and 5-HT2A are preferentially expressed in V1 of macaque monkeys (Fig. 2). Their expression patterns were basically similar to each other. Layer 4 (4C) of V1, especially 4b (4Cb), was most densely labeled by ISH for them. Layers 3Bb (4A) also showed dense expression of them. OCC1, testican-1, and testican-2 mRNA signals were also densely observed in layers 2/3, while 5-HT1B and 5-HT2A mRNA signals were light in the superficial and infragranular layers. In the extrastriate cortex, OCC1, testican-1, and testican-2 mRNA was expressed in layer 3B and this expression was decreased along the visual ventral pathway. After MI treatment by TTX injection, mRNA expression of OCC1, 5-HT1B, and 5-HT2A was dramatically decreased in the corresponding ocular dominance columns to the inactivated eye. Expression of testican-1 and testican-2 mRNAs is also moderately decreased after MI (Takahata et al. 2009).
Table 1 Summary of ISH probes prepared for each gene and species
OCC1a
OCC1b
testican-1
testican-2
5-HT1Ba
5-HT1Bb
5-HT2A
Macaque
Marmoset
Squirrel monkey
Owl monkey
Galago
F: GCCAATGTGTTTTGTGGAGC R: TTGATGGCAGTTTCATTCTG T: 188-593 of AB039661 L: 406 base H: 100%
Primers are the same as macaque’s
Primers are the same as macaque’s
Primers are the same as macaque’s
Primers are the same as macaque’s
L: 406 base H: 97.3%
L: 406 base H: 97.3%
L: 406 base H: 96.8%
L: 406 base H: 94.6%
F: GCAGATCAGGAGAACAACAA R: TCTTGGTCTTTTCAGCTGT T: 647-959 of AB039661 L: 313 base H: 100%
Primers are the same as macaque’s
Primers are the same as macaque’s
Primers are the same as macaque’s
Primers are the same as macaque’s
L: 313 base H: 92.3%
L: 313 base H: 95.5%
L: 313 base H: 95.5%
L: 313 base H: 96.2%
F: GCCTGAGCCACCAAAGCACA R: TTGGTCCCAGCTCCCGTTCA T: 732-1356 OF XM_00106476 L: 625 base H: 100%
Not available
Not available
Not available
Primers are the same as macaque’s
F: ACCCCCGGCAATTTCATGGA R: AGAAGCAGAAGCACCACTCA T: 559-1338 OF XM_001105299 L: 780 base H: 100%
Primers are the same as macaque’s
Primers are the same as macaque’s
Primers are the same as macaque’s
Primers are the same as macaque’s
L: 780 base H: 96.9%
L: 780 base H: 97.2%
L: 780 base H: 96.7%
L: 780 base H: 91.0%
F: TCCTCTACACGGTCTACTCC R: CAAGTACTGCCAGGCTGTATGT T: 1194-2136 of XM_001113679 L: 943 base H: 100%
Primers are the same as macaque’s
Primers are the same as macaque’s
Primers are the same as macaque’s
Primers are the same as macaque’s
L: 937 base H: 96.1%
L: 942 base H: 95.8%
L: 942 base H: 96.2%
L: 935 base H: 86.1%
F: ACTGCTGGTTATGCTACTGG R: TAGCCTGACGCCAGAAGAAG T: 727-1108 of XM_001113679 L: 382 base H: 100%
F: TATTGGCGCTCATCACCTTG R: TAGCCTGACGCCAGAAGAAG T: 741-1108 of XM_001113679 L: 368 base H: 97.3%
F: ACATTACCAGGACTCCATC R: TAGCCTGACGCCAGAAGAAG T: 690-1108 of XM_00113679 L: 419 base H: 98.1%
Primers are the same as squirrel monkey’s
Primers are the same as squirrel monkey’s
L: 419 base H: 98.1%
L: 419 base H: 90.0%
F: GCTCAACTACGAACTCCCTAAT R: AGTAGCTTCTTTCTGGAGTGAC T; 67-786 of NM_001032966 L: 720 base H: 100%
F: CTGGACCGCTACGTTGCCATCC R: CGATAGGTCTTGTTGAACATCC T; 543-1151 of NM_001032966 L: 609 base H: 95.4%
Not available
Not available
Primers are the same as macaque’s
L: 625 base H: 93.4%
L: 720 base H: 94.3%
Note: For OCC1 and 5-HT1B, 2 kinds of probes (a and b) were separately prepared and mixed to enhance the signals. Unfortunately, testican-1 gene of marmoset, squirrel monkey and owl monkey, and 5HT2A gene of squirrel money and owl money were not successfully cloned; therefore, the probes for the macaque sequence were used for ISH of these genes. F and R means nucleotide sequences of the forward and reverse primers, respectively, that were used to clone the gene. T means targeted nucleotide sequence of the gene in reference of the accession number in NCBI database. L means actual length of the cloned nucleotide sequence except primers. H means homology of probes to the identical portion of macaque sequence, which is highlighted by bold.
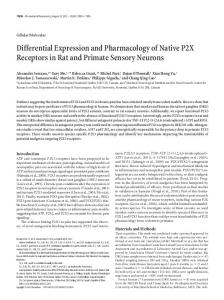
Figure 2. Coronal sections of ISH for V1-enriched genes in macaque V1 and V2. A--C are adjacent sections for OCC1 (A), testican-1, (B), or testican-2 (C) in the visually intact macaque. D--F are adjacent sections for OCC1 (D), 5-HT1B (E), or 5-HT2A (F) in the monocularly inactivated (for 24 h) macaque. Distinct area-selective and activity-dependent expression was observed. V1/V2 boundary is indicated by black arrowheads. A white asterisk indicates layer 4 (4C of Brodmann), and white arrow indicates layer 3Bb (4A) of V1. A black asterisk indicates layer 3B of V2. Open arrows indicate the downregulation of gene expression in inactivated ocular dominance columns of V1. Scale bar 5 1 mm.
Cerebral Cortex October 2012, V 22 N 10
2315
Expression of V1-Enriched Genes in New World monkeys Is Moderate but Similar to Macaques Marmosets We have previously reported that the expression pattern of OCC1 mRNA is preserved between macaques and marmosets (Takahata et al. 2006). Additionally, we examined ISH for 4 other V1-enriched genes, besides OCC1, in marmosets. All of these 5 genes exhibited dense band in layer 4 (4C) (Fig. 3), the same portion as the dense CO band. This band abruptly ended at the V1/V2 boundary. These bands of their expression were, however, not as prominent compared with macaques, especially for OCC1. The expression in layer 4b (4Cb) was almost comparable to that in layer 4a (4Ca), except 5-HT1B mRNA expression that showed denser signals in layer 4b (4Cb) than in layer 4a (4Ca). Layer 3Bb (4A) did not show particular signals compared with other layers. In addition, characteristic expression in layer 3B of V2 was hardly observed, and there was no apparent area difference among extrastriate visual cortices and temporal areas (TEs).
Squirrel Monkeys The dense expression of these 5 genes in layer 4 (4C) of V1 was obviously observed in squirrel monkeys (Fig. 4). Overall expression patterns were intermediate between macaques and marmosets, that is, signals in layer 4b (4Cb) were slightly denser than those in layer 4a (4Ca). Signals were moderately localized in layer 3Bb (4A). The V1/V2 boundary was clear-cut by these signals. Additionally, expression of OCC1-related genes (OCC1, testican-1, and testican-2) in layer 3B of extrastriate cortex was moderately observed and it decreased along the visual ventral pathway.
Owl Monkeys The dense bands of layer 4 (4C) of ISH signals for V1-enriched genes were observed, and V1/V2 boundary was apparent in this owl monkey (Fig. 5). However, the intensity of the bands was moderate in ISH for OCC1 and 5-HT2A. Difference in their expression between layers 4a (4Ca) and 4b (4Cb) was small as in marmosets. Their expression in layer 3Bb (4A) was slightly seen. V1-Enriched Expression Is Little in Prosimian galagos Consistent to the CO dense band in layer 4 (4C) of V1, 5-HT1B mRNA expression was clearly observed in galagos (Fig. 6F). Of the remaining 4 genes, testican-1 mRNA signals were also discernable in layer 4 (4C) of V1 (Fig. 6D). However, OCC1, testican-2, or 5-HT2A mRNA signals showed almost no preference in the layer or V1 (Fig. 6C,E,G). As reported, layer 3Bb (4A) did not exist in this species. V2 did not show the characteristic gene expression in layer 3B either. This observation was not likely an artifact due to dull ISH labeling, as neurons were labeled intensely without little any layer/area preference, and the staining was much denser than the negative control using sense probes, when they were observed in higher magnification (Fig. 6H--J) Only 5-HT2A Gene Expression Is Activity Dependent in Owl Monkeys We performed MI in 2 owl monkeys for 24 h in order to address if the expression of the V1-enriched genes is dependent on visual activity. Although traditional methods of revealing ocular dominance columns by injecting a transneuronal tracer indicated that the projections from dorsal lateral geniculate nucleus layers for each eye overlap in layer 4 (4C) of V1 of owl monkeys (Kaas et al. 1976), evidence for functional ocular
Figure 3. Coronal sections of ISH for V1-enriched genes in visually intact marmoset V1 and V2. (A, B) V1/V2 boundary in sections stained for Nissl substance (A) or CO activity (B) to illustrate the architecture; (C--G) Adjacent sections of A and B stained for OCC1 (C), testican-1 (D), testican-2 (E), 5-HT1B (F), or 5-HT2A (G). Their expression was greater in V1 compared with other areas but not as distinct as in macaques. V1/V2 boundaries are indicated by black arrowheads. A black asterisk indicates layer 4 (4C) of V1. Scale bar 5 1 mm; (H--J) Higher magnification of OCC1 mRNA signals in V1 (H, I) and V2 (J). The section in H is stained with the sense probe as a negative control. Scale bar 5 200 lm.
2316 Various V1-Enriched Gene Expression in Primate Species
d
Takahata et al.
Figure 4. Coronal sections of ISH for V1-enriched genes in visually intact squirrel monkey V1 and V2. (A, B) V1/V2 boundary stained for Nissl substance (A) or CO activity (B); (C--G) Adjacent sections of A and B stained for OCC1 (C), testican-1 (D), testican-2 (E), 5-HT1B (F), or 5-HT2A (G). Their expression is densest in V1, slightly more distinctly than in marmosets. V1/V2 boundaries are indicated by black arrowheads. A white asterisk indicates layer 4 (4C), and a black arrow indicates layer 3Bb of V1. A black asterisk indicates layer 3B of V2. Scale bar 5 1 mm; (H--J) Higher magnification of OCC1 mRNA signals in V1 (H, I) and V2 (J). The section in H is stained with the sense probe. Scale bar 5 200 lm.
Figure 5. Coronal sections of ISH for V1-enriched genes in visually intact owl monkey V1 and V2. (A, B) V1/V2 boundary stained for Nissl substance (A) or CO activity (B); (C--G) V1/V2 boundary stained for OCC1 (C), testican-1 (D), testican-2 (E), 5-HT1B (F), or 5-HT2A (G). Their expression is greatest in V1, but OCC1 and 5-HT2A expression was relatively moderate. V1/V2 boundaries are indicated by black arrowheads. A black asterisk indicates layer 4 (4C) of V1. Scale bar 5 1 mm; (H--J) Higher magnification of OCC1 mRNA signals in V1 (I) and V2 (J). The section in H is stained with the sense probe of 5-HT1B. Scale bar 5 200 lm.
dominance columns in V1 of owl monkeys was recently obtained by optically imaging cortical responses (Kaskan et al. 2007). Accordingly, this study of gene expression also revealed alternating ocular dominance columns. As a result of MI, the reduction of 5-HT2A mRNA expression was observed in
column-like pattern as in macaques (Fig. 7C,F). However, MI did not apparently influence the mRNA expression of OCC1 or 5-HT1B (Fig. 7A,B,D,E). The expression of testicans was not examined in these cases as their activity dependence is moderate even in macaques. Cerebral Cortex October 2012, V 22 N 10
2317
Figure 6. Coronal sections of ISH for V1-enriched genes in visually intact galago V1 and V2. (A, B) V1/V2 boundary stained for Nissl substance (A) or CO activity (B); (C--G) Adjacent sections of A and B stained for OCC1 (C), testican-1 (D), testican-2 (E), 5-HT1B (F), or 5-HT2A (G). 5-HT1B mRNA was abundantly expressed in V1, but the expression of other 4 genes was no higher or slightly higher in V1, distinct from anthropoid primate species. V1/V2 boundaries are indicated by black arrowheads. Black asterisks indicate layer 4 (4C) of V1. Scale bar 5 1 mm; (H--J) Higher magnification of OCC1 mRNA signals in V1 (H, I) and V2 (J). The section in H is stained with the sense probe. Scale bar 5 200 lm.
Figure 7. Coronal sections of ISH for V1-enriched genes in monocularly inactivated (for 24 h) owl monkeys. A--C are adjacent sections from one case, and D--F are from another case stained for OCC1 (A and D), 5-HT1B (B and E), or 5-HT2A (C and F). The reduction of mRNA expression of 5-HT2A was observed in the postulated inactivated ocular dominance columns in V1 but not for OCC1 or 5-HT1B. V1/V2 boundary is indicated by black arrowheads. Open arrows indicate the downregulation of gene expression in inactivated ocular dominance columns of V1. Scale bars 5 1 mm.
Discussion The present study was motivated by the observations that a handful of genes, those for OCC1, testican-1, testican-2, 5-HT1B, and 5-HT2A, are overexpressed in V1 of macaque 2318 Various V1-Enriched Gene Expression in Primate Species
d
Takahata et al.
monkeys (Takahata et al. 2009; Watakabe et al. 2009) but not in the rodents, lagomorphs, or carnivores examined so far (Takahata et al. 2006). These observations raise the obvious questions of whether the gene expression pattern of V1 of macaques is shared by other primates or specific to only a few.
The overall results indicate that the overexpression in V1 of these genes is variable in magnitude across primate species, and it can be regarded as a specialization of V1 that is more pronounced in some primates than others. Factors which were likely important in the evolution of this specialization are considered below. Finally, it is quite clear that the expression of the 5 genes under study here is activity dependent in macaques, as blocking the retinal activity of one eye with TTX dramatically reveals ocular dominance columns in V1 as bands of decreased expression of the genes for the blocked eye (see Fig. 2) (Takahata et al. 2009). Here, we evaluated the results of blocking one eye of an owl monkey on gene expression. Surprisingly, we found that the expression of one gene was reduced by the blocking of retinal activity, while other genes were not. These issues are discussed below.
Cross-species Comparison of Gene Expression If one considers the overall density of the overexpression of genes in V1 of the primates studied here, the greatest overexpression occurred in macaque monkeys, which are Old World monkeys. Of the 3 New World monkeys studied here, all had less overexpression than macaque monkeys, but this expression varied in magnitude so that squirrel monkeys had the most, marmosets had less, and owl monkeys had the least. Prosimian galagos had overexpression of 5-HT1B in V1 but little for the other 4 genes. As mentioned above, OCC1 has been shown to not be preferentially expressed in V1 of mice, rabbits, or ferrets. In addition, 5-HT1B and 5-HT2A are not over expressed in V1 of rats or ferrets (A Watakabe, personal communication). On the other hand, it has been suggested that testican-1 mRNA and 5-HT1B receptor are preferentially localized in the occipital lobe of humans as well as macaques (Marr et al. 2000; Pierson et al. 2008). There are several possible interpretations of these observations. First, the pattern of over expression can reflect mammalian phylogeny (Fig. 1). Rodents and lagomorphs constitute wellstudied relatives of primates in the euarchontoglires clade of mammalian evolution (Asher and Helgen 2010). From the negative results on mice, rats, and rabbits, as well as the more distantly related ferrets, we can surmise that the overexpression of the 5 studied genes in V1 arose in primates and was not present in the common ancestor of primates and rodents or in the more distant ancestors leading to carnivores. As these genes are variably and at best weakly overexpressed in prosimian galagos, and present-day prosimians represent an early branch of the primate radiation, early primates had at best only a slight overexpression of these genes. Next, the early anthropoid primates, before the separation of New and Old World monkeys, had moderate overexpression that varied within the radiation of New World monkeys but became pronounced in Old World monkeys. As early Old World monkeys lead to apes and apes lead to humans, we would predict that an overexpression of these genes exists in apes and humans. Other interpretations of the pattern of over expression are less attractive but possible. Early primates were nocturnal, and galagos and most other prosimians have remained nocturnal. Laboratory rats, mice, and ferrets can be considered nocturnal. Thus, the lack or near lack of gene overexpression in these mammals could reflect their shared nocturnal life style, and the overexpression of these genes in monkeys could reflect their diurnal life style. Early anthropoid primates (monkeys) were
diurnal and only owl monkeys have reverted to the nocturnal life of early primates. Owl monkeys perhaps have a reduced overexpression of the 5 genes as a partial readaptation to nocturnal living. A third possibility is that the amount of overexpression reflects the sizes of V1, which is small in rats and mice, larger in galagos, larger yet in marmosets, owl monkeys, and especially squirrel monkeys and much larger in macaques (Herculano-Houzel 2009). As cortical areas get larger, they get more neurons and these neurons are interconnected with proportionately fewer other neurons in the area, altering the functions of the area (Kaas 2000). The amount of overexpression could reflect modification due to the size of brains and V1. Of course, there can be more than one factor influencing the gene expression, which, after all, is activity dependent. The overall phylogenetic model may hold, but with modifications related to nocturnality or diurnality, to the size of V1, and possibly other factors. More species of primates and other mammals need to be studied to provide a better understanding. Activity-Dependent Expression in Owl Monkeys It is noteworthy that in owl monkey cases, the downregulation of mRNA expression was not observed for OCC1 or 5-HT1B after MI for 24 h, while it was for 5-HT2A. In addition, 5-HT2A mRNA was significantly reduced after MI but not strongly expressed in V1, while 5-HT1B mRNA was strongly expressed in V1 but not reduced after MI. OCC1 mRNA was neither strongly expressed in V1 nor reduced after MI. This seems quite different from the observations in macaques where all the identified V1-enriched genes are significantly reduced 24 h after the onset of MI (Takahata et al. 2009; Watakabe et al. 2009). Whereas further investigation is needed shifting MI duration and MI method, to determine whether the expression of OCC1 or 5-HT1B is truly activity independent in owl monkeys, V1-selective and activitydependent expression are apparently independent each other. In other words, the transcriptional elements for area selectivity and activity dependence are likely separated in the genome. In addition, although OCC1 gene is a family of testican-1 and testican-2 genes, and 5-HT1B gene is related to 5-HT2A gene, each gene has likely acquired such elements independently. It was intriguing that OCC1 mRNA expression was temporarily upregulated after MI in mouse V1 (Takahata et al. 2008). It seems that transcriptional regulatory regions for these genes are quite changeable over time. This owl monkey data suggests the importance of future studies designed to identify the kinds of changes of transcriptional regulation that occurred to allow genes to be preferentially expressed in V1 in an activity-dependent manner. Functional Significance Our research of area-selective gene expression is consistent with other studies of cortical areas in many aspects. V1-enriched genes are densely expressed in the primary somatosensory cortex (S1) and the primary auditory cortex (A1), as well as in V1 in macaques (Tochitani et al. 2001; Takahata et al. 2006; Watakabe et al. 2009). Several studies have shown that S1, A1, and V1 share similar characteristics. Primary sensory areas, especially V1, mature first and do not enlarge extensively after birth, while association areas greatly expand (Hill et al. 2010). As cortical neurogenesis does not occur after birth (Rakic 1977), this expansion of association areas is supposedly based on elaborations Cerebral Cortex October 2012, V 22 N 10
2319
of dendrites and axons and the maturation of synapses, spines, and white matter (Barone et al. 1995). Consequently, primary sensory areas have relatively small dendritic and axon fields, less dendritic complexity, less synaptic density, less spine number, and less cortical thickness, while they have denser populations of neurons (Elston et al. 1999; Tanigawa et al. 2005; Collins et al. 2010). V1 characteristically has a high density of neurons as a result of having smaller layer 4 neurons (von Economo 1929) and layer 3 pyramidal neurons (Elston and Rosa 1998). This sort of differences across areas is the most pronounced in Old World monkeys (catarrhines), the second most in New World monkeys (platyrrhines), and the least in prosimians (strepsirrhines) (Elston et al. 2005; Collins et al. 2010). The number of cortical visual areas may be greater in Old World monkeys so each area is more specialized (Kaas 1989). Accordingly, the difference of gene expression patterns across areas is more prominent in macaques than any other species tested. Taken together, V1-enriched genes may provide the molecular basis for some of the morphological differences across areas. More specifically, they may constrain the expansion of the cortical circuitry in layers with thalamic inputs where they are strongly expressed. In fact, it has been shown that the protein products of testican-1 and testican-2 inhibit neurite extension in vitro (Marr and Edgell 2003; Schnepp et al. 2005). Follistatin-like 1 (FSTL1) protein, a mouse ortholog of OCC1, antagonizes the function of certain morphogenetic factor, BMP4, in the developmental stage in other organs, such as lung (Geng et al. 2011). The regulation of neurite morphology should be important, even at the systems level. It is in agreement that there is a morphological and biochemical gradient along the occipitotemporal visual pathway from V1, through V2, V3, V4, TEO down to the TE in the macaque. The dendritic field of pyramidal neurons becomes more expanded in higher visual areas along the pathway (Elston and Rosa 1997). This is supposedly related to the successive increase of receptive field size in these visual areas: The receptive field size is small in V1 neurons, but visual information is integrated and merged to make larger receptive fields as the hierarchy progresses (Van Essen and Gallant 1994). Since the expression of OCC1-related genes in layer 3 becomes weaker along the occipitotemporal pathway (Takahata et al. 2009), they may less effectively suppress the expansion of dendrites to allow successively longer dendritic arbors and larger receptive fields. It is also possible that OCC1-related genes regulate electrophysiological activity of neurons. Recently, Li et al. (2011) demonstrated that OCC1/FSTL1 regulates synaptic activity through activation of Na+-K+-ATPase. They showed its role in inhibiting hypersensitivity of somatic sensation in the dorsal root ganglia. They also showed that OCC1/FSTL1 protein is released from the vesicles in the axon terminal in a neuronal activity-dependent manner. If this behavior is common to primate V1, visual activity may stimulate both the mRNA expression and protein secretion of OCC1, and the protein may suppress hypersensitivity of layer 2/3 neurons of V1, where axon terminals from layer 4 neurons are located, especially in species with higher visual acuity. Notably, OCC1/ FSTL1 mRNA expression is not driven by neuronal activity in mice (Takahata et al. 2008). More presumably, serotonin receptors may have physiological roles, such as refinement of signal-to-noise ratio and gain control, in sensory areas as suggested previously (Watakabe 2320 Various V1-Enriched Gene Expression in Primate Species
d
Takahata et al.
et al. 2009). Since 5-HT1B mRNA expression is dependent on neuronal activity in macaques, but not in owl monkeys, macaques may be able to refine sensory signals more than owl monkeys. Overall, we suggest here that V1-enriched gene expression has become more prominent in more visually advanced primates as visual cortex has expanded and fractionated into multiple specialized areas during evolution. Areal differences in gene expression may provide molecular basis for the morphological and physiological differences across cortical areas. Funding National Institutes of Health (grant R01EY002686 to J.H.K.); ‘‘Scientific Research on Innovative Areas (Neocortical Organization)’’ and ‘‘Strategic Research Program for Brain Sciences (Highly Creative Animal Model Development for Brain Science)’’ from the Ministry of Education, Culture, Sports, Science and Technology of Japan (to T.Y.); postdoctoral fellowships for research abroad from Uehara Memorial Foundation, Naito Foundation, and Japan Society for the Promotion of Science (to T.T.). Notes We thank to Dr David J. Calkins, Vanderbilt University, for the use of his laboratory facilities. We also thank Laura E. Trice and Mary R. Feurtado for technical assistance. We further thank Dr Akiya Watakabe, the National Institute for Basic Biology, for his gift of plasmids for 5-HT receptor genes. Conflict of Interest : None declared.
References Asher RJ, Helgen KM. 2010. Nomenclature and placental mammal phylogeny. BMC Evol Biol. 10:102. Bailey P, von Bonin G. 1951. The isocortex of man. Urbana (IL): The University of Illinois Press. Barone P, Dehay C, Berland M, Bullier J, Kennedy H. 1995. Developmental remodeling of primate visual cortical pathways. Cereb Cortex. 5: 22--38. Brodmann L. 1909. Vergleichende localisationslehre der grosshirnrinde in ihren prinzipien dargestellt auf grund des zel lenbaues. Leipzig (Germany): Barth. Casagrande VA, Kaas JH. 1994. The afferent, intrinsic, and efferent connections of primary visual cortex in primates. In: Peters A, Rockland KS, editors. Cerebral cortex. New York: Plenum Press. p. 201--259. Collins CE, Airey DC, Young NA, Leitch DB, Kaas JH. 2010. Neuron densities vary across and within cortical areas in primates. Proc Natl Acad Sci U S A. 107:15927--15932. Elston GN, Elston A, Kaas JH, Casagrande V. 2005. Regional specialization in pyramidal cell structure in the visual cortex of the galago: an intracellular injection study of striate and extrastriate areas with comparative notes on new world and old world monkeys. Brain Behav Evol. 66:10--21. Elston GN, Rosa MG. 1997. The occipitoparietal pathway of the macaque monkey: comparison of pyramidal cell morphology in layer III of functionally related cortical visual areas. Cereb Cortex. 7:432--452. Elston GN, Rosa MG. 1998. Morphological variation of layer III pyramidal neurones in the occipitotemporal pathway of the macaque monkey visual cortex. Cereb Cortex. 8:278--294. Elston GN, Tweedale R, Rosa MG. 1999. Cellular heterogeneity in cerebral cortex: a study of the morphology of pyramidal neurones in visual areas of the marmoset monkey. J Comp Neurol. 415:33--51. Geng Y, Dong Y, Yu M, Zhang L, Yan X, Sun J, Qiao L, Geng H, Nakajima M, Furuichi T, et al. 2011. Follistatin-like 1 (Fstl1) is a bone morphogenetic protein (BMP) 4 signaling antagonist in controlling mouse lung development. Proc Natl Acad Sci U S A. 108:7058--7063. Ha¨ssler R. 1967. Comparative anatomy in the central visual systems in day- and night-active primates. In: Hassler R, Stephan H, editors. Evolution of the forebrain. Stuttgart (Germany): Thieme. p. 419--434.
Herculano-Houzel S. 2009. The human brain in numbers: a linearly scaled-up primate brain. Front Hum Neurosci. 3:31. Hill J, Inder T, Neil J, Dierker D, Harwell J, Van Essen D. 2010. Similar patterns of cortical expansion during human development and evolution. Proc Natl Acad Sci U S A. 107:13135--13140. Jacobs GH, Rowe MP. 2004. Evolution of vertebrate colour vision. Clin Exp Optom. 87:206--216. Kaas J. 1989. Why does the brain have so many visual areas? J Cogn Neurosci. 1:121--135. Kaas J. 2000. Why is brain size so important: design problems and solutions as neocortex gets bigger or smaller. Brain Mind. 1:7--23. Kaas JH, Lin CS, Casagrande VA. 1976. The relay of ipsilateral and contralateral retinal input from the lateral geniculate nucleus to striate cortex in the owl monkey: a transneuronal transport study. Brain Res. 106:371--378. Kaskan PM, Lu HD, Dillenburger BC, Roe AW, Kaas JH. 2007. Intrinsic-signal optical imaging reveals cryptic ocular dominance columns in primary visual cortex of New World owl monkeys. Front Neurosci. 1:67--75. Kupers R, Frokjaer VG, Naert A, Christensen R, Budtz-Joergensen E, Kehlet H, Knudsen GM. 2009. A PET [18F]altanserin study of 5-HT2A receptor binding in the human brain and responses to painful heat stimulation. Neuroimage. 44:1001--1007. Lashley KS, Clark G. 1946. The cytoarchitecture of the cerebral cortex of Ateles; a critical examination of architectonic studies. J Comp Neurol. 85:223--305. Lein ES, Hawrylycz MJ, Ao N, Ayres M, Bensinger A, Bernard A, Boe AF, Boguski MS, Brockway KS, Byrnes EJ, et al. 2007. Genome-wide atlas of gene expression in the adult mouse brain. Nature. 445:168--176. Li KC, Zhang FX, Li CL, Wang F, Yu MY, Zhong YQ, Zhang KH, Lu YJ, Wang Q, Ma XL, et al. 2011. Follistatin-like 1 suppresses sensory afferent transmission by activating Na+, K+-ATPase. Neuron. 69:974--987. Marr HS, Basalamah MA, Bouldin TW, Duncan AW, Edgell CJ. 2000. Distribution of testican expression in human brain. Cell Tissue Res. 302:139--144. Marr HS, Edgell CJ. 2003. Testican-1 inhibits attachment of Neuro-2a cells. Matrix Biol. 22:259--266. Murphy WJ, Eizirik E, Johnson WE, Zhang YP, Ryder OA, O’Brien SJ. 2001. Molecular phylogenetics and the origins of placental mammals. Nature. 409:614--618. Pierson ME, Andersson J, Nyberg S, McCarthy DJ, Finnema SJ, Varnas K, Takano A, Karlsson P, Gulyas B, Medd AM, et al. 2008. [11C] AZ10419369: a selective 5-HT1B receptor radioligand suitable for positron emission tomography (PET). Characterization in the primate brain. Neuroimage. 41:1075--1085. Purvis A. 1995. A composite estimate of primate phylogeny. Philos Trans R Soc Lond B Biol Sci. 348:405--421. Rakic P. 1977. Prenatal development of the visual system in rhesus monkey. Philos Trans R Soc Lond B Biol Sci. 278:245--260.
Reinoso BS, Pimenta AF, Levitt P. 1996. Expression of the mRNAs encoding the limbic system-associated membrane protein (LAMP): I. Adult rat brain. J Comp Neurol. 375:274--288. Ross CF, Martin RB. 2007. The role of vision in the origin and evolution of primates. In: Kaas JH, Preuss TM, editors. Evolution of nervous systems. London: Elsevier. p. 59--78. Schnepp A, Komp Lindgren P, Hulsmann H, Kroger S, Paulsson M, Hartmann U. 2005. Mouse testican-2. Expression, glycosylation, and effects on neurite outgrowth. J Biol Chem. 280:11274--11280. Takahata T, Hashikawa T, Higo N, Tochitani S, Yamamori T. 2008. Difference in sensory dependence of occ1/Follistatin-related protein expression between macaques and mice. J Chem Neuroanat. 35:146--157. Takahata T, Komatsu Y, Watakabe A, Hashikawa T, Tochitani S, Yamamori T. 2006. Activity-dependent expression of occ1 in excitatory neurons is a characteristic feature of the primate visual cortex. Cereb Cortex. 16:929--940. Takahata T, Komatsu Y, Watakabe A, Hashikawa T, Tochitani S, Yamamori T. 2009. Differential expression patterns of occ1related genes in adult monkey visual cortex. Cereb Cortex. 19: 1937--1951. Tanigawa H, Wang Q, Fujita I. 2005. Organization of horizontal axons in the inferior temporal cortex and primary visual cortex of the macaque monkey. Cereb Cortex. 15:1887--1899. Tochitani S, Liang F, Watakabe A, Hashikawa T, Yamamori T. 2001. The occ1 gene is preferentially expressed in the primary visual cortex in an activity-dependent manner: a pattern of gene expression related to the cytoarchitectonic area in adult macaque neocortex. Eur J Neurosci. 13:297--307. Van Essen DC, Gallant JL. 1994. Neural mechanisms of form and motion processing in the primate visual system. Neuron. 13:1--10. von Economo C. 1929. The cytoarchitectonics of the human cortex. London: Oxford University Press. Watakabe A. 2009. Comparative molecular neuroanatomy of mammalian neocortex: what can gene expression tell us about areas and layers? Dev Growth Differ. 51:343--354. Watakabe A, Komatsu Y, Sadakane O, Shimegi S, Takahata T, Higo N, Tochitani S, Hashikawa T, Naito T, Osaki H, et al. 2009. Enriched expression of serotonin 1B and 2A receptor genes in macaque visual cortex and their bidirectional modulatory effects on neuronal responses. Cereb Cortex. 19:1915--1928. Wong-Riley M. 1979. Changes in the visual system of monocularly sutured or enucleated cats demonstrable with cytochrome oxidase histochemistry. Brain Res. 171:11--28. Yamamori T, Rockland KS. 2006. Neocortical areas, layers, connections, and gene expression. Neurosci Res. 55:11--27. Zeki SM. 1978. The third visual complex of rhesus monkey prestriate cortex. J Physiol. 277:245--272.
Cerebral Cortex October 2012, V 22 N 10
2321