EXCLI Journal 2018;17:1090-1100 – ISSN 1611-2156 Received: September 26, 2018, accepted: October 31, 2018, published: November 08, 2018
Original article: DIFFERENTIAL PATTERN OF BRAIN FUNCTIONAL CONNECTOME IN OBSESSIVE-COMPULSIVE DISORDER VERSUS HEALTHY CONTROLS Saeid Yazdi-Ravandi1, Hassan Akhavanpour2, Farshid Shamsaei1, Nasrin Matinnia3, Mohammad Ahmadpanah1, Ali Ghaleiha1**, Reza Khosrowabadi2* 1 2 3
Behavioral Disorders and Substance Abuse Research Center, Hamadan University of Medical Sciences, Hamadan, Iran Institute for Cognitive and Brain Sciences, Shahid Beheshti University GC, Tehran, Iran Department of Nursing, College of Basic Science, Hamadan Branch, Islamic Azad University, Hamadan, Iran Corresponding authors: * PhD, Assistant Professor of Computational Modeling, Institute for Cognitive and Brain Sciences, Shahid Beheshti University, Evin Sq., Tehran 19839-63113, Iran, Tel: +98(0)9101738501, E-mail:
[email protected] ** MD, Professor of Psychiatry, Behavioral Disorders and Substance Abuse Research Center, Hamadan University of Medical Sciences, Hamadan, Iran, Tel & Fax: +988138271066, E-mail:
[email protected]
http://dx.doi.org/10.17179/excli2018-1757 This is an Open Access article distributed under the terms of the Creative Commons Attribution License (http://creativecommons.org/licenses/by/4.0/).
ABSTRACT Researchers believe that recognition of functional impairment in some of brain networks such as frontal-parietal, default mode network (DMN), anterior medial prefrontal cortex (MPFC) and striatal structures could be a beneficial biomarker for diagnosis of obsessive-compulsive disorder (OCD). Although it is well recognized brain functional connectome in OCD patients shows changes, debate still remains on characteristics of the changes. In this regard, little has been done so far to statistically assess the altered pattern using whole brain electroencephalography. In this study, resting state EEG data of 39 outpatients with OCD and 19 healthy controls (HC) were recorded. After, brain functional network was estimated from the cleaned EEG data using the weighted phase lag index algorithm. Output matrices of OCD group and HCs were then statistically compared to represent meaningful differences. Significant differences in functional connectivity pattern were demonstrated in several regions. As expected the most significant changes were observed in frontal cortex, more significant in frontal-temporal connections (between F3 and F7, and T5 regions). These results in OCD patients are consistent with previous studies and confirm the role of frontal and temporal brain regions in OCD. Keywords: Electroencephalography (EEG), Obsessive-compulsive disorder (OCD), functional connectivity (FC), weighted phase lag index (WPLI)
INTRODUCTION Obsessive–compulsive disorder (OCD) is a neuropsychiatric disorder with a lifetime occurrence of 2–3 % (Horwath and Weissman,
2000). OCD is a common mental illness characterized by the obsessions and/or compulsions. Obsessions are unwanted, intrusive and recurrent thoughts that are frequently repeated and usually person attempts to relieve
1090
EXCLI Journal 2018;17:1090-1100 – ISSN 1611-2156 Received: September 26, 2018, accepted: October 31, 2018, published: November 08, 2018
the distress of disturbing thoughts by repeated behaviors and/or repetitive mental acts in order to reduce or prevent anxiety and some dreaded conditions or events (compulsions) (American Psychiatric Association, 2013). The notable symptoms of OCD are not always described by the abnormal behaviors; instead, it can also contain deficits in cognitive functions including delayed response inhibition, impaired attentional set shifting, planning, decision-making (Abramovitch et al., 2013; Yazdi-Ravandi et al., 2018), visualspatial skills, and speed of information processing (Greisberg and McKay, 2003; Keefe, 1995; Kuelz et al., 2004; Rao et al., 2008; Shin et al., 2008). Moreover, studies over the past two decades have shown that the brain structural and functional changes in OCD are associated with patients abnormal behavior and cognitive dysfunction (Benzina et al., 2016; Friedlander and Desrocher, 2006; Lewin et al., 2014; Radmanesh et al., 2008; Zhuo et al., 2017). For instance, decreased volume of caudate nucleus (Parmar and Sarkar, 2016; Robinson et al., 1995), Globus pallidus, putamen and striatal region (Ferrari et al., 2008) and overall cortex size have been reported in OCD patients as compared to healthy controls (Bedard et al., 2009; Szeszko et al., 1999). In addition, recent neurobiological studies of OCD recommend that the clinical symptoms and cognitive functions such as executive functions (Burguiere et al., 2015), working memory (Li and Mody, 2016), inhibitory control, (Ham et al., 2013) of OCD individuals are associated with dysfunction in the cortico–striato–thalamo–cortical circuitry. The dysfunctions of cortico–striato–thalamo– cortical circuitry are mainly observed at the orbitofrontal cortex (OFC), dorsolateral prefrontal cortex, and caudate nucleus (Alexander et al., 1986; Groenewegen and Uylings, 2000; Rotge et al., 2009; Saxena and Rauch, 2000). It is supposed that this circuit is explicitly linked to the executive cognitive functions (Cavedini et al., 2006). Alteration of frontal cortex connections to basal ganglia (Strobel et al., 2007), and striatum (Melloni et al., 2012; Nakao et al., 2014;
Arnsten and Casey, 2011; Robbins et al., 2012) have also been reported in the OCD which present a hyperactivity in the limbic system and the associated cortical regions (Chamberlain et al., 2008). These functional changes also associate with behavioral and cognitive deficits in OCD. For instance, hyperactivity of frontal cortex is negatively correlated with neuropsychological model of the disorder (Ruchsow et al., 2007) which is interpreted as a sign of disrupted inhibitory process (Adler et al., 2000) and decision making (Noël et al., 2006). In addition, alteration of connection between cortical regions and subcortical regions such as striatum and thalamus could also influence diverse computational activities, including reward processing, habit formation, motor control and action selection (Arnsten and Casey, 2011; Robbins et al., 2012) which are observed in OCD. Although alterations of brain functions in OCD have been investigated using various neuroimaging modalities, relatively less is known about using the electroencephalography technique (Ortigue et al., 2009). Previous EEG studies have shown a decreased beta and an increased theta oscillation in OCD patients mainly at the frontal and the fronto-temporal regions (Prichep et al., 1993; Locatelli et al., 1996; Bucci et al., 2004). In addition, changes in frontal asymmetry at lower alpha band (Wiedemann et al., 1999; Ischebeck et al., 2014), lower EEG complexities at the prefrontal and the fronto-temporal regions have also been reported (Aydin et al., 2015). Moreover, functional communication between several brain regions entitled as functional network are also disrupted (Desarkar et al., 2007; Velikova et al., 2010). The functional networks could be investigated using various techniques including coherence (Velikova et al., 2010), partial cross correlation (Jalili and Knyazeva, 2011), mutual information (Aydin et al., 2015) and phase lag index (Stam et al., 2007; Vinck et al., 2011). In this study, we hypothesized that alteration of functional connectivity pattern in OCD occurs in a frequency specific manner. Our aim was to investigate the potential of using this pattern as
1091
EXCLI Journal 2018;17:1090-1100 – ISSN 1611-2156 Received: September 26, 2018, accepted: October 31, 2018, published: November 08, 2018
a biomarker in clinical applications. However, functional connectivity index measured by EEG signal is very sensitive to noise. Therefore, the most test-retest reliable method, weighted phase lag index (WPLI), was chosen to estimate the functional connectivity pattern. The WPLI is an extension of phase lag index that calculate a measure of phase synchrony between two signals considering a consistent lag between their phases. It has been shown that the WPLI is less sensitive to zero-lag phase-relations that could be caused by volume conduction effects (Hardmeier et al., 2014; Ortiz et al., 2012). Using the WPLI, the significant altered connections and the altered frequency bands were examined which are described in the following sections. MATERIALS AND METHODS Participants The current study was conducted in psychiatric ward of the Farshchian (Sina) hospital of Hamadan city in 2016. Thirty-nine patients (25 female, age: 34.76±10.35 years) meeting DSM-IV-TR criteria for OCD and 19 healthy controls (11 female, age: 31.94 ± 8.22 years) who matched with OCD group were recruited. The study was reviewed and approved by the local ethical committee of the Hamadan University of Medical Sciences. An informed written consent was obtained from each subject prior to participation in the study. All patients were taking selective serotonin reuptake inhibitors (SSRIs). Patients with following criteria were included in this study: a) OCD diagnosis by a psychiatrist according to the DSM-IV-TR criteria and based on structured clinical interview, b) an age range between 18 and 60 years, and c) at least score of 16 on the Yale-Brown obsessive-compulsive scale (Y-BOCS). In addition, the following exclusion criteria was also considered: a) any current psychiatric disorder other than OCD diagnosed, b) history of drug and/or alcohol abuse or dependency, C) any serious concomitant general medical condition or neurologic
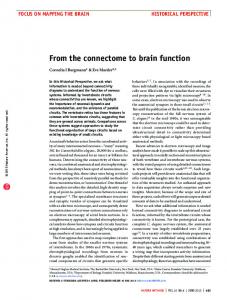
disease, d) history of serious head injury e) intellectual disability, f) electroconvulsive therapy in the last year, g) physical disability (e.g. blindness, deaf, speech problems, paralysis and amputation), h) pregnancy and any clinical conditions that could significantly affect the EEG. In addition, healthy subject with life time and current of clinical psychiatric disorders were excluded from the study. Table 1 presents some important statistical information about the two groups involved in this study. The gender, handedness and age were not significantly different between the groups, therefore, their impacts on the final outcome was ignored. Demographic and clinical information was obtained from a semi-structured interview. OCD severity was also assessed using the Yale-Brown Obsessive-Compulsive Scale (YBOCS) (Goodman et al., 1989). Neurophysiological data The EEG data acquisition was carried out between 9 and 11 a. m. on the Farshchian Sina hospital of Hamadan city using a Cadwell Easy II Amplifier with 19 Ag/AgCl surface electrodes including FP1, F3, F7, C3, T3, T5, P3, O1, Fz, Cz, Pz, FP2, F4, F8, C4, T4, T6, P4 and O2. The electrodes were placed on the scalp according to the 10-20 international system via Electro-Caps (Electro-Cap International, Inc.) with Cz as the reference electrode. The electrode impedance was smaller than 5 kΩ throughout the session. The EEG data was recorded in eyes-open resting state with a sampling rate of 200 Hz. The experimental design is shown in Figure 1.
1092
EXCLI Journal 2018;17:1090-1100 – ISSN 1611-2156 Received: September 26, 2018, accepted: October 31, 2018, published: November 08, 2018
Table 1: Demographic characteristics of the participants in this study Groups Characteristics
OCD (n = 39)
HC (n = 19)
Gender (M/F)
14 / 25
8 / 11
Handedness (R/L)
36 / 3
18 / 1
Age (years)
34.76 ± 10.35
Medication at time of study, n (%), range dose
Medication Sertraline Citalopram Escitalopram Fluoxetine Fluvoxamine Paroxetine Obsession
Y-BOCS
11.89 ± 2.47 Max = 17.00 Min = 8.00
n (%) 21 (53.8) 7 (17.9) 5 (12.9) 3 (7.70) 2 (5.1) 1 (2.6) Compulsion 10.41 ± 3.01 Max = 18.00 Min = 6.00
31.94 ± 8.22 range dose 50-150 20-60 10-20 20-80 50-200 20-60 Total Scores 22.30 ± 5.11 Max = 34.00 Min = 16.00
Statistical analysis P95 % t-test value CI -0.338 -0.450 0.654 to 0.214 -0.120 0.337 0.737 to 0.169 -2.627 1.037 0.304 to 8.271
---
---
---
---
---
---
---
---
Abbreviations: OCD - Obsessive compulsive disorder, HC - Healthy control, CI - Confidence interval, Y-BOCS -Yale-Brown obsessive compulsive scale, M – Male, F – female, R – Right and L – Left
Figure 1: Experimental design
1093
EXCLI Journal 2018;17:1090-1100 – ISSN 1611-2156 Received: September 26, 2018, accepted: October 31, 2018, published: November 08, 2018
The acquired EEG signals were then band-pass filtered between 1-40 Hz using a basic FIR filter with a zero phase shift. Then, the filtered data was segmented to trials of 3 seconds. Subsequently, artifacts were removed using the independent component analysis followed by a visual inspection. The channels diagnosed as bad using the kurtosis measure were interpolated. Then, the re-referenced EEG data to average channels were used to estimate the brain functional connectivity network. Since the brain works in a frequency specific manner, the functional connectivity were calculated for each of the conventional frequency bands separately, the implied frequency bands including delta (1–4 Hz), theta (4–8 Hz), alpha I (8–10 Hz), alpha II (10–12 Hz), beta I (12–15 Hz), beta II (15– 18 Hz), beta III (18–25 Hz), beta IV (25–30 Hz) and lower gamma band (30–40 Hz). The process of EEG data was entirely performed in MATLAB R2016a (The MathWorks Inc., Natrick, USA) using the EEGLAB v13.6.5b toolbox. The functional connectivity could be estimated using various approaches such as coherence (Nunez et al., 1997; Srinivasan et al., 2007), partial correlation (Zhou et al., 2009; Jalili and Knyazeva, 2011; Wang et al., 2016), mutual information (Aydin et al., 2015) and phase lag index (Stam et al., 2007; Vinck et al., 2011). In this study, the WPLI was implied to identify interdependencies and interaction between time series of each pairs of electrodes. The WPLI has better test-retest reliability as compared to other functional connectivity measures (Hardmeier et al., 2014).
where Y* represents the complex conjugate of Y. Subsequently, the complex non-diagonal part of C is considered as Z to focus on a particular frequency of interest f. Then, PLI is calculated by taking absolute value of the sign of the imaginary part of Z: PLI ≡ | E[sign(Im(Z))] |. In fact, uncorrelated noise sources will motive an increase of signal power and weighting of cross spectrum limits the influence of cross-spectrum elements around the real axes. The real axes have a higher probability of risk in changing their “true” sign with small noise disorderliness. Therefore, the WPLI that was proposed by Martin Vinck and colleagues (2011) is calculated by weighting the cross-spectrum according to the magnitude of the imaginary component and would be more robustness to noise as compared to the PLI, coherence, and imaginary coherence (Ortiz et al., 2012).
Weighted Phase Lag Index In the first stage, Fourier transform of two real-valued signals x(t) and y(t) are computed and labeled as X(f) and Y(f). Then, X and Y are used to compute the complex cross-spectrum
RESULTS
C(f) = X(f)Y*(f) of two signals,
Statistical analysis In the final stage, group differences in functional connectivity between OCD patients and HCs were statistically evaluated. Statistical comparisons were performed using a non-parametric permutation t-test. The normality assumption for the functional connectivity was checked using the Kolmogorov– Smirnov test. Then, a two-tailed paired t-test was applied to identify the significant changes of functional connectivity in OCDs as compared to HCs. A threshold of p