Paper category: Evolvable Hardware
Digital FIR Filter Design at Gate-level using Evolutionary Algorithms Julian F. Miller School of Computing, Napier University, 219 Colinton Road, Edinburgh, EH14 1DJ, UK. Email:
[email protected] Telephone: +44 131 455 4318
Abstract. Traditionally digital filters are designed using the concept of a linear difference equation with the output response being a weighted sum of signal samples with usually floating point coefficients. Unfortunately such a model is necessarily expensive in terms of hardware as it requires many large bit additions and multiplications. In this paper it is shown how it is possible to evolve a tiny feed-forward rectangular array of logic gates to perform various filtering tasks – lowpass, bandpass, and multiband. The circuit is evolved by assessing its response to digitised pure sine waves. Some of the evolved circuit possess almost linear properties, which means that they are capable of filtering composite signals which have not been encountered in training.
1. Introduction The difference equation is a fundamental concept employed in the construction and analysis of digital filters [10]. Formally this is represented in the following way. The output of the filter at time n, y(n), may be a function of N samples of the signal x(n-i) at earlier times, and may also, if feedback is present, involve earlier outputs y(n-i) given by the following equation: N −1
M
i =0
i =1
y (n) = ∑ ai x(n − i ) + ∑ bi y (n − i )
(1)
where the coefficients ai and bi are real valued floating-point numbers. The essential problem of filter design is the choice of {ai}, {bi}, N, and M, so that the filter has the desired behaviour (i.e. frequency response). In practice the coefficients {ai}, {bi} are of finite precision. The practical requirements of implementing such a system in hardware consists of providing a number of shift registers, multipliers, and adders. Large bit multipliers are very costly in hardware terms. Three of the most important factors in the design of digital filters are quality of signal response, size (cost) of hardware implementation, and speed of operation. There are many traditional approaches which have been developed to address these issues [10]. In particular one popular method for reducing the implementational complexity is to restrict the filter coefficients to integer coefficients, see [6] and references therein. Recently, researchers have started to explore the application of evolutionary algorithms to filter design [1, 4, 5, 7, 8, 18, 20, 21, 22]. The essential idea employed by most of these authors is to use an evolutionary algorithm to optimise the filter coefficients. This may be in combination with finite wordlength analysis [1, 8] for IIR filter design, or it may be in an adaptive context [7, 21]. Other workers have employed evolutionary algorithms to optimise coefficients together with add and shift operations in so-called multiplier-less designs [18, 20, 22]. In [5] a genetic algorithm was used to design an efficient non-linear filter, known as a stack filter, for signal noise reduction by finding a suitable positive boolean function (PBF). The PBF could be represented as a boolean sum of products, involving AND gates and OR gates. In [3] the authors evolved stack filters using both GA and GP techniques. The work presented in this paper is an extension of recent work which looked at evolving low pass filters [15]. The objective of this work is to further extend that work and explore at a logic gate level whether it is possible to evolve networks of logic gates to carry out conventional filtering tasks such as low pass, band pass, and multi-band filters. This is an interesting thing to do for two main reasons. Firstly to explore the concept of digital filtering in a space of possibilities which is considerably larger and richer than the traditional human, top-down, difference equation method. Secondly to see how effective a microscopic number of logic gates might be in a filtering task. The pioneering concept of gate-level evolution of digital functions was developed in [9]. In [16] the authors generalised the concept of gate-level evolution to the so-called functional level, and they showed how it was possible to carry out adaptive equalisation on a communications channel with superior bit error rates to the conventional least mean squares method. These authors believed that it would not be possible to achieve real-world performance using a gate-level approach. One of the objectives of the work presented here is to show that that the possibilities afforded by gate-level evolution have been left largely unexplored, and that there remains much fundamental work to be done at this level. An additional motivation for attempting this work is the enormous potential for new knowledge discovery afforded by the simple nature of logic functions. In other words, can new principles be extracted from gate-level evolution which can inspire and contribute to new methodological paradigms? There are of course enormous questions which need to be addressed if such a filtering method is to become practicable. Foremost among these would be the
question of linearity. If a gate array is to be trained to carry out a filtering task then can this be done in such a way that composite signals, which can be represented as weighted sums of sine waves, will also be filtered? This would imply that the circuit at least be weakly linear. The findings presented in this paper are encouraging in this regard, as in section 4 it is shown that the some of evolved gate arrays do appear to be quasi-linear (especially in the lowpass scenario). The actual method employed here to evolve a gate array is developed from earlier work in [11-14] and is similar to a method called Parallel Distributed Genetic Programming (PDGP) [17]. This method is explained in section 2. In earlier work [12-14], the objective was to synthesise an entire truth table. This becomes increasingly time consuming and difficult as the number of inputs grow. It is obvious that attempting to evolve truth tables of larger sizes will not be feasible. It was argued in [11] that the real applications for gate-array evolution probably lie in real number mapping problems, where the digitised real numbers are presented to a circuit and a digitised real number output is desired. In such a scenario the number of input conditions is determined by the problem and is not necessarily an exponential function of the number of inputs. Such a scenario is ideally furnished by the digital filtering task. In this paper three filtering tasks are considered: lowpass, bandpass, and multiband. The details of this are explained in section 3. In section 4 the evolved filtering characteristics of the gate array are presented, including some results which show the quasi-linear behaviour. These are discussed in section 5, and conclusions are given in section 6.
2. Gate-level evolution of digital circuits The chromosome representation used is best explained with a simple example. Fig. 1 is shows a small gate array consisting of four logic cells. The logic cells in this case have functions XOR, AND, or MUX (multiplexer). The gate array implements the one-bit adder (with carry-in). The circuit in question actually arose in an earlier experiment reported elsewhere [14] and is quite novel in its own right. A, B, and Cin represent the primary inputs. Cout and Sum are the output bits of the adder. Each cell is assumed to possess three input connections. If the cell function does not require inputs then the corresponding genes are ignored. For example the upper right cell (output 5) below has input connections 3, 2, 1. This means that the first input is connected to the output of the cell with output label 3 (upper left), the second input is connected to the primary input Cin, and the third input is connected to primary input B. The functionality of each cell is expressed as the fourth gene associated with each cell. The primary outputs of the gate array are also expressed as connections. For example Cout is connected to the output of the cell with output label 6. The gate array is envisaged as being divided into vertical columns of cells and the representation is so constrained that columns of cells may only have their inputs connected to connection points on their left. This ensures the feed-forward nature of the circuit and removes any time dependent behaviour. Actually the connectivity is further constrained by the presence of a parameter called levels-back, and denoted by l, which dictates the number of columns (including the primary inputs at column zero) to which the inputs of cells in column l may be connected. The purpose of this is explained elsewhere [14]. Genotype
0 1 0 10
002 6
3 2 1 10
0 2 3 16
6 5
Fig. 1. Genotype and phenotype for the gate array of logic cells which implement a one-bit adder (with carry in) where the emboldened integers are the cell functions. The cell functions can be in general be chosen to be any subset of the following ( in C notation), where for brevity a&b is denoted ab, and inversion is indicated by an underline: 0 1 2 3 4 5 6
7
8
9
10
11
12
13
14
15
16
17
18
19
20
0 1 a b a b ab
ab
ab
ab
a^b
a^b
a|b
a|b
a|b
a|b
ac |bc
ac |bc
ac |bc
ac |bc
a^(bc)
Fig 2. Allowed cell functions Functions 16-19 describe various multiplexers and 20 describes a Reed-Muller ULM. The last five functions prove to be very effective components in assisting the evolutionary process probably due to their flexibility in that they are all universal logic modules and allow the synthesis of any logic function of one or two variables. The genetic algorithm employed random
mutation, which was defined as a percentage of genes in the population which were mutated. It respected the feed-forward nature of the circuits and also the different alphabets associated with connections and functions. When crossover was used it was of uniform type and employed a 50% genetic exchange. Elitism was always used as it is markedly beneficial [13]. A probabilistic tournament selection method (size 2) was used in which the winner of the tournament was selected with a certain probability (between 0.5 and 1.0). In some cases a (1+ λ ) evolutionary strategy (ES) [2] was used to evolve the filter (with uniform mutation). In this case a population of random chromosomes is generated and the fittest chromosome selected. The new population is then filled with mutated versions of this. Rigorous experiments were not conducted to assess the relative effectiveness of the basic search algorithms chosen. The practical advantages of either the GA, or ES for filter evolution remain a topic for future research.
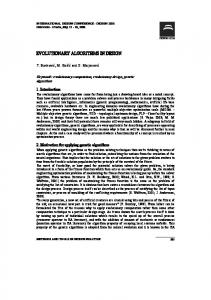
3. Evolving a filter response with a gate array The incoming analogue signals which are to be processed by the gate array are sampled at frequency f, with sampling period p. Thus the number of samples used, s, is given by s=fp. The samples are digitised and represented by a wordlength of w bits. In a FIR filter of order n one therefore must collect nw bits at each sampling time. These nw bits for the s samples are collected and represent the input conditions to the gate array. For each nw input bits the gate array must produce w output bits. In this way a set of input-output conditions are defined. When s samples have been collected the discrete fast fourier transform (DFFT) is taken. A program which was freely available in [8] was used to do this. In this way the frequency characteristics of the evolving gate array can be assessed for each input signal. The input signals chosen were pure sine waves with zero phase. They had frequencies which were integral multiples of the fundamental f1 (1/p) up to the Nyquist frequency, fn (half sampling frequency) minus 1.
Fig. 2. The training scenario for evolving a gate array with filtering properties The sine waves were translated by the addition of a d.c. component so that they assumed only positive values, this removed the need for two’s complement number representation. One can envisage this more clearly by noting that the fundamental corresponds to a single exact sine cycle fitting into the sampling window. The entire arrangement is shown in Figure 2. In this figure an input sine wave is shown on the left which is digitised to binary numbers with w=4 , and n=2. An entire history of samples are collected for each sine wave. These are the input conditions presented to the gate array. On the right of the gate array is shown the outputs of wordlength equal to 4 bits. To evaluate the fitness of a chromosome each digitised sine wave with frequency f is presented to the gate array and the DFFT of the output response is calculated. The power in the frequency domain W(f), defined as the modulus of the output response in the complex frequency domain, is normalised by dividing by the maximum power associated with the DFFT of a pure sine wave. The d.c. component of the output is ignored. Two methods of fitness assignment were used. Define the maximum power over all frequencies , W max , and the maximum power i over all frequencies excluding fi , Wmax , i Wmax = max{W ( f j ), ∀j : f 1 ≤ f j ≤ f n − 1} , W max = max{W ( f j ), ∀j : j ≠ i, f 1 ≤ f j ≤ f n − 1}
Define δ i to be 1 if the frequency i is to be passed, and 0 if it is to be stopped. The elementary fitness contribution for the DFFT of the output signal, x i , is given by,
(2)
i ) + (1 − δ i )(1 − Wmax ) x i = δ i (W ( f i ) − W max
(3)
In the first definition of fitness (passband experiments only) the fitness contributions were defined in (3). In the second method of fitness assignment (a later refinement), the fitness is calculated with a user defined set of frequency rewards ri (fitness profile). The fitness is given by (4) below, where n + , and n − , represent the number of frequencies to be passed, and stopped, respectively (over all frequencies up to fn –1). r r i ) i + (1 − δ i )(1 − W max ) i (4) x i = δ i (W ( f i ) − W max n+ n− Note that the definition given in (4) is scale invariant and just assigns a fixed maximum fitness contribution for the pass regions and stop regions irrespective of their size. The total fitness x associated with a given chromosome is then given by the sum of the components xi for all frequencies up to fn-1. These definitions of fitness mean that one is trying to suppress all sine waves with frequencies in stop region, and trying to enhance only pure frequencies (uncorrupted sine waves) in the pass region.
4. Results The experimental parameters for this paper are given below, the nominal sampling period p was chosen to be 1 for convenience. Thus the sampling frequency f equals the number of samples s. All filters were evolved with the following with s=128, w =8, filter order = 4. The only allowed function for all experiments was a multiplexer (type 16) LOWPASS FILTER
61
58
55
52
49
46
43
40
37
34
31
28
25
22
19
16
13
10
7
4
1 .4 1 .2 1 0 .8 0 .6 0 .4 0 .2 0 1
Relative power
The experimental parameters were: normalised passband cutoff = 0.08 (10.24 un-normalised), population size = 10, breeding rate = 100%, mutation rate = 2%, crossover rate = 50%, uniform crossover, number of generations = 10,000, elitism, size 2 tournament selection, acceptance probability is 0.7, geometry of gate array 9 rows and 9 columns, levels-back l = 9. The results shown below are for the best of ten runs of the genetic algorithm under the above conditions. The frequency response of the evolved lowpass .filter is shown in Figure 3.
F r e q u e n c y (sa m p lin g /1 2 8 )
Fig 3. Frequency response of evolved lowpass filter The response of the evolved filter to input signals of various frequencies both in the passband and the stopband are given below. 300
300
250
250
200
200
150
150
100
100
50
50
0
0
1
12 23 34 45 56 67 78 89 100 111 122
1
12
23
34
45
56
67
78
89 100 111 122
1 .4
1 0 .8 0 .6 0 .4 0 .2
F r e q u e n c y (sa m p lin g /1 2 8 )
Fig 4. Incident signal f1 , output response and frequency response
61
58
55
52
49
46
43
40
37
34
31
28
25
22
19
16
13
10
7
4
0 1
Relative power
1 .2
300
250
250
200
200
150
150
100
100
50
50
0
Relative Power
300
1.4 1.2 1 0.8 0.6 0.4 0.2 0 1
0 1 12 23 34 45 56 67 78 89 100111 122
6
11
16
21
1 12 23 34 45 56 67 78 89 100111 122
26
31
36
41
46
51
56
61
Frequency (sampling/128)
Fig 5. Incident signal f5 , output response and frequency response 300
300
250
250
200
200
150
150
100
100
50
50
0
0
1
12
23
34
45
56
67
78
89 100 111 122
1
12
23
34
45
56
67
78
89 100 111 122
0
1 12 23 34 45 56 67 78 89 100111122
61
57
53
49
45
41
37
33
29
50
0
25
100
50
21
150
100
17
150
1.4 1.2 1 0.8 0.6 0.4 0.2 0 9
200
13
250
200
5
300
250
1
300
Relative power
Fig 6. Incident signal f20 , and output response
Frequency (sampling/128)
1 12 23 34 45 56 67 78 89 100111122
1 12 23 34 45 56 67 78 89 100 111 122
58 61
49 52 55
43 46
1 12 23 34 45 56 67 78 89 100 111 122
37 40
1
0
0
34
50
28 31
100
50
25
150
100
22
200
150
16 19
250
200
13
250
1.4 1.2 1 0.8 0.6 0.4 0.2 0 7 10
300
4
300
Relative power
Fig 7. Incident signal 0.5(f1 + f2 ), output response and frequency response
Frequency(sampling/128)
Frequency (sampling/128)
Fig 9. Incident signal 0.33(f2 + f4 + f6 ), output response and frequency response
61
57
53
49
45
41
37
1 12 23 34 45 56 67 78 89 100 111 122
33
12 23 34 45 56 67 78 89 100 111 122
29
0 1
25
50
0
21
100
50
17
150
100
1.4 1.2 1 0.8 0.6 0.4 0.2 0 13
200
9
250
150
5
300
200
1
250
Relative power
Fig 8. Incident signal 0.5(f3 + f25 ), output response and frequency response
MULTI-BAND FILTER In later experiments (which were not exhaustive) a form of (1+ λ ) Evolutionary Strategy was used to find a multi-band filter with two pass regions having frequencies 1-8, and 25-32. Uniform mutation was used equal to 2% of the genes in a chromosome, which in this case equates to 8 genes per chromosome. λ in this case was set at 19. The number of generations was 10,000. The geometry was 10 rows by 10 columns. In this experiment a frequency dependent reward profile was defined as shown in Fig. 10, the fitness was calculated using equation 2. The evolved filter response is shown in Fig. 11. The reason for choosing this particular reward profile are as follows. There appears to be a natural bias towards lowpass behaviour. Thus the incremental fitness rewards for transparency in the frequency range 1-8 (2) was chosen to be less than the reward for transparency in the second pass band, with frequency range 25-32 (3). The reward for the stop region between the two bands was also higher to encourage opacity. The highest rewards for opacity (4) were awarded for a few frequencies either side of the pass regions. This was to encourage a sharp transition from transparency to opacity. 5
Reward
4 3 2 1 61
58
55
52
49
46
43
40
37
34
31
28
25
22
19
16
13
10
7
4
1
0 F r e q u e n c y ( s a m p lin g /1 2 8 )
Fig 10. Reward profile for evolving the multi-band filter 1 .4
Relative power
1 .2 1 0 .8 0 .6 0 .4 0 .2
F r e q u e n c y
(s a m
61
58
55
52
49
46
43
40
37
34
31
28
25
22
19
16
13
10
7
4
1
0 p l in g / 1 2 8 )
Frequency (sampling/128)
1 11 21 31 41 51 61 71 81 91 101 111 121
Frequency (sampling/128)
Fig 13. Incident signal 0.5(f2 + f28 ), output response and frequency response
61
57
41
37
0
1 11 21 31 41 51 61 71 81 91 101 111 121
33
1
50
0
29
100
50
25
150
100
21
200
150
17
250
200
13
250
1.2 1 0.8 0.6 0.4 0.2 0 9
300
5
300
Relative power
Fig 12. Incident signal f4 , output response and frequency response
61
53
58
49
55
46
49
52
43
40
45
37
34
31
1
1 11 21 31 41 51 61 71 81 91 101 111 121
28
0 1 11 21 31 41 51 61 71 81 91 101 111 121
25
50
0
22
100
50
19
150
100
16
200
150
13
200
1.4 1.2 1 0.8 0.6 0.4 0.2 0 7
250
10
300
250
4
300
Relative power
Fig 11. Frequency response of evolved multi-band filter
BANDPASS FILTER A bandpass filter was evolved (see Fig. 14). The passband was 26-35. This proved to be the most difficult task of the three studied. Again a (1+ λ ) Evolutionary Strategy was used with λ = 49. Mutation rate per chromosome = 2%, 10,000 generations, and connectivity l = 5. In this case the reward profile was uniformly set to 1.0.
F r e q u e n
c y
( s a m
61
58
55
52
49
46
43
40
37
34
31
28
25
22
19
16
13
10
7
4
1
Relative power
1 .4 1 .2 1 0 .8 0 .6 0 .4 0 .2 0 p lin g /1 2 8 )
Frequency(sampling/128)
(a) 0.5(f27 + f34 )
61
57
53
49
45
41
37
33
29
25
21
17
13
9
5
1.4 1.2 1 0.8 0.6 0.4 0.2 0 1
61
58
55
52
49
46
43
40
37
34
31
28
25
22
19
16
13
7
10
4
Relative power
1.4 1.2 1 0.8 0.6 0.4 0.2 0 1
Relative power
Fig. 14. Frequency response of evolved bandpass filter
Fre quency (sam pling/128)
(b) 0.5(f2 + f30 )
Fig. 15. Frequency responses of evolved bandpass filter to incident signals (a), and (b)
5. Discussion of results For the lowpass filter it can be seen that signals in the pass region are transmitted fairly cleanly (in the frequency domain), though there is still noticeable distortion of the output signal (Figs. 4 and 5). Fig. 6 shows the almost d.c. response to a signal in the stop region. Figs. 7-9 show the response of the evolved filter to three composite signals, which have never been seen by the filter before. In Fig. 7 one can see that the dominant response frequencies are f1 and f2. If the response had been perfectly linear then the relative power for these would have been identical, with zero power in all other frequencies. Clearly the evolved filter is behaving in a nearly linear fashion. In Fig. 8 a composite signal consisting of a frequency in the pass band (f3) and one in the stop region (f25) is presented. Again the pass frequency dominates but with some leakage of power to adjacent frequencies. The stop frequency is heavily attenuated. Again the filter is behaving in a quasi-linear fashion. Fig 9. Shows the near linear behaviour with a sum of three pass frequencies. Looking at the output responses it appears that the filter is exaggerating the changes in the incident signal. In the case of the multi-band problem the evolved filter transmits quite cleanly in the passband (Fig. 12) and attenuates in the stop regions, however the response to a composite signal 0.5(f2+f28) is not so linear as with the lowpass filter. Ideally both frequencies would have been transmitted without attenuation. However it can be seen that the f28 is highly attenuated (though it is still the second largest transmitted frequency). This behaviour illustrates the better response of these evolved filters to low frequency. Perhaps if the reward profile has been more biased toward transmission of higher passband frequencies a better result might have been obtained. Finally examining the results for the bandpass filter (Figs. 14-15) it can be seen that for a composite signal of two passband (f27 and f34), the filter does transmit, though with significant attenuation. Additionally, there are many other spurious frequencies present. If the composite signal has one frequency in the stopband (f3) and the other (f30) in the passband, then it should transmit the latter. However it transmits the stop frequency component f3! This evolved filter is behaving in the least linear fashion of those evolved.
6. Conclusions In this proof-of-concept paper it has been shown that it is possible to evolve filtering characteristics with a gate-array containing very few components. In some cases the evolved filter has a quasi-linear response which has emerged naturally. There is currently no mathematical framework for understanding how to design filters at this level. It is felt that the results presented here may encourage some thinking about a mathematical underpinning of this. There is still an enormous amount of further investigation to be undertaken. The work raises almost as many questions as it answers. Why is the evolved filter quasi-linear? Can one evolve it in such a way as to enhance its linearity? Would this require greater gate resources? How would the filter response to changes in phase of the incident sine waves? The results should be able to be improved with a more sophisticated evolutionary strategy. In conclusion it is felt that this work once again demonstrates the enormous capacity of a few gates to display complex behaviours, a fact which has become evident in much work in the field of evolvable hardware [19].
Bibliography GALESIA’95: Proceedings of the First IEE/IEEE International Conference on Genetic Algorithms in Engineering Systems: Innovations and Applications (GALESIA’95), No. 414, IEE, London, 1995. [1] Arslan T., and Horrocks D. H., “A Genetic Algorithm for the Design of Finite Word Length Arbitrary Response Cascaded IIR Digital Filters”, ”, pp. 276-281, GALESIA’95. [2] Bäck T., Hoffmeister F., and Schwefel H.-P., “A Survey of Evolutionary Strategies”, in R. Belew and L. Booker (eds.), Proceedings of Fourth Int. Conf. On Genetic Algorithms, San Mateo, CA, Morgan Kaufmann, pp. 2-9, 1991. [3] Beatriz Garmendia-Doval A., Mohan C. K., and Prasad M. K., “Evolving Tree Representations of Stack Filters”, in J.R. Koza et al. (eds.), Genetic Programming: Proceedings of the Third Annual Genetic Programming Conference, Morgan Kaufmann, San Francisco, CA, pp. 103-108, 1998. [4] Chellapilla K., Fogel D. B., and Rao S. S., “Gaining Insight into Evolutionary Programming Through Landscape Visualization: An Investigation into IIR Filtering”, Evolutionary Programming , pp. 407-417, 1997. [5] Delibasis K. K., Undrill P. E., and Cameron G. G., “Genetic algorithm implementation of stack filter design for image restoration”, ”, IEE Proceeedings in Vision, Image and Signal Processing, Vol. 143, No. 3, pp. 177-183, 1996. [6] Dempster A. G., and Macleod M. D., “Use of Minimum-Adder Multiplier Blocks in FIR Digital Filters”, IEEE Transactions on Circuits and Systems-II: Analog and Digital Signal Processing, Vol. 42, No. 9, pp. 569-577, 1995 [7] Esparcia Alcazar A. I., and Sharman K. C., “Some Applications of Genetic Programming in Digital Signal Processing”, in Late Breaking Papers at Genetic Programming 96, Stanford, pp. 24-31, 1996. [8] Harris S. P., and Ifeachor E. C., “Automating IIR filter design by genetic algorithm”, in, pp. 271-275, GALESIA’95. [9] Iba H., Iwata M., and Higuchi T., Machine Learning Approach to Gate-Level Evolvable Hardware, in Higuchi T., Iwata M., and Liu W., (Editors), Proceedings of The First International Conference on Evolvable Systems: From Biology to Hardware (ICES96), Lecture Notes in Computer Science, Vol. 1259, Springer-Verlag, Heidelberg, pp. 327 – 343, 1997. [10] Ifeachor E. C., and Jervis B. W., “Digital Signal Processing: A Practical Approach”, Addison-Wesley, 1993 [11] Miller J. F., and Thomson P., “Evolving Digital Electronic Circuits for Real-Valued Function Generation using a Genetic Algorithm”. Koza, John R. et al, (Editors). Genetic Programming: Proceedings of the Third Annual Conference, July 22-25, 1998, University of Wisconsin, Madison, Wisconsin. San Francisco, CA: Morgan Kaufmann pp. 863-868, 1998. [12] Miller J. F., Thomson P., “Aspects of Digital Evolution: Evolvability and Architecture”, in (Editors), Proceedings of The Fifth International Conference on Parallel Problem Solving from Nature (PPSNV), Lecture Notes in Computer Science, Vol. 1498, Springer-Verlag, Heidelberg, pp. 927-936, 1998. [13] Miller J. F., Thomson P., “Aspects of Digital Evolution: Geometry and Learning”, in Sipper M., Mange D., and PerezUribe A. (Editors), Proceedings of The Second International Conference on Evolvable Systems: From Biology to Hardware (ICES98), Lecture Notes in Computer Science, Vol. 1478, Springer-Verlag, Heidelberg, pp. 25-35, 1998. [14] Miller J. F., Thomson P., and Fogarty T. C., "Designing Electronic Circuits Using Evolutionary Algorithms. Arithmetic Circuits: A Case Study", in Genetic Algorithms and Evolution Strategies in Engineering and Computer Science: D. Quagliarella, J. Periaux, C. Poloni and G. Winter (eds), Wiley, 1997. [15] Miller J. F., “Evolution of Digital Filters Using a Gate Array Model”, EvoIASP’99 Workshop on Image Analysis and Signal Processing (submitted Dec 1998) [16] Murakawa M., Yoshizawa S., and Higuchi T., “Adaptive Equalisation of Digital Communication Channels Using Evolvable Hardware”, in Higuchi T., Iwata M., and Liu W., (Editors), Proceedings of The First International Conference on Evolvable Systems: From Biology to Hardware (ICES96), Lecture Notes in Computer Science, Vol. 1259, Springer-Verlag, Heidelberg, pp. 379 – 389, 1996. [17] Poli R., “Evolution of graph-like programs with parallel distributed genetic programming”, in Baeck T. (Editor), Genetic Algorithms: Proceedings of the Seventh International Conference, Morgan Kaufmann, pp. 346-353, 1997. [18] Redmill D. W., and Bull D. R., “Design of Low Complexity FIR Filters using Genetic Algorithms and Directed Graphs”, in Proceedings of the Second IEE/IEEE International Conference on Genetic Algorithms in Engineering Systems: Innovations and Applications (GALESIA’97), No. 446, IEE, London, 1997. [19] Sipper M., Sanchez E., Mange D., Tomassini M., Perez-Uribe A., and Stauffer A., “A Phylogenetic, Ontogenetic, and Epigenetic View of Bio-Inspired Hardware Systems”, IEEE Transactions on Evolutionary Computation, Vol. 1, No 1., pp. 83-97, 1997. [20] Sriranganathan S., Bull D. R., and Redmill D. W., “Design of 2-D Multiplierless FIR Filters using Genetic Algorithms”, pp. 282-286, GALESIA’95. [21] Sundaralingam S., and Sharman K. C., “Genetic Evolution of Adaptive Filters”, in Proceedings of DSP, London UK, pp. 47-53, 1997. [22] Wade G., Roberts A., and Williams G., “Multiplier-less FIR filter design using a genetic algorithm”, IEE Proceedings in Vision, Image and Signal Processing, Vol. 141, No. 3, pp. 175-180, 1994.